Difference between revisions of "Part:BBa K338001"
(→Contribution) |
|||
| Line 85: | Line 85: | ||
<partinfo>BBa_K338001 parameters</partinfo> | <partinfo>BBa_K338001 parameters</partinfo> | ||
<!-- --> | <!-- --> | ||
| + | |||
| + | <h1>2020 XHD-ShanDong-China’s Characterization of BBa_ K338001</h1> | ||
| + | |||
| + | <h2>Aim of experiment</h2> | ||
| + | Based on BBa_K338001 part, a genetic circuit HSdegPLCP was constructed to characterize the function of HS promoter. | ||
| + | |||
| + | <h2>Methods</h2> | ||
| + | We construct the following gene circuit based on the principles of synthetic biology, as shown in Figure 1. The HS promoter was amplified from E. coli MG1655, the vector pdegPLCP was linearized by PCR, and then the pHSdegPLCP was obtained by homologous recombination, and the recombinant plasmid was verified by PCR to ensure the success of the recombinant. | ||
| + | |||
| + | <html> | ||
| + | <body> | ||
| + | <img src="https://2020.igem.org/wiki/images/5/5d/T--XHD-ShanDong-China--Contribution-Fig1.jpeg" style="width:60%"> | ||
| + | |||
| + | </body> | ||
| + | </html> | ||
| + | |||
| + | Figure 1. Schematic diagram of expression circuit | ||
| + | |||
| + | |||
| + | The plasmid pHSdegPLCP containing K338001 part was transformed into E.coli DH5α strain, and the DH5α bacteria containing the recombinant plasmid pHSdegPLCP were cultured overnight in LB medium. Subsequently, the new LB medium was inoculated at a ratio of 1:100 and cultured at 37°C at 200 rpm for 2 hours (log phase). Subsequently, 6 tubes of 5mL LB medium were inoculated at a ratio of 1:100, 3 tubes were cultured at 37°C, and 3 tubes were cultured at 45°C. Take 200uL to 96-well plate every 0.5h, and measure the concentration of amilCP with a microplate reader. The concentration of amilCP (OD588) and OD600 value are measured simultaneously. | ||
| + | |||
| + | <h2>Results</h2> | ||
| + | |||
| + | We used the E.coli MG1655 as template and then performed PCR to obtain the heat shock(HS) promotor fragment. We use plasmid pdegPLCP as a template to obtain a linearized plasmid vector by PCR amplification. As shown in Fig 2, the size of the PCR product was as expected. Then use Gibson assembly to obtain the recombinant plasmid pHSdegPLCP. The PCR verification showed that the recombination was successful, as shown in Figure 3. | ||
| + | <html> | ||
| + | <body> | ||
| + | <img src="https://2020.igem.org/wiki/images/5/5a/T--XHD-ShanDong-China--Contribution-Figure2.jpeg" style="width:60%"> | ||
| + | |||
| + | </body> | ||
| + | </html> | ||
| + | |||
| + | Figure2 Gel electrophoresis of HSP and linearized pdegP_CP PCR product | ||
| + | |||
| + | |||
| + | <html> | ||
| + | <body> | ||
| + | <img src="https://2020.igem.org/wiki/images/b/ba/T--XHD-ShanDong-China--Contribution-Figure3.jpeg" style="width:60%"> | ||
| + | |||
| + | </body> | ||
| + | </html> | ||
| + | |||
| + | Figure3. Gel electrophoresis of PCR verification | ||
| + | |||
| + | |||
| + | The map of plasmid pHSdegPLCP obtained by the recombination is shown in Figure 4. It contains a chloramphenicol resistance gene, and HSP can activate the expression of degP and amilCP. | ||
| + | |||
| + | <html> | ||
| + | <body> | ||
| + | <img src="https://2020.igem.org/wiki/images/b/b7/T--XHD-ShanDong-China--Contribution-Figure4.jpeg" style="width:60%"> | ||
| + | |||
| + | </body> | ||
| + | </html> | ||
| + | |||
| + | Figure4. plasmid map of pHSdegPLCP | ||
| + | |||
| + | |||
| + | The concentration of chromoprotein is obtained by dividing the A588 of the bacterial solution by A600. As shown in Figure 4, the chromoprotein amilCP shows different expression levels at different temperatures. | ||
| + | |||
| + | <html> | ||
| + | <body> | ||
| + | <img src=" https://2020.igem.org/wiki/images/b/b4/T--XHD-ShanDong-China--Contribution-Figure5.jpeg " style="width:60%"> | ||
| + | |||
| + | </body> | ||
| + | </html> | ||
| + | |||
| + | Figure5. amilCP production per cell mass unit | ||
| + | |||
| + | |||
| + | <html> | ||
| + | <body> | ||
| + | <img src="https://2020.igem.org/wiki/images/7/70/T--XHD-ShanDong-China--Contribution-Figure6.jpeg" style="width:60%"> | ||
| + | |||
| + | </body> | ||
| + | </html> | ||
| + | |||
| + | Figure6. Comparison of the color of bacterial liquid at different temperatures | ||
| + | |||
| + | |||
| + | <html> | ||
| + | <body> | ||
| + | <img src=" https://2020.igem.org/wiki/images/e/ee/T--XHD-ShanDong-China--Contribution-Figure7.jpeg " style="width:60%"> | ||
| + | |||
| + | </body> | ||
| + | </html> | ||
| + | |||
| + | Figure7 .Growth curve at different temperatures | ||
| + | |||
| + | |||
| + | <h2>Conclusion</h2> | ||
| + | From the results, we can clearly see that in a high temperature environment, HSP can quickly activate the expression of degP and chromin. | ||
Revision as of 08:29, 25 October 2020
Heat Shock Promoter (HSP)
This is a modified BBa_K112400 heat shock promoter in BBa standard.
Usage and Biology
BioBrick Characterization
Effect of Heat Shock Temperature
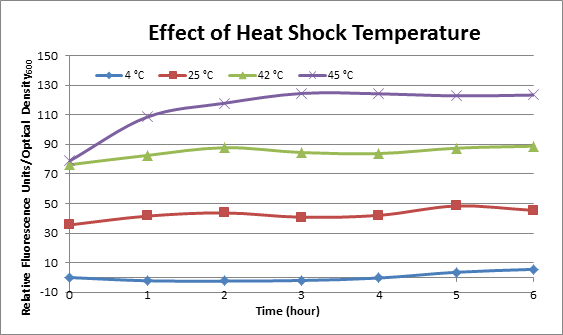
DH5α cells containing HSP-GFP were incubated at 4°C, 25°C, 42°C, and 45°C separately for two hours. Measurements of the fluorescence level of GFP were taken using the plate reader at 20 minute intervals and were averaged over a 1 hour interval. The vertical axis is raw fluorescence units normalized by OD600. Normalized value of 4°C at t=0 was subtracted from all the values to show a relative difference.
This experiment data suggests that heat shock promoter activity increases with heat shock temperature.
Effect of Heat Shock Duration
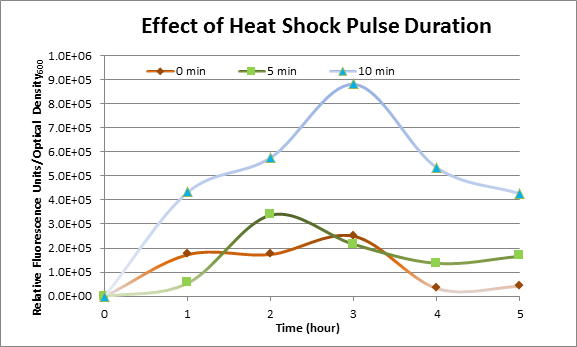
DH5α cells containing HSP-GFP were heat shocked at 42°C for 0 min (kept at room temperature), 5 min and 10 min separately. Measurements of the fluorescence level of GFP were taken using the plate reader at 15 minute intervals and were averaged over a 1 hour interval. The vertical axis is raw fluorescence units normalized by OD600.
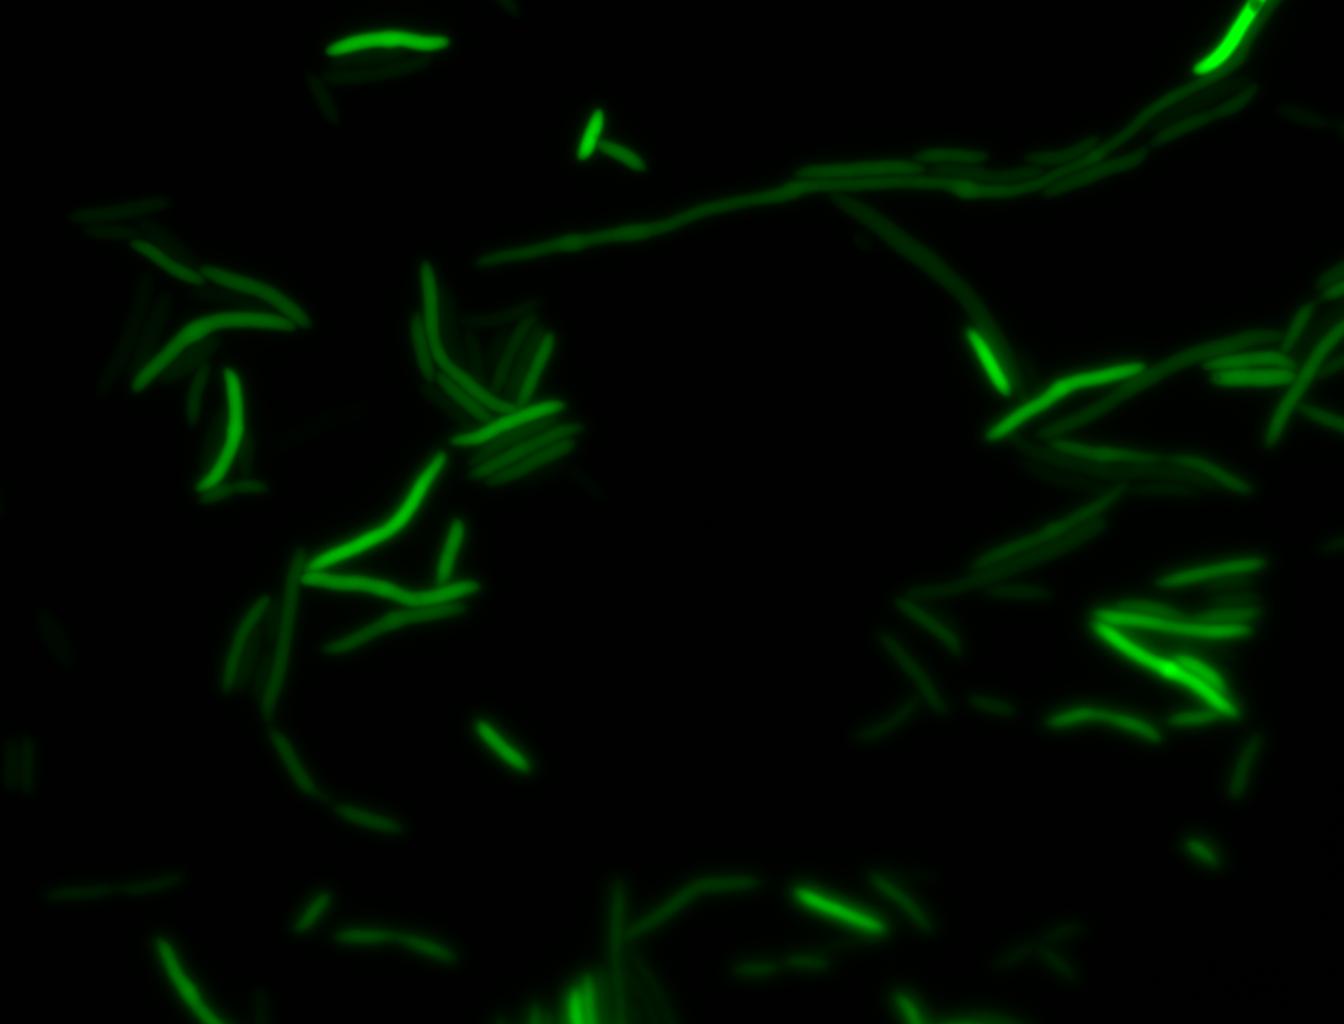
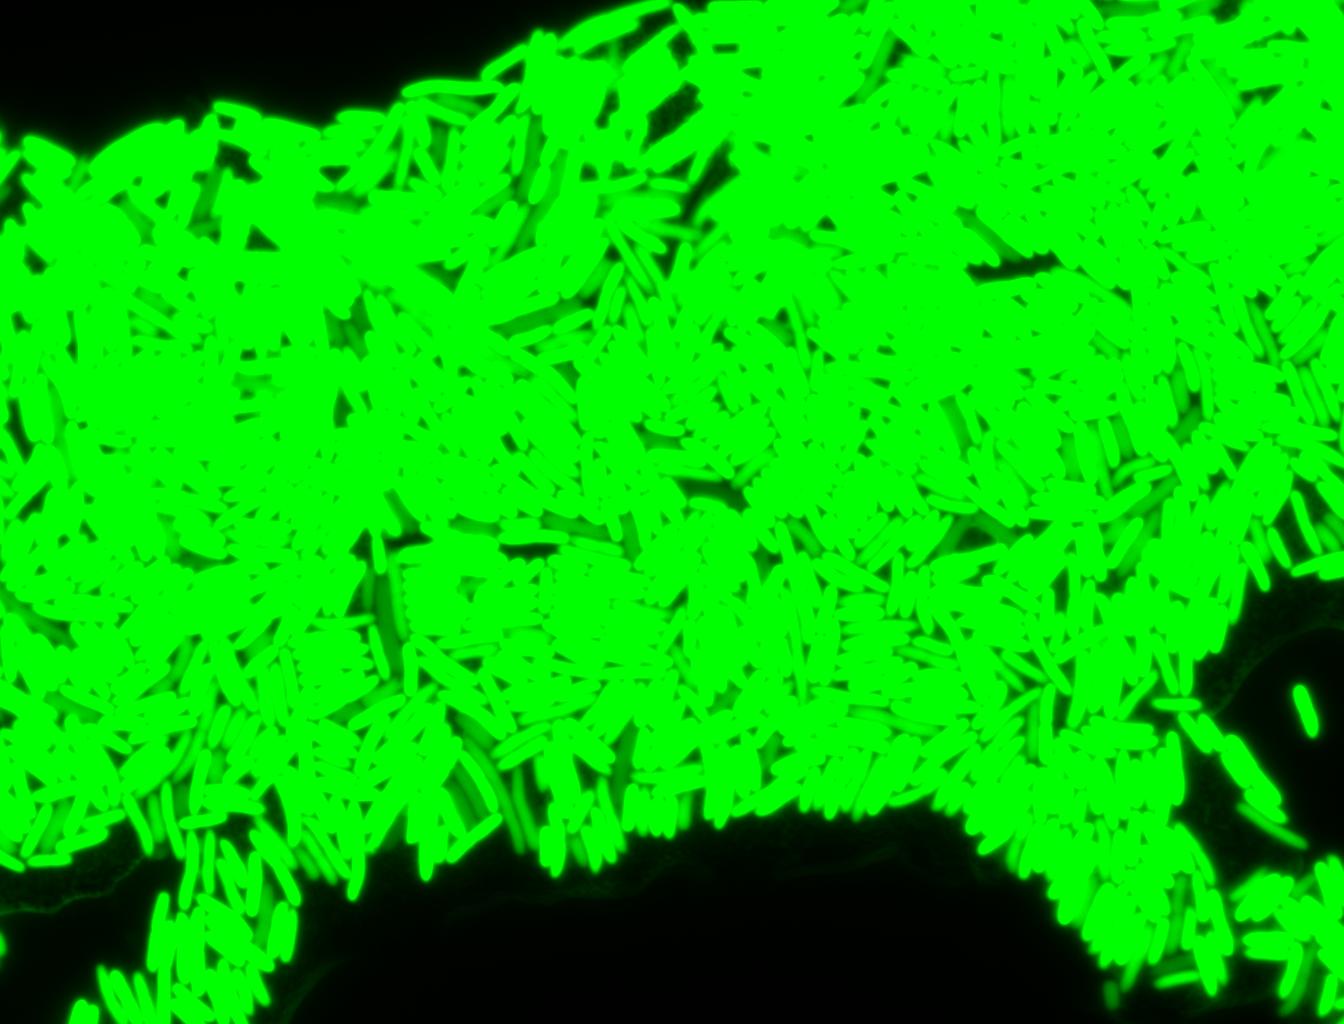
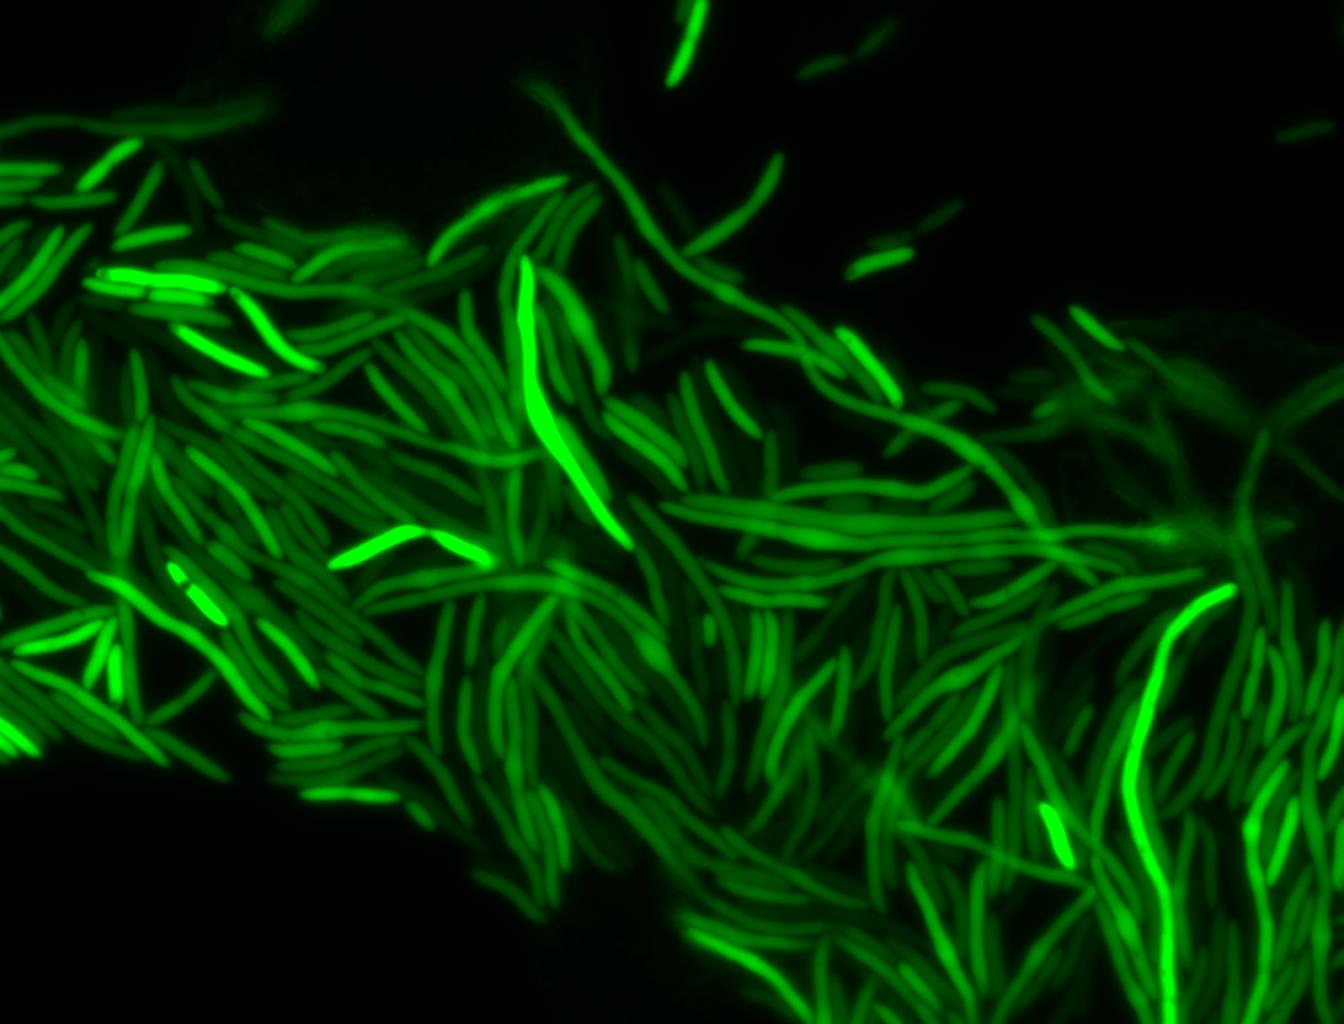
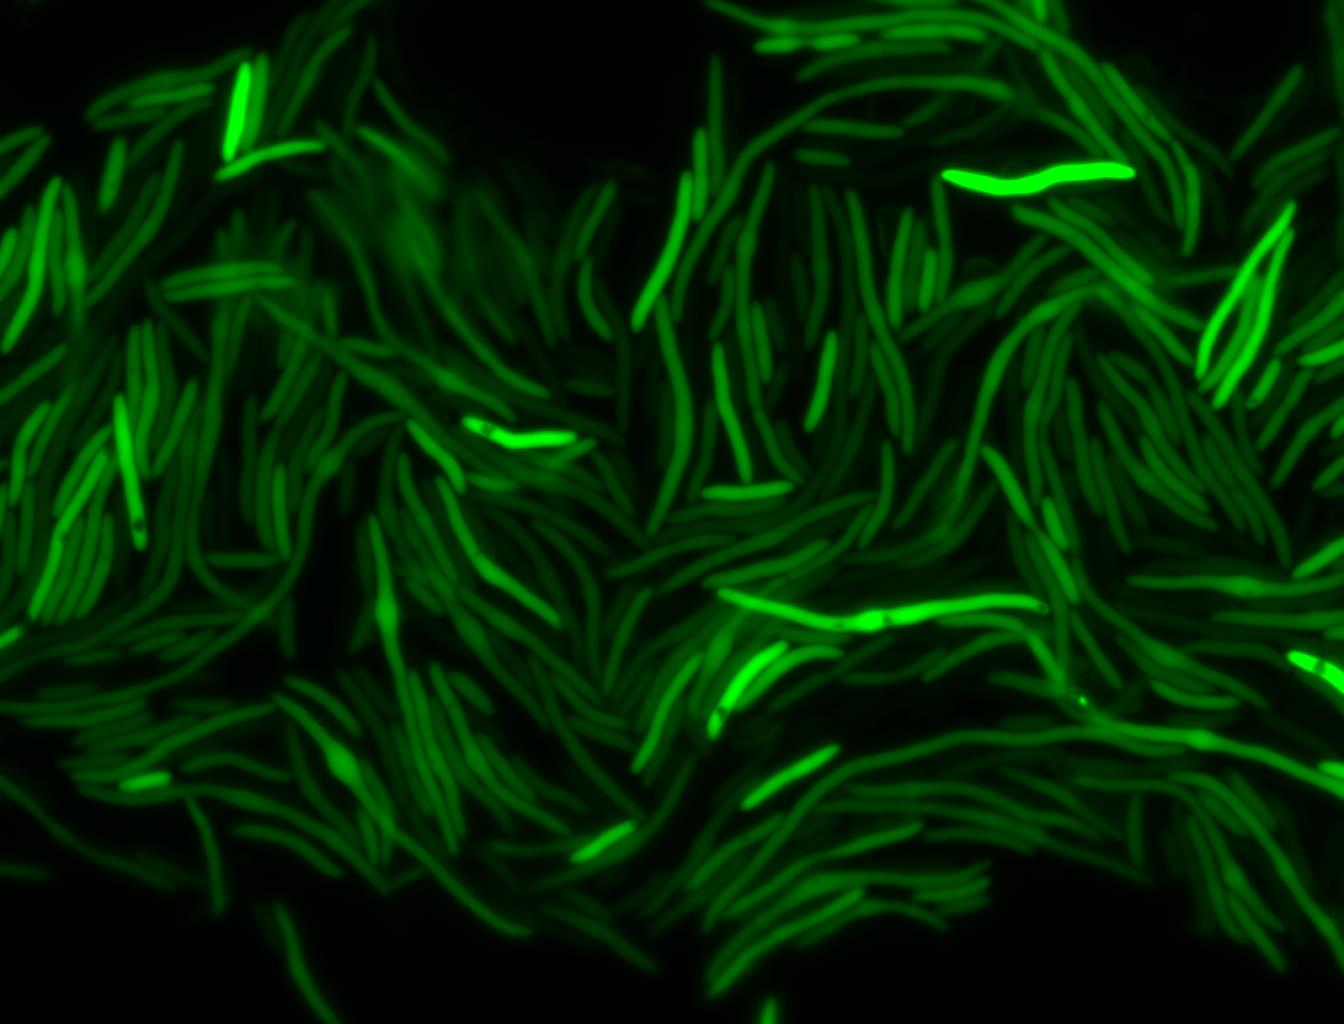
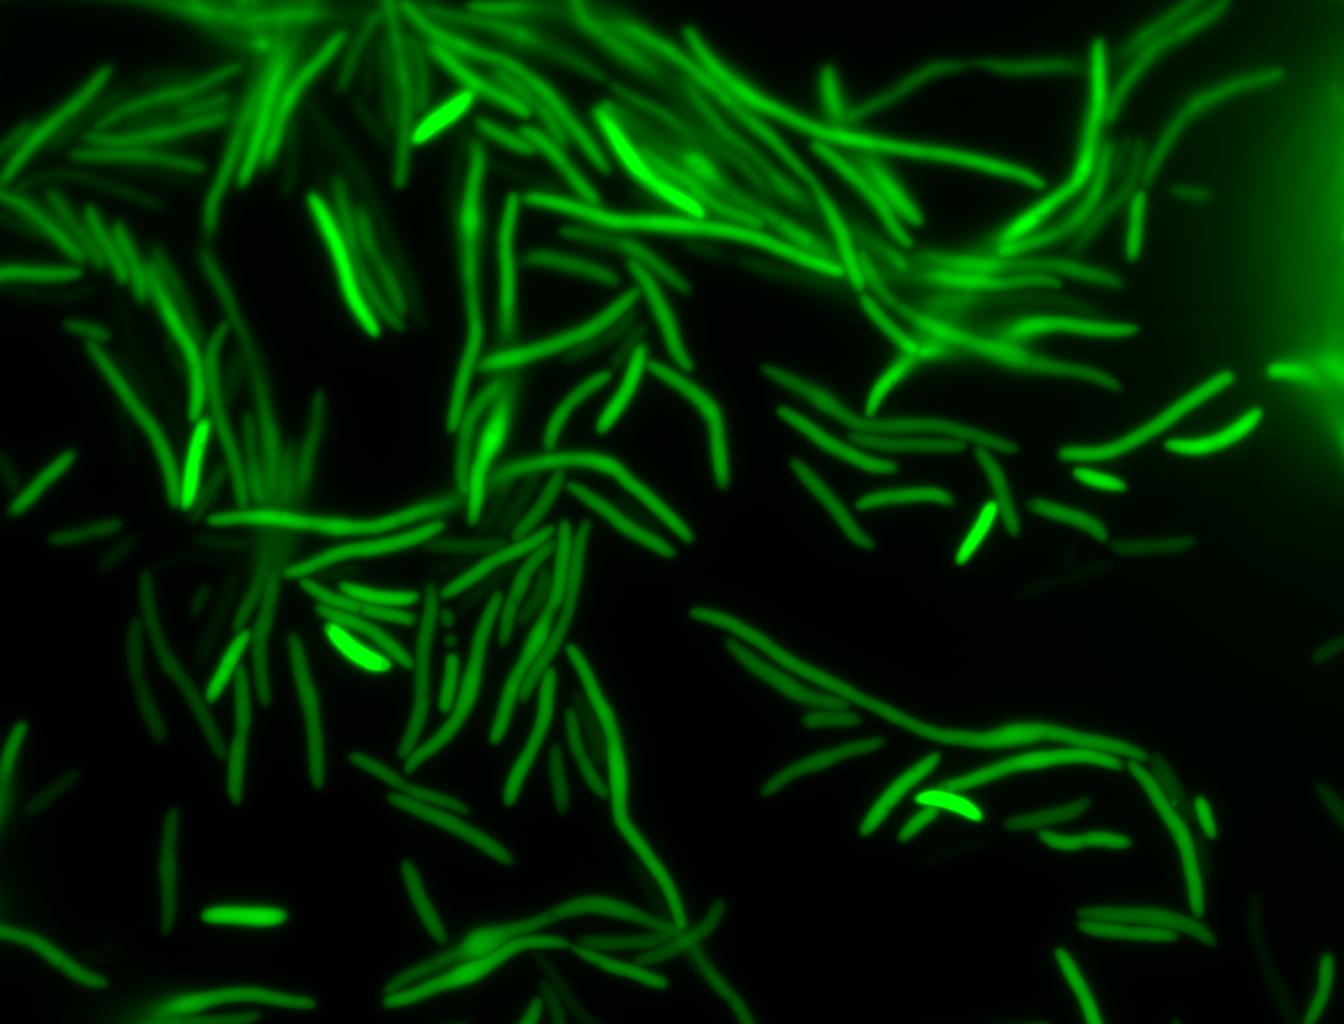
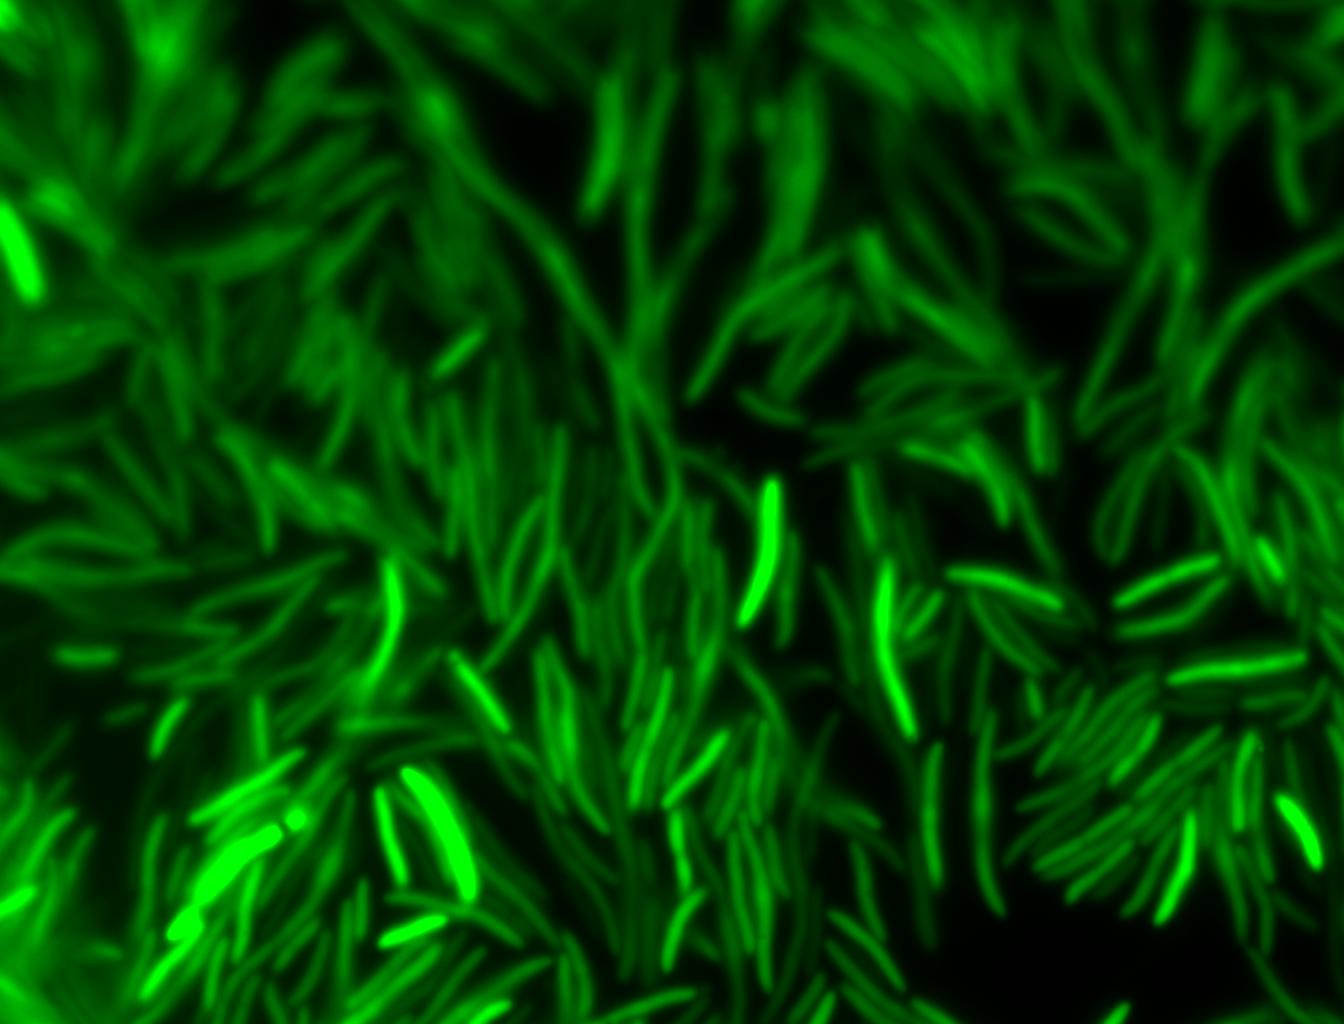
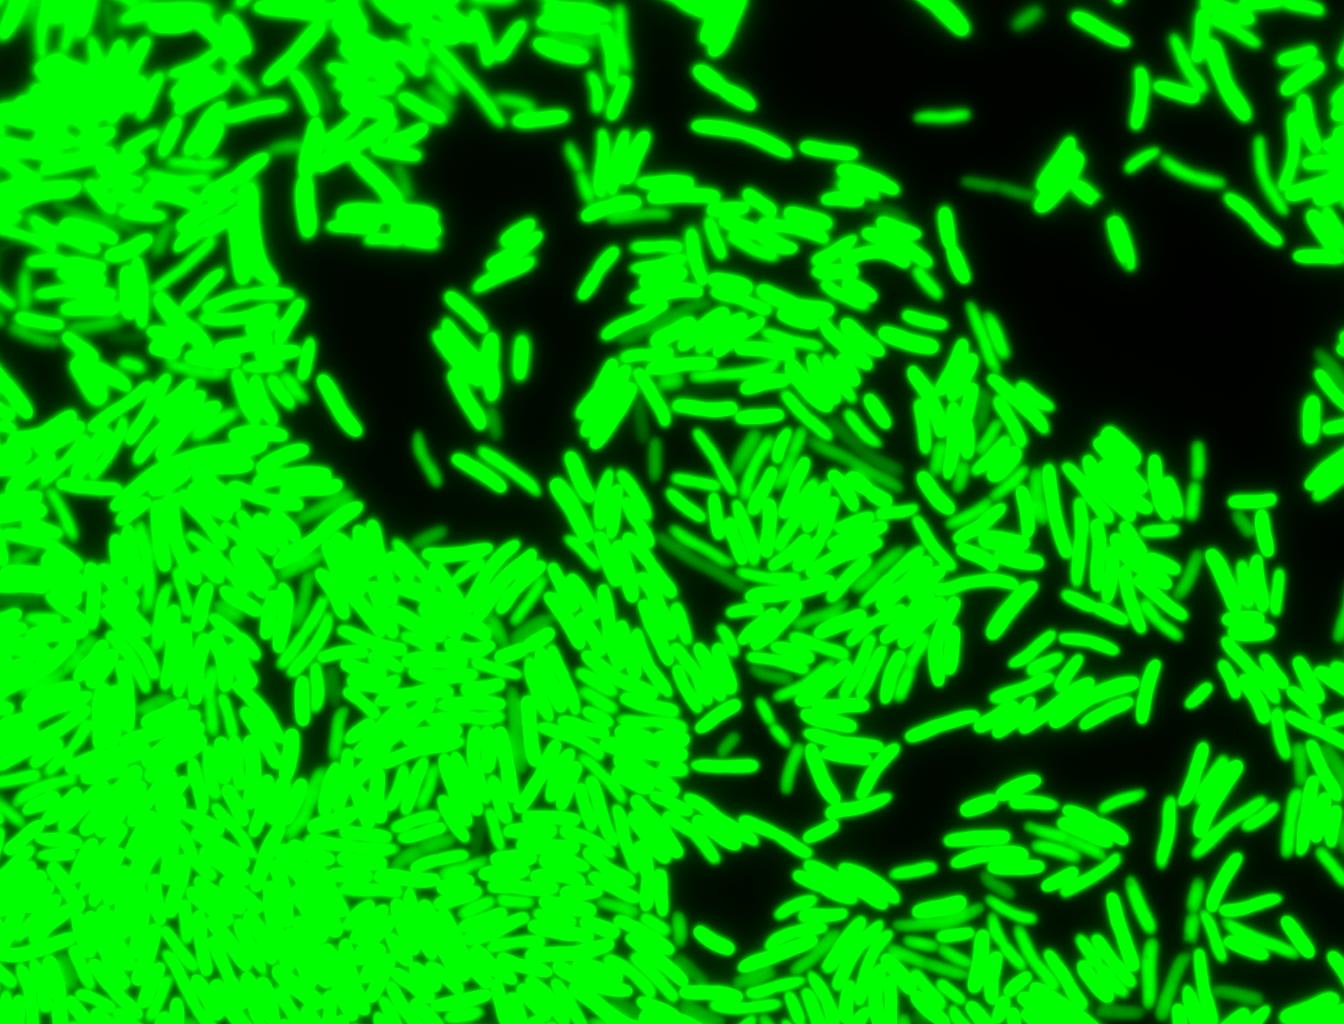
The measurements suggest that a heat shock period of 10 minutes significantly increases the production of GFP, while a heat shock period of 5 minutes leads to a similar GFP production level as the untreated cells. Furthermore, the production of GFP shows a decreasing trend after 3 hours suggesting that the heat shock promoter was only activated for a certain time period. DH5α cells contained in the images below-visualized by an optical microscope with a GFP-specific filter- were incubated at 42°C for 10 minutes.
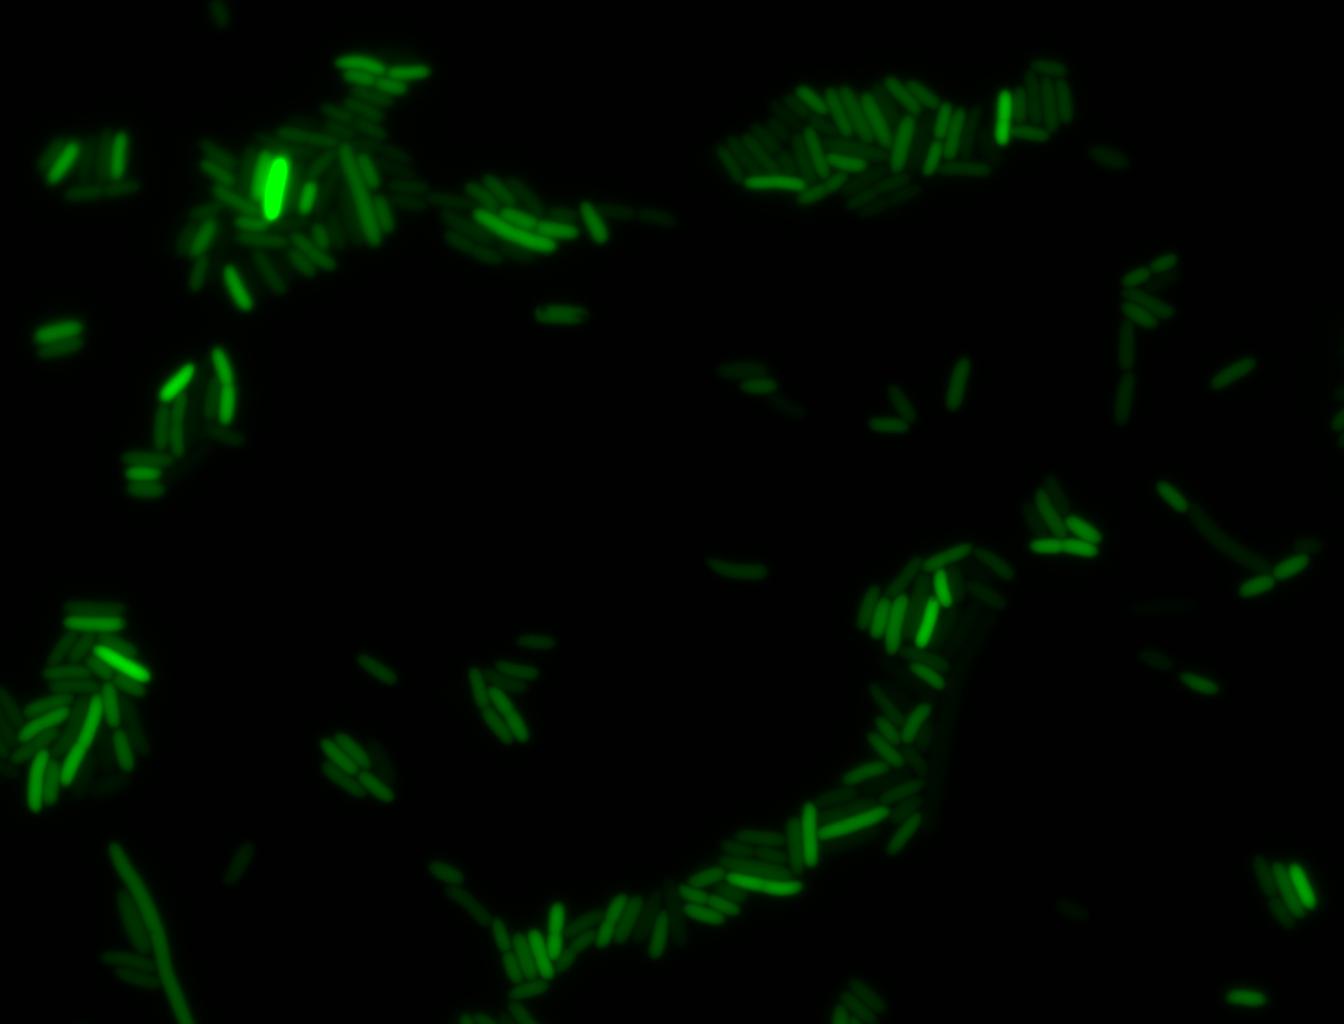
Images of Cells at t=0 min (Before Heat Shock)
Control: cells containing only GFP at t=0
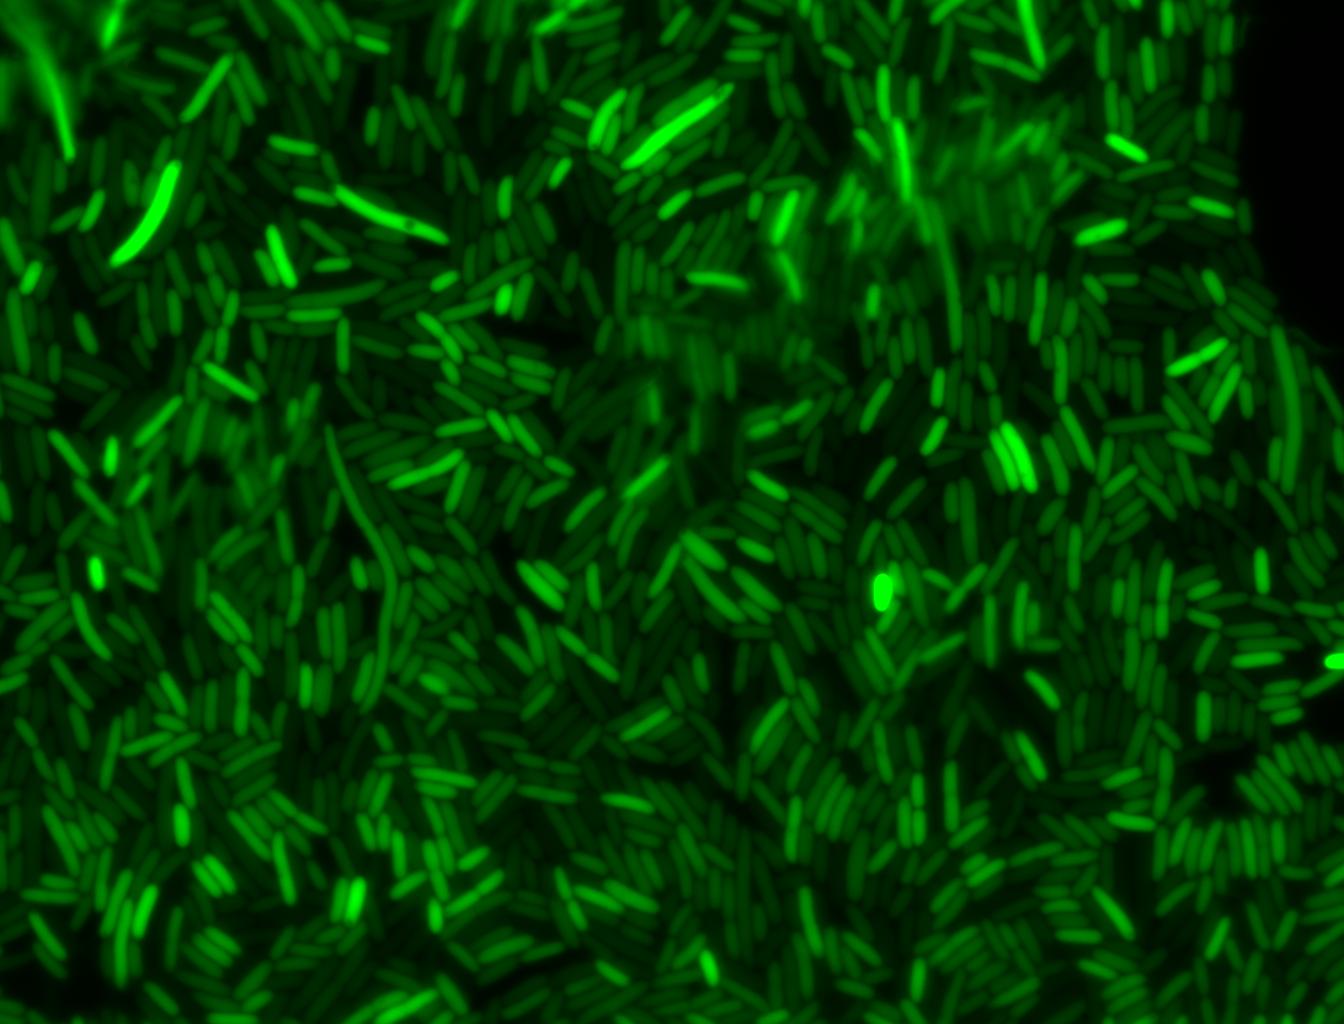
Images of Cells at t=10 min
Control: cells containing only GFP at t=10
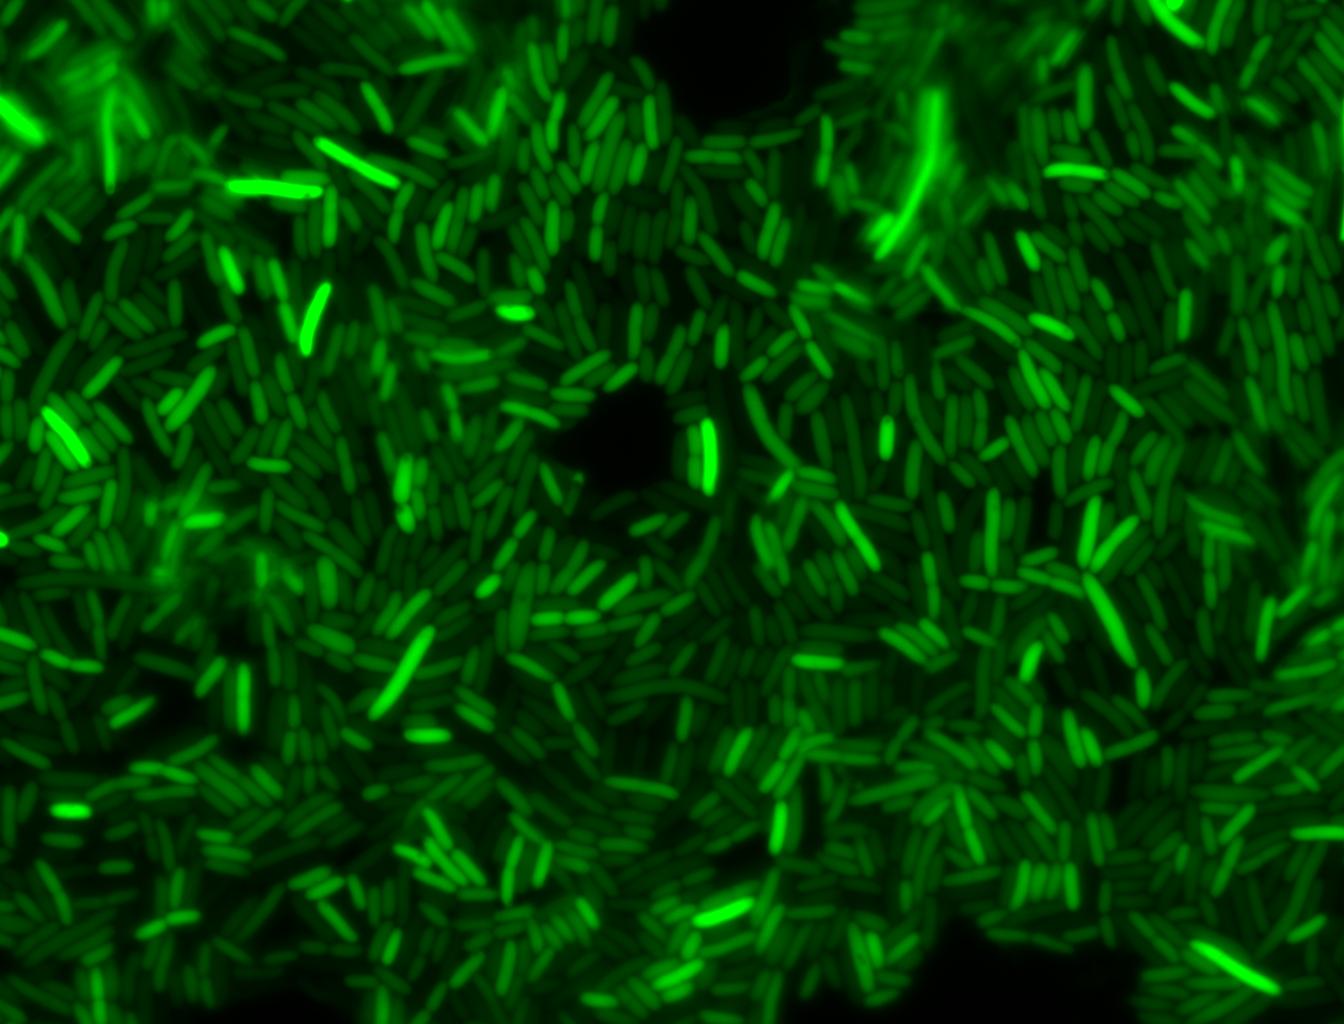
Images of Cells at t=60 min
Control: cells containing only GFP at t=60
Glucose
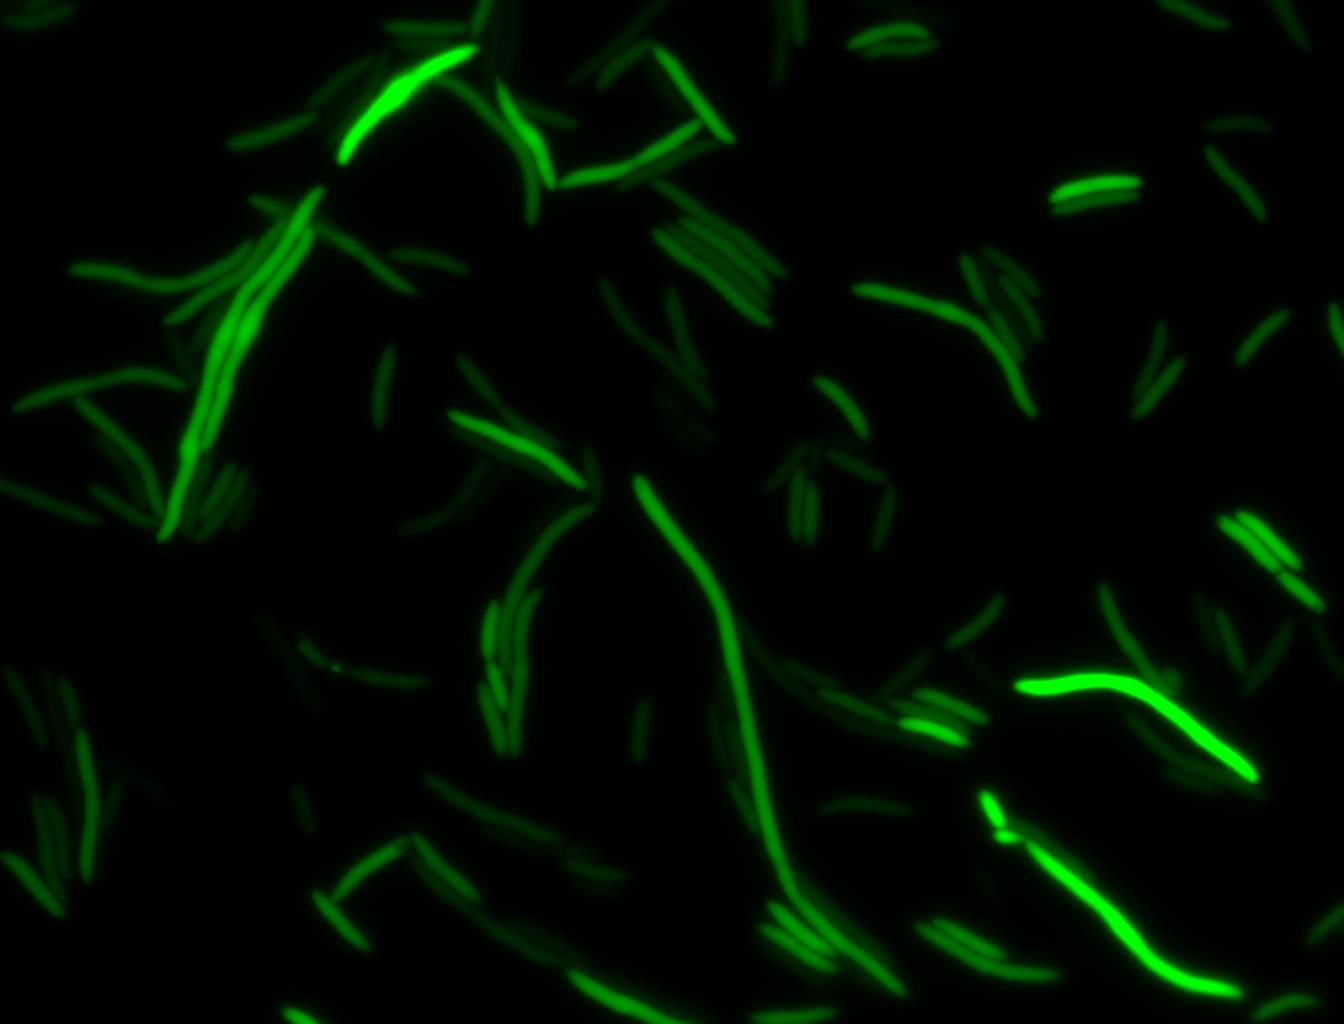
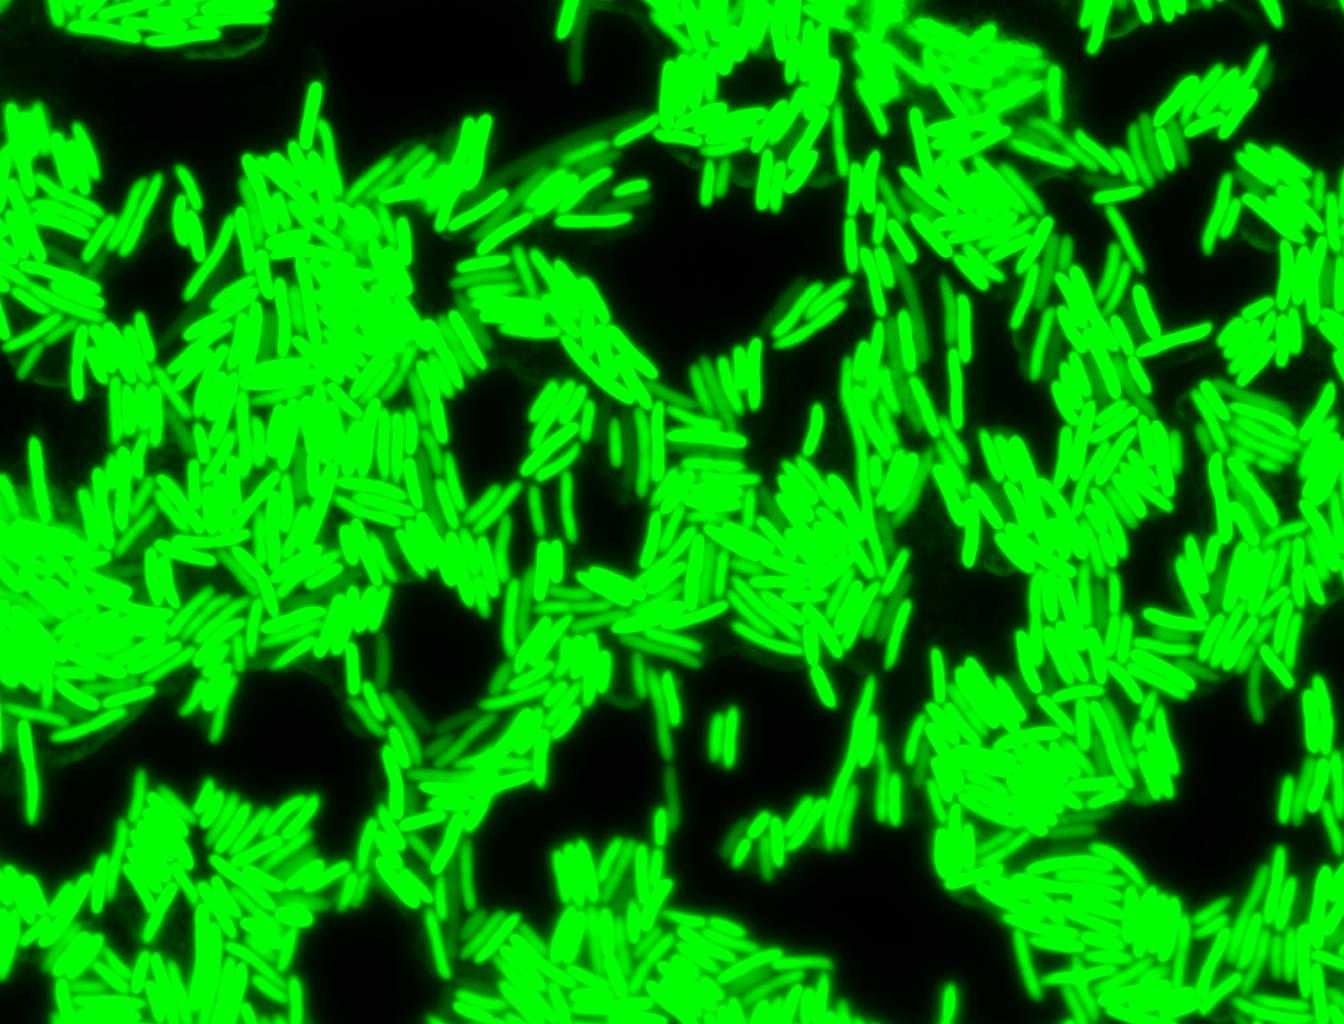
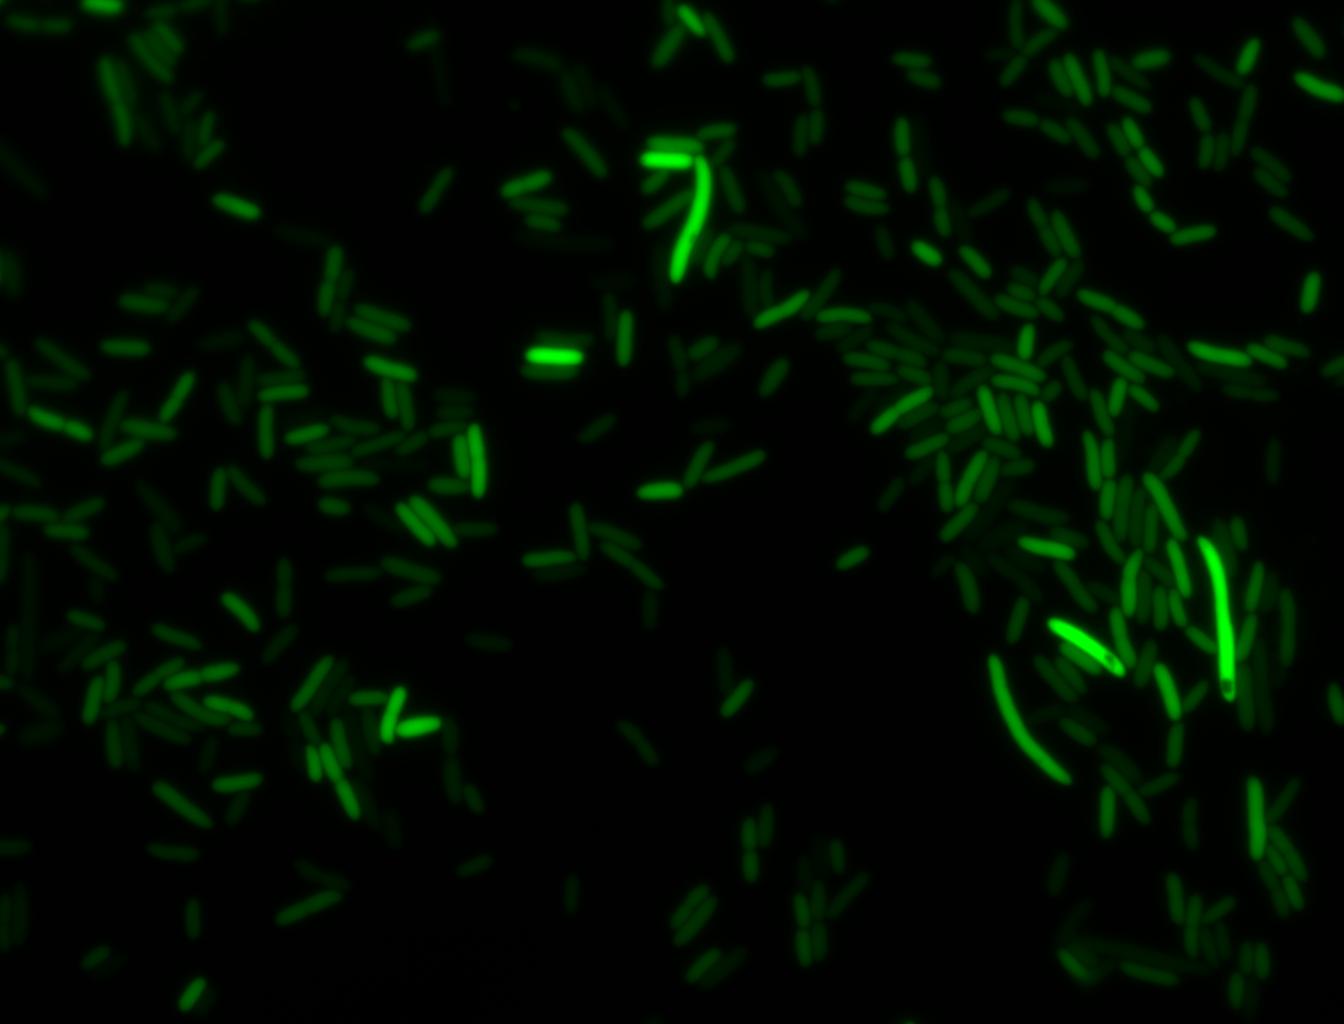
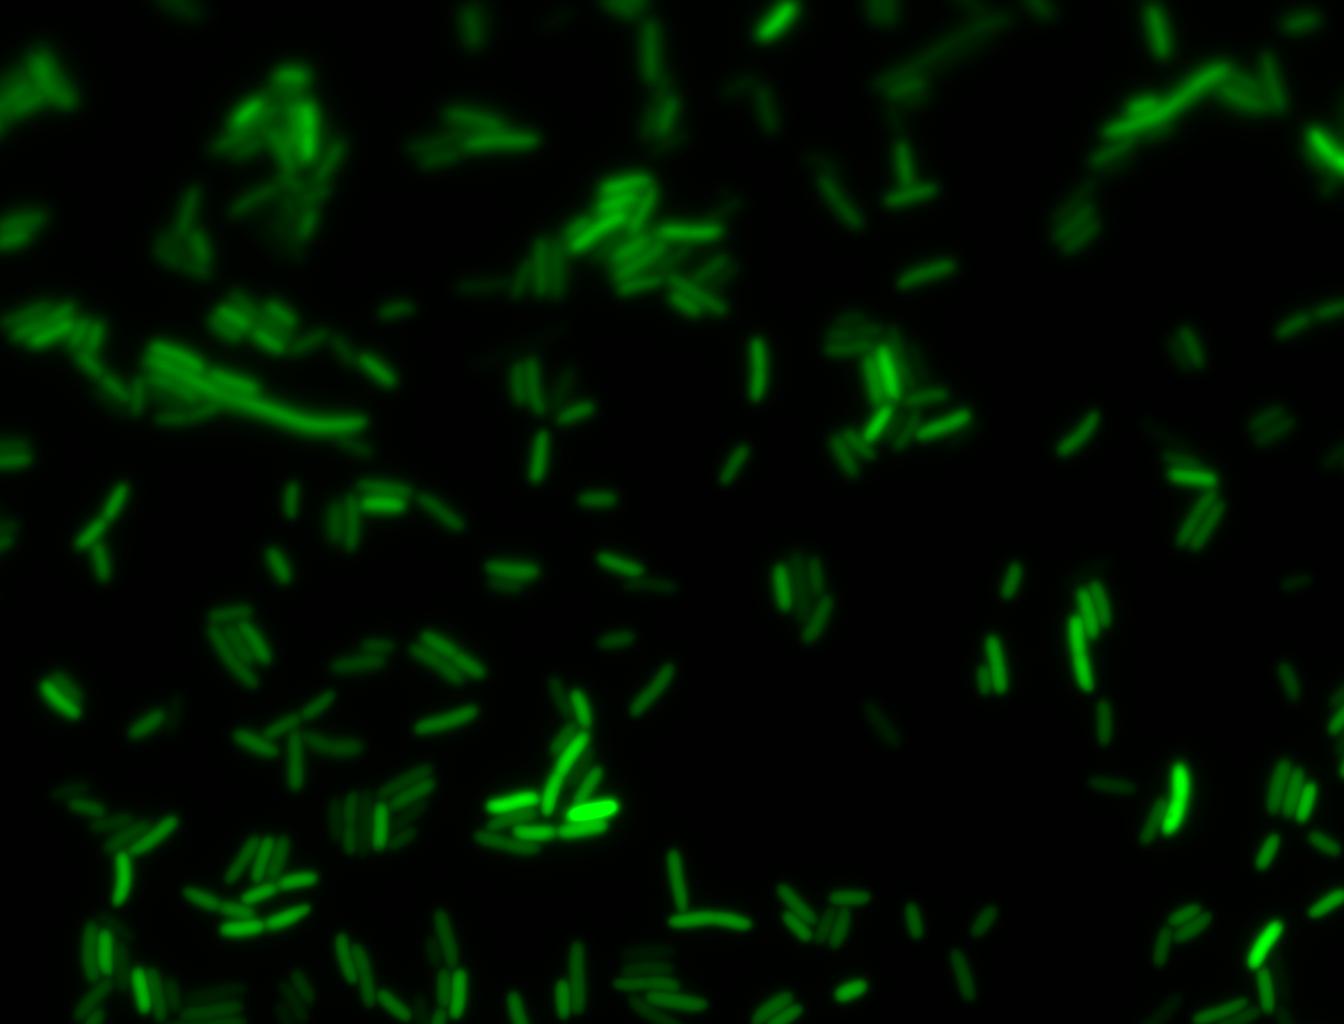
An interesting observation was made: when adding 20 mM of glucose to the media at the time of growth,the cells are no longer morbidly elongated at the time of imaging.
Images of Cells at t=0 min (Before Heat Shock)
Images of Cells at t=10 min
Images of Cells at t=60 min
NOTE: All images were captured at 100x magnification.
Contribution
Group: Valencia_UPV iGEM 2018
Author: Adrián Requena Gutiérrez, Carolina Ropero
Summary: We adapted the part to be able to assemble transcriptional units with the Golden Gate assembly method
Documentation:
In order to create our complete [http://2018.igem.org/Team:Valencia_UPV/Part_Collection part collection] of parts compatible with the Golden Gate assembly method, we made the part BBa_K2656001 which is this part adapted to the Golden Gate technology.
Sequence and Features
- 10COMPATIBLE WITH RFC[10]
- 12COMPATIBLE WITH RFC[12]
- 21COMPATIBLE WITH RFC[21]
- 23COMPATIBLE WITH RFC[23]
- 25COMPATIBLE WITH RFC[25]
- 1000COMPATIBLE WITH RFC[1000]
2020 XHD-ShanDong-China’s Characterization of BBa_ K338001
Aim of experiment
Based on BBa_K338001 part, a genetic circuit HSdegPLCP was constructed to characterize the function of HS promoter.
Methods
We construct the following gene circuit based on the principles of synthetic biology, as shown in Figure 1. The HS promoter was amplified from E. coli MG1655, the vector pdegPLCP was linearized by PCR, and then the pHSdegPLCP was obtained by homologous recombination, and the recombinant plasmid was verified by PCR to ensure the success of the recombinant.

Figure 1. Schematic diagram of expression circuit
The plasmid pHSdegPLCP containing K338001 part was transformed into E.coli DH5α strain, and the DH5α bacteria containing the recombinant plasmid pHSdegPLCP were cultured overnight in LB medium. Subsequently, the new LB medium was inoculated at a ratio of 1:100 and cultured at 37°C at 200 rpm for 2 hours (log phase). Subsequently, 6 tubes of 5mL LB medium were inoculated at a ratio of 1:100, 3 tubes were cultured at 37°C, and 3 tubes were cultured at 45°C. Take 200uL to 96-well plate every 0.5h, and measure the concentration of amilCP with a microplate reader. The concentration of amilCP (OD588) and OD600 value are measured simultaneously.
Results
We used the E.coli MG1655 as template and then performed PCR to obtain the heat shock(HS) promotor fragment. We use plasmid pdegPLCP as a template to obtain a linearized plasmid vector by PCR amplification. As shown in Fig 2, the size of the PCR product was as expected. Then use Gibson assembly to obtain the recombinant plasmid pHSdegPLCP. The PCR verification showed that the recombination was successful, as shown in Figure 3.

Figure2 Gel electrophoresis of HSP and linearized pdegP_CP PCR product

Figure3. Gel electrophoresis of PCR verification
The map of plasmid pHSdegPLCP obtained by the recombination is shown in Figure 4. It contains a chloramphenicol resistance gene, and HSP can activate the expression of degP and amilCP.

Figure4. plasmid map of pHSdegPLCP
The concentration of chromoprotein is obtained by dividing the A588 of the bacterial solution by A600. As shown in Figure 4, the chromoprotein amilCP shows different expression levels at different temperatures.

Figure5. amilCP production per cell mass unit

Figure6. Comparison of the color of bacterial liquid at different temperatures

Figure7 .Growth curve at different temperatures
Conclusion
From the results, we can clearly see that in a high temperature environment, HSP can quickly activate the expression of degP and chromin.

