Difference between revisions of "Part:BBa K322921:Experience"
(→SacB 3D structure: Crystal structure of Bacillus subtilis levansucrase) |
|||
| Line 192: | Line 192: | ||
In order to help characterize the structure of Bacillus subtilis levansucrase in Parts, SMS_Shenzhen uploaded the 3D structure of this enzyme behind: | In order to help characterize the structure of Bacillus subtilis levansucrase in Parts, SMS_Shenzhen uploaded the 3D structure of this enzyme behind: | ||
| − | [[ | + | [[File:SMSSACBFRONTJGP.jgp|600px|thumb|left|Front]] |
| + | |||
Revision as of 00:12, 1 November 2017
This experience page is provided so that any user may enter their experience using this part.
Please enter
how you used this part and how it worked out.
Applications of BBa_K322921
Characterisation of the activity of the sacB BioBrick:
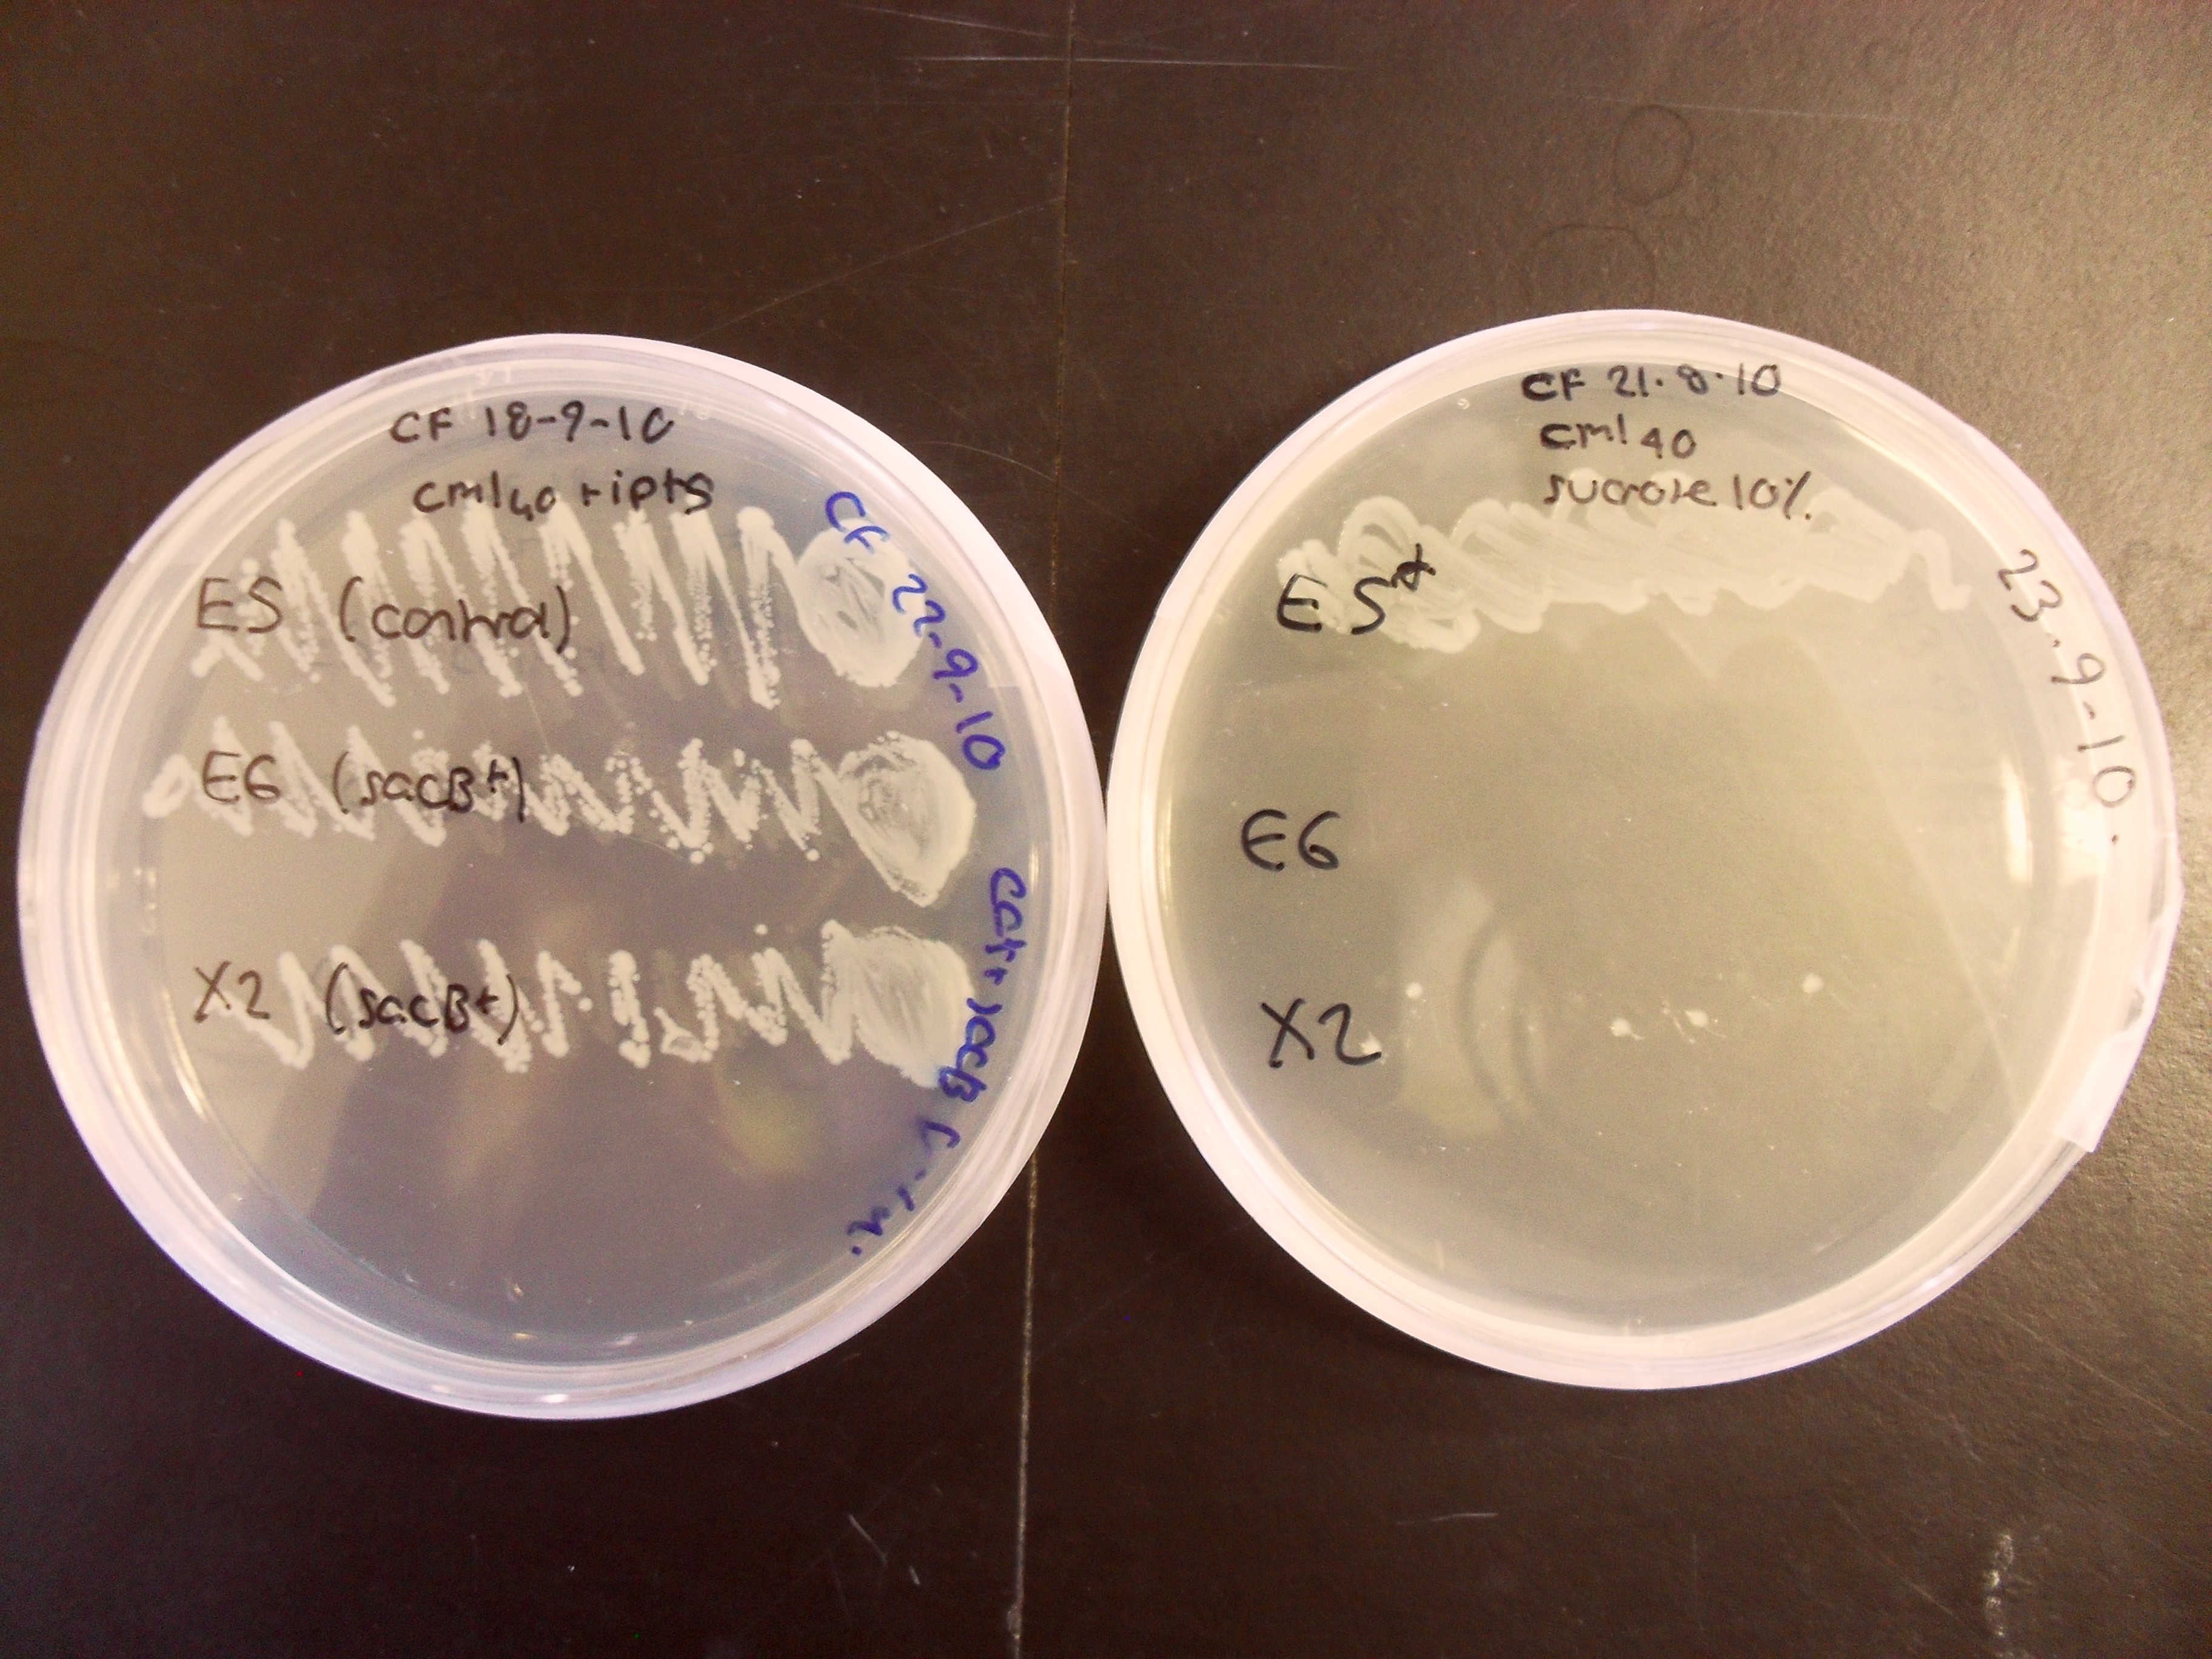
The control strain which does not contain sacB has grown well on both plates, whereas the sacB-containing strain X2 grows poorly on 10% sucrose and E6 does not grow at all. This experiment confirms that sacB is effective as a negative selection marker within the BRIDGE protocol.
Further characterisation and preparation of improved constructs for sacB BioBrick:
We, Edinburgh 2012 iGEM team, have improved the functionality of this part in the following way:
We prepared a plac-RFP-SacB construct which can be used for assessing counter-selection efficiency. Part:BBa_K917002
We placed sacB under the lac promoter which allows IPTG dependent control rather than kanamycin dependent control and IPTG concentration-dependent control of the levels of selection.
We added RFP to allow distinguishing loss of the counter-selection cassette form loss of SacB fuction.
We prepared Kan-plac-RFP-sacB selection-counterselection cassette Part:BBa_K917010
Improving use of sacB for negative selection in liquid culture
The 2011 Wisconsin-Madison team utilized and tested this part as part of their double selection cassette. It was used to perform directed evolution upon different liquid phase fluorescent E. coli biosensors. In light of their findings, they have suggested improvements to the protocol for use of this part.
For the 2011 Wisconsin-Madison team's project, they required the selection to be done in liquid culture, as opposed to the solid agar plate use shown in the BRIDGE protocol by the 2010 Edinburgh team above. This allowed for testing of a large mutant library that would have been impractical to screen on plates. Additionally, they were testing E. coli biosensors designed to work with liquid analytes which were impossible to use in a solid agar plate (ethanol and alkanes).
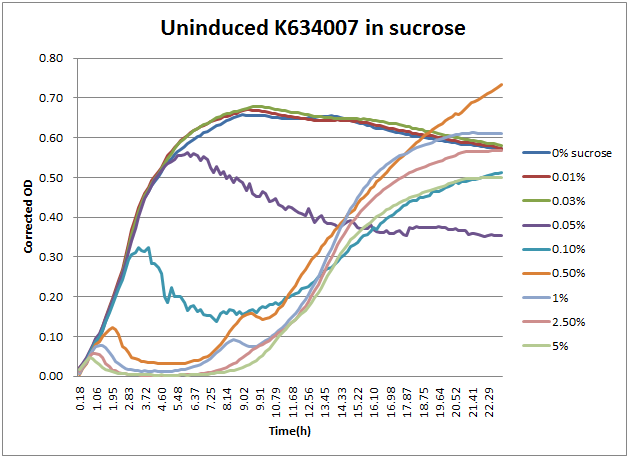
As can be seen above, the expression of sacB in the presence of sucrose prevents most growth on a solid plate, albeit with some survivors. In a liquid culture condition, this occasional sucrose-insensitivity presents a greater problem than sporadic colonies on a plate. When sacB-expressing cells were grown overnight in >1% v/v sucrose-containing media, the culture was always turbid in the morning. This was at first thought to reveal that sacB was not being expressed, but a time course plate reader study revealed that was not the case.
From this, the 2011 Wisconsin-Madison team proposes a new method for using K322921 for counter selections of mutant populations in liquid culture. When screening mutants that should have an effect on the expression of the sacB-containing operon, the following protocol should yield the largest possible number of mutants with reduced leaky expression. Based on the above data regarding growth in sucrose, it appears that a 5 hour liquid-culture growth would result in nearly complete death of sucrose-sensitive cells, without significant presence of sucrose-insensitive mutants. At this five hour point, the culture can either have the plasmid DNA extracted or be pelleted and plated to be screened.
The 2011 Wisconsin-Madison team hopes that this improved protocol for use of this part in liquid cultures will improve future teams' experience with this unique part. This holds great promise for high throughput screening of mutant libraries using BioBrick parts, and increases the viability of directed mutagenesis to improve existing devices.
Characterization and measurement of SacB promoter
We, SMS_Shenzhen team (2017) characterized the promoter's strength and ability of the SacB promoter in this part BBa K322921.
The sacB gene usually extracted from Bacillus subtilis encodes the secreted enzyme levansucrase (sucrose: 2,6-b-D-fructan 6-b-D-fructosyltransferase). The enzyme catalyzes hydrolysis of sucrose and synthesis of levans, which are high-molecular-weight fructose polymers. In E. coli, levansucrase activity is mostly located in the periplasm. The molecular basis of the toxicity is still unclear, but the toxicity could be due to an accumulation of levans which might encumber the periplasm because of their high molecular weight or a transfer of fructose residues to inappropriate acceptor molecules, which could thereafter have toxic effects on the bacterial cells. In our project, we make use of the sacB gene to kill the rest of E.coli which didn’t play an effective role in coccid on leaves and scattered into the surroundings.
The sacB gene has been used in iGEM, but we didn’t find much description to sacB promoter. Therefore, the efficiency of the promoter of sacB gene, which is a constitutive promoter, is uncleared. This experiment tests the efficiency of the promoter of sacB gene. We designed a plasmid with the promoter of sacB, ribosome binding side J61100, GFP and terminator B0015 on the backbone pSB1c3.
Figure 1 sacB promoter(534bp)+RBS(BBa_J61100)+green fluorescence protein +double terminator(BBa_B0015)+backbone(pSB1c3)
Figure 2 Sequence of sacB promoter
Standard Vector construction
We sent the plasmid to genscript company and had it man-made synthesized. To make a measurement next, we also get a standard promoter BBa_J23100 into the identical plasmid backbone.
Figure 3 The standard promoter BBa_J23100 into the identical plasmid backbone
sacB promoter measurement
Abstract
In order to measure the strength of sacB promoter, standard measurement approaches for characterizing the sacB promoter were used so that it will be easier to be re-used by future teams.
We choose BBa_J23100(figure 4) from the Relative Promoter Units (RPUs) as the comparison to the sacB promoter.Three groups were set including an expertimental group(transformed with the sample),a positive control group(transformed with the standard J23100) and a blank controller.In each there were also two parallel tests. After linking up the standard promoter BBa_J23100 into the identical plasmid backbone,we attained the OD600 to estimated the concentration of bacteria suspension with our Linear function of detecting concentration of bacteria suspension in experiment 1. With the data of OD600,we controlled the bacteria in logarithmic phase.Then we made a measurement of the fluorescene of each groups.Using the fluorescein fluorescence standard curve made by A1~12 in 96well plates and three groups of fluorescein intensity data,fluorescenece concentration was computed and histogram of two promoters was made to figure out the intensity difference from fluorescenece concentration.
Method summary and experimental data
Measurement of OD600
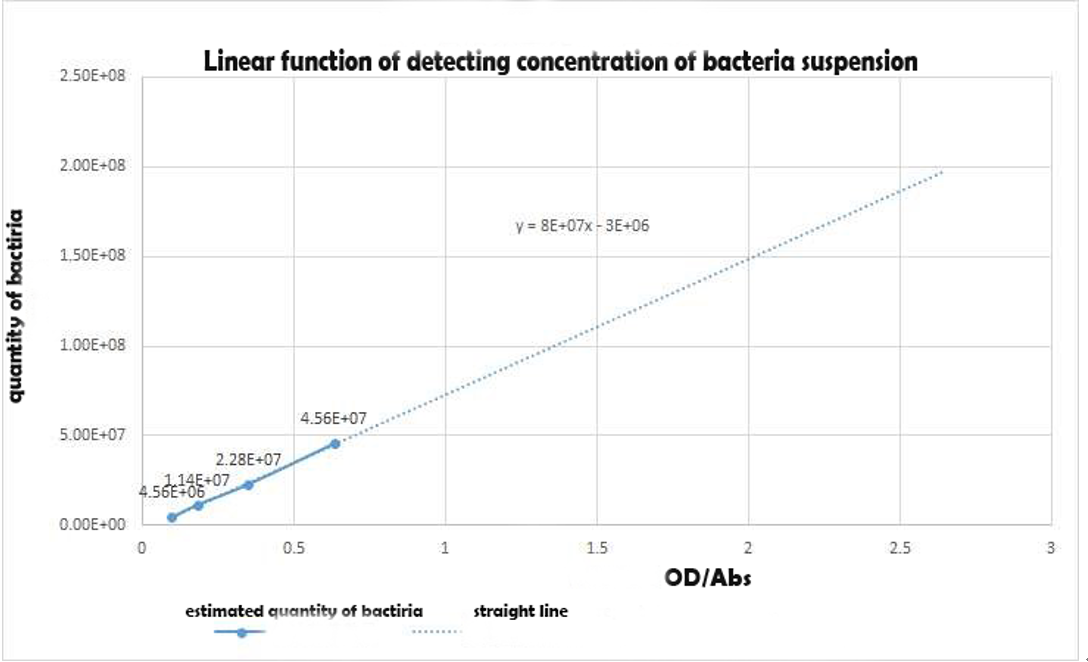
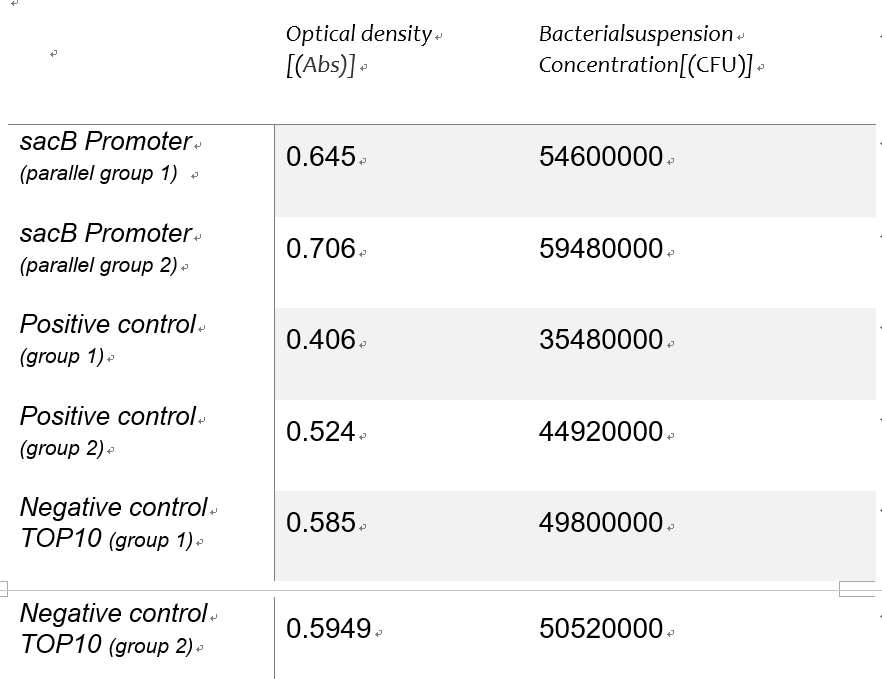
Using the spectrophotometer to get the estimated value of optical density of the 3groups,we made a conversion to the concentration of the bacterial suspension as an alternative independent variable of the expression intensity with the Linear function of detecting concentration of bacteria suspension in experiment 1Y(Figure 5).Table 1 shows the Bacterial suspension Concentration[(CFU)/g] converted from the optical density[Abs].
Figure 4 Linear function of detecting concentration of bacteria suspension in experiment 1
Table 1: roiginal data
Fluorescent measurement
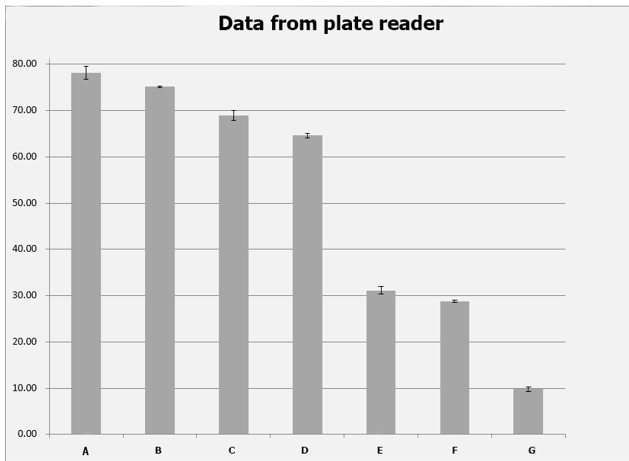
Controlling the bacteria in logarithmic phase, we prepared the set-up of the ELISA and calibration of fluorescence with each of the triplicates of the 6 constructs, which was measured by its fluorescence. We also designed a set of precise concentration gradient to map the fluorescein fluorescence standard curve, after which the fitting function curve was attained from data in A1~12. For triplicates in each parallel group, its reading from ELISA was recorded and the geometric mean of fluorescence [ABS]was calculated to reach error reduction. Table 2 shows the original data from plate reader while table 3 shows the geometric mean of the fluorescence averaged from
Figure 5 Original data from plate reader
Figure 6 geometric mean of fluorescent absorbancy [ABS]
Conclusion and Discussion
Considering the linear relation was uncertain, It is hardly to guarantee the correspondence of the GFP expressive quantity and the promoter intensity as what is widely believed. If time allowed, we would make a vertification of the linear relation about the GFP expressive quantity and the promoter intensity in person. Even though the measurement steps were not totally standard as the Interlab, the promoter intensity of sacB met the expectations as its fluorescence concentration surpasses the BBa_J23100 approximately. Hereto, the expression of the sacB promoter in our engineering E. coli has reach an experimental verification.
SacB 3D structure: Crystal structure of Bacillus subtilis levansucrase
In order to help characterize the structure of Bacillus subtilis levansucrase in Parts, SMS_Shenzhen uploaded the 3D structure of this enzyme behind:
User Reviews
UNIQa5b14da8200b047e-partinfo-00000000-QINU UNIQa5b14da8200b047e-partinfo-00000001-QINU

