Difference between revisions of "Part:BBa K1420001"
(→Summary) |
(→Characterization of merA) |
||
| Line 39: | Line 39: | ||
<p></p> | <p></p> | ||
== Characterization of ''merA'' == | == Characterization of ''merA'' == | ||
| − | To test the effect of MerA to mercury resistance, we generated a ''merA'' deletion construct from pBBRBB::mer and characterized it by zone of inhibition test. | + | To test the effect of MerA to mercury resistance, we generated a ''merA'' deletion construct from pBBRBB::mer and characterized it by zone of inhibition test. Mercury resistance of the following three constructs were compared. |
| + | |||
<p></p> | <p></p> | ||
<b>Zone of Inhibition Results</b> | <b>Zone of Inhibition Results</b> | ||
[[File:2MerA ZOI K12.jpg|950px|center|alt text]] | [[File:2MerA ZOI K12.jpg|950px|center|alt text]] | ||
| − | '''Figure 2.''' Zones of Inhibition Test For Mercury Resistance Activity. In this assay, ''Escherichia coli'' K12 strain | + | '''Figure 2.''' Zones of Inhibition Test For Mercury Resistance Activity. In this assay, ''Escherichia coli'' K12 strain expressing three different constructs were spread on agar plate to compare level of mercury resistance. Each agar plate had a filter disk spotted with 10µL of 0.1M HgCl2 in the middle. (A) Agar Plates of K12 with each construct. Left, K12 conntaining pBBRBB::mer (''mer'' operon); center,K12 containing pBBRBB::gfp (empty vector); right, K12 containing pBBRBB::merΔ''merA''(''mer'' operon with ''merA'' deletion mutant). (B) Size of zones of inhibition diameter. The diameter of the Zone of Inhibition was measured in triplicate. Green corresponds to pBBRBB::gfp, blue to pBBRBB::mer, and red to pBBRBB::merΔ''merA''. Zone of inhibition of individual construct arranges from highest inhibition to lowest inhibition is: merΔ''merA'' > empty vector > mer. |
In the E. coli K12 with the empty vector had higher zone of inhibition than the E. coli with ''mer'' operon. In addition, vector with MerA deleted has a highest zone of inhibition among three samples, which would be expected as the bacteria would be unable to reduce Hg(II) and remove it while MerPT actively transport Hg(II) into the cell, leading to a toxic bioaccumulation that inhibits bacterial growth. | In the E. coli K12 with the empty vector had higher zone of inhibition than the E. coli with ''mer'' operon. In addition, vector with MerA deleted has a highest zone of inhibition among three samples, which would be expected as the bacteria would be unable to reduce Hg(II) and remove it while MerPT actively transport Hg(II) into the cell, leading to a toxic bioaccumulation that inhibits bacterial growth. | ||
Revision as of 03:40, 13 October 2014
merA, mercuric reductase from Serratia marcescens
Summary
• MerA, a ~120kDa homodimeric mercuric ion reductase, is encoded by merA gene in mer operon.
• MerA reduces Hg(II) to Hg(0) as a mean of detoxification.
• MerA and MerB (organomercury lyase) are essential to inorganic and organic mercury detoxification.
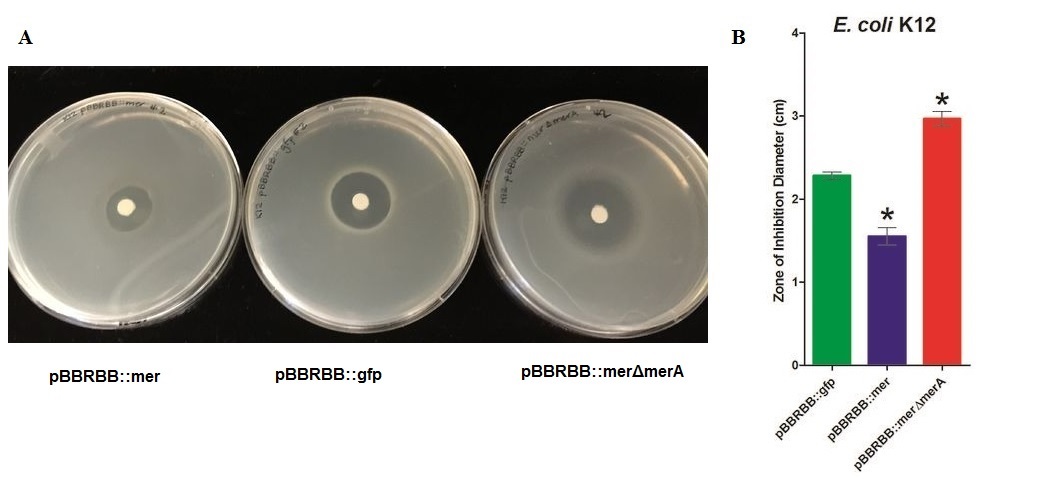
• Zone of inhibition assay showed the growth E. coli with mer operon with merA deletion is more inhibited than the growth E. coli with mer operon, illustrating importance of MerA in mercury resistance.
Overview
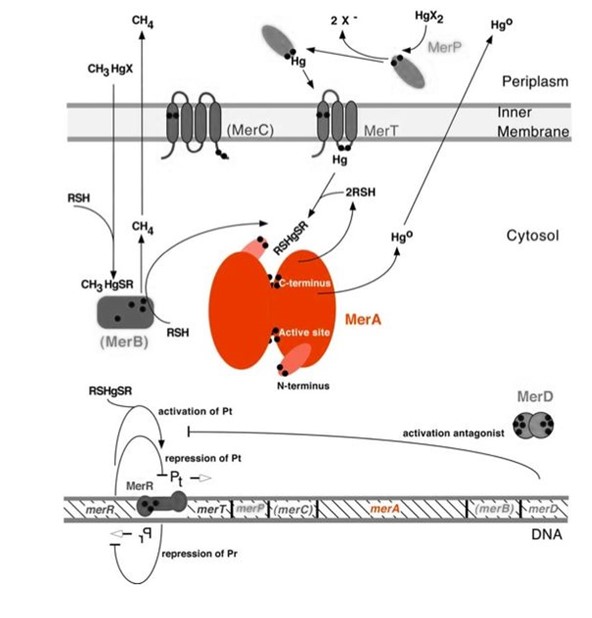
Mercury resistance gene merA (1686 bp) encodes MerA, a mercuric ion reductase (cytosolic, flavin disulfide oxidoreductase, ~120kDa), that is essential to bacterial mercury resistance. MerA and gene merA are highlighted in orange in Figure 1. The lower part of the Figure 1 shows the arrangement of mer genes in the operon, and merA is located downstream of merT and merP, the genes that encode mercury transport proteins. As shown in Scheme 1, the essential mechanism of mercury resistance is carried out by MerB and MerA. MerB transforms methylmercury to less toxic, non-biomagnified ionic mercury Hg(II), and MerA reduces Hg(II) to the least toxic metallic mercury, Hg(0).
Figure 1. Model of mercury resistance operon. The symbol • indicates a cysteine residue. RSH indicates cytosolic thiol redox buffers such as glutathione. Figure 1 shows the interactions of MerA with mercury compounds and other gene products of mer operon. (This figure is adapted from "Bacterial mercury resistance from atoms to ecosystems". Reference: T. Barkay et al. FEMS Microbiology Reviews 27 (2003) 355-384.)
The nature evolves different mercury detoxification strategies. Here we describe MerA and MerB confer mercury resistance by coupling electrochemical reductions of thiol-avid organic mercury species to relatively inert, uncharged, monoatonic mercury. Since organic mercuric species have high affinity to tiol groups and commomly form strong but reversible bonds,cytosolic thiol redox buffers and cysteine residues of mercury binding proteins compete with thiol groups in other protein and therefore prevents cationic mercury from inhibiting cytosolic machineries. Once the organomercury is converted to ionic mercury by MerB, MerA reduces ionic mercury to volatile, elemental mercury which diffuses through cell membrane without any active transport systems. While MerA and MerB are the key mercury detoxification enzymes, they orchestrate with mercury transport proteins, MerT and MerP, to confer bacterial mercury resistance.
Molecular Function
MerA catalyzes the reduction of mercuric ion to the relative inert, volatile monoatomic mercury in a NADPH dependent reaction. Ionic mercury Hg(II) is released from protonlysis of organomercury catalyzed by MerB.
Scheme 1. MerA Catalyzed Reaction
Structure and Mechanism
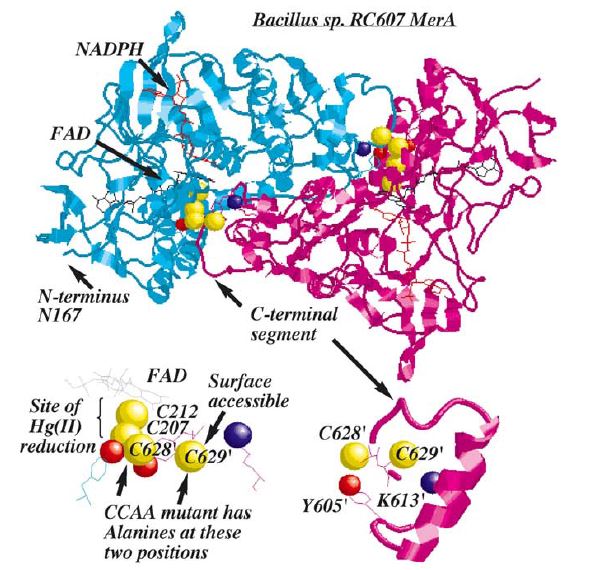
MerA is a 125kDA homodimer.
Characterization of merA
To test the effect of MerA to mercury resistance, we generated a merA deletion construct from pBBRBB::mer and characterized it by zone of inhibition test. Mercury resistance of the following three constructs were compared.
Zone of Inhibition Results
Figure 2. Zones of Inhibition Test For Mercury Resistance Activity. In this assay, Escherichia coli K12 strain expressing three different constructs were spread on agar plate to compare level of mercury resistance. Each agar plate had a filter disk spotted with 10µL of 0.1M HgCl2 in the middle. (A) Agar Plates of K12 with each construct. Left, K12 conntaining pBBRBB::mer (mer operon); center,K12 containing pBBRBB::gfp (empty vector); right, K12 containing pBBRBB::merΔmerA(mer operon with merA deletion mutant). (B) Size of zones of inhibition diameter. The diameter of the Zone of Inhibition was measured in triplicate. Green corresponds to pBBRBB::gfp, blue to pBBRBB::mer, and red to pBBRBB::merΔmerA. Zone of inhibition of individual construct arranges from highest inhibition to lowest inhibition is: merΔmerA > empty vector > mer.
In the E. coli K12 with the empty vector had higher zone of inhibition than the E. coli with mer operon. In addition, vector with MerA deleted has a highest zone of inhibition among three samples, which would be expected as the bacteria would be unable to reduce Hg(II) and remove it while MerPT actively transport Hg(II) into the cell, leading to a toxic bioaccumulation that inhibits bacterial growth.
Sequence and Features
- 10COMPATIBLE WITH RFC[10]
- 12COMPATIBLE WITH RFC[12]
- 21COMPATIBLE WITH RFC[21]
- 23COMPATIBLE WITH RFC[23]
- 25INCOMPATIBLE WITH RFC[25]Illegal NgoMIV site found at 1201
Illegal NgoMIV site found at 1249
Illegal NgoMIV site found at 1311
Illegal NgoMIV site found at 1522 - 1000COMPATIBLE WITH RFC[1000]


