Difference between revisions of "Part:BBa K141001"
| (4 intermediate revisions by the same user not shown) | |||
| Line 64: | Line 64: | ||
<partinfo>BBa_K141001 parameters</partinfo> | <partinfo>BBa_K141001 parameters</partinfo> | ||
<!-- --> | <!-- --> | ||
| − | |||
| − | |||
| − | |||
| − | |||
| − | |||
| − | |||
| − | |||
| − | |||
| − | |||
| − | |||
| − | |||
| − | |||
| − | |||
| − | |||
| − | |||
| − | |||
| − | |||
| − | |||
Latest revision as of 02:42, 12 October 2023
Ucp-
We used Ucp- like a negative control in our experimental design.
Ucp- has the same sequence than Ucp1 but is assembled in the opposite direction in our device.
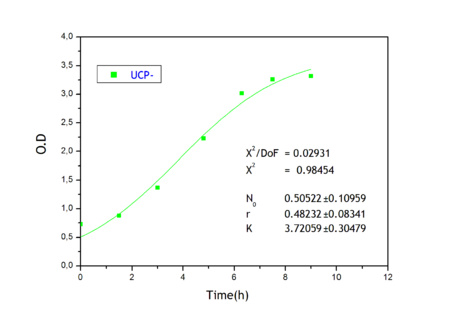
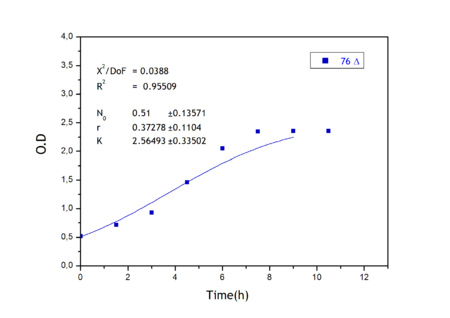
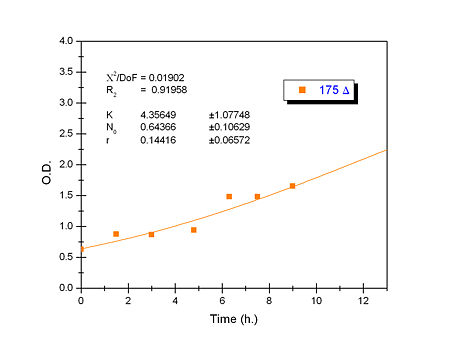
Apart from monitoring temperature evolution, we also characterized O.D. variations of each of our strains. We took O.D. measures every one a half hours for nine hours. We carried out this experiment both in Erlenmeyer flasks in the 30ºC shaking stove and in our LCCs.
This measurements were useful in order to determine some parameters for our Black Box Model. Besides, we were able to prove that the UCP was indeed being produced even though we could not see the temperature increase. Since our mutant strains Gly175Δ and Gly76Δ do not have the same growing rate as UCP+ when they are expressing the protein, the difference between the results in the strains showed that the reason for our lack of temperature increase was that we had not found the optimum conditions yet. This results made us keep on working until we obtained successful results.
Strains growth equations:
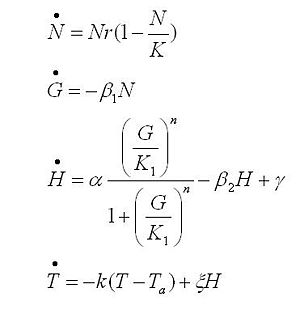
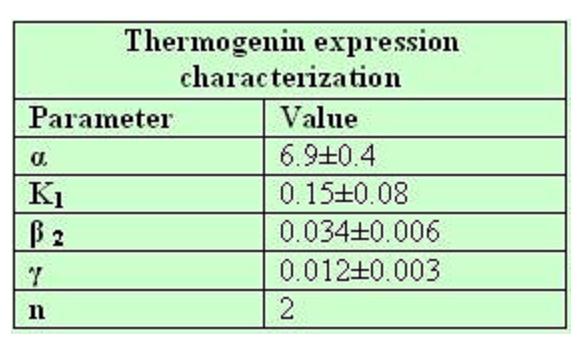
The black box model simulates the temperature evolution of the system as a function of the growth rate, galactose concentration and thermogenin expresion. We assume that our system can be reproduced by the following system of equations:
where:
- first equation: Growth of the culture: logistic growth of the different mutants used in our experiments.
- second equation: Galactose evolution: Galactose is the metabolite which induces the thermogenin expresion.
- third equation: Thermogenin concentration level.
- Fourth equation: Temperature evolution. the first term of the equation represents the losses to the ambient of the calorimeter and the second one the temperature increase as a consequence of the thermogenin expresion.
From a sample of 10 experiments in which the evolution of the temperature of the four strain was measured we perform a fit using the software simulink.
Common parameters values
Own parameters of Ucp 76 deleted activity
Sequence and Features
- 10INCOMPATIBLE WITH RFC[10]Illegal XbaI site found at 573
Illegal XbaI site found at 873
Illegal PstI site found at 289 - 12INCOMPATIBLE WITH RFC[12]Illegal PstI site found at 289
- 21COMPATIBLE WITH RFC[21]
- 23INCOMPATIBLE WITH RFC[23]Illegal XbaI site found at 573
Illegal XbaI site found at 873
Illegal PstI site found at 289 - 25INCOMPATIBLE WITH RFC[25]Illegal XbaI site found at 573
Illegal XbaI site found at 873
Illegal PstI site found at 289
Illegal AgeI site found at 726 - 1000INCOMPATIBLE WITH RFC[1000]Illegal BsaI.rc site found at 674

