Difference between revisions of "Part:BBa K4170016"
(→Recombinant SUMO-LbuCas13a expression) |
(→CRIPSR/LbuCas13a based-target miR-17-3P detection in complex matrices) |
||
| (12 intermediate revisions by the same user not shown) | |||
| Line 120: | Line 120: | ||
==Recombinant SUMO-LbuCas13a expression== | ==Recombinant SUMO-LbuCas13a expression== | ||
| + | |||
| + | ===General protein expression workflow=== | ||
| + | This protocol was followed for all the protein expression experiments with minor modifications at the IPTG concentration, induction temperature or time of induction . | ||
| + | The procedure of the protein expression initiates with the preparation of the bacterial pre-culture (15ml) incubated overnight at 37 °C. The following day the pre-culture was diluted in 1L of nutrient media, followed by a further incubation at 37°C of the diluted pre-culture until Optical Density (OD600) reached 0.7 – 0.8 (continuous measurements at the photometer at specific time points). To induce LbuCas13a protein expression we added IPTG to the 1L bacterial culture to achieve a final concentration of 1mM (variable). The bacterial culture was then incubated for 6 hours (variable) at 37°C (variable). After overnight incubation, the bacterial culture was centrifuged at 10.000 g for 20 min at 4 °C and the supernatant was discarded. The bacterial pellets were resuspended in binding buffer (3oomM NaCl, 50mM NaH2PO4, 10mM imidazole, pH 8) followed by successive freeze-thaw cycles. After the freeze-thaw steps, Lysozyme (100mg/ml) and Triton x-100 were added and ultrasonication was performed to lyse the bacterial membrane. After ultrasonication, DNase (1mg/ml), MgCl2 (8mM) and Protease Inhibitor (PI) were added and the samples were incubated in a cold room for 2 hours on a rotator machine. To obtain the soluble fraction of the protein, refrigerated centrifugation was carried out and the supernatant was then filtered by using 0.22 μm filter units. The remaining pellet constitutes the Inclusion Bodies (IBs), which also contains the insoluble form of the protein of interest. To isolate the SUMO-LbuCas13a protein from the IBs, the bacterial pellet is subjected to successive washing steps using 3 different buffers (A, B, C) followed by ultracentrifugation at 30.000g for 20 min at 4 C. The process is completed by resuspending the protein in L-Arginine solution which promotes the proper folding of the protein restoring its functional quaternary structure. | ||
| Line 138: | Line 142: | ||
After the first inefficient attempt to produce high quantities of the LbuCas13a in the soluble fraction, we decided that the best route would be an overnight induction at 25oC with a 1mM concentration of IPTG. Since the four-hour protocol didn’t work a protein production timeline was constructed with a duration of 6 hour.Specifically, a sample from the bacterial culture was removed every hour and further processed to obtain the soluble and insoluble fraction. Then, the samples were analyzed using gel 8% SDS-PAGE electrophoresis followed by western blot analysis. | After the first inefficient attempt to produce high quantities of the LbuCas13a in the soluble fraction, we decided that the best route would be an overnight induction at 25oC with a 1mM concentration of IPTG. Since the four-hour protocol didn’t work a protein production timeline was constructed with a duration of 6 hour.Specifically, a sample from the bacterial culture was removed every hour and further processed to obtain the soluble and insoluble fraction. Then, the samples were analyzed using gel 8% SDS-PAGE electrophoresis followed by western blot analysis. | ||
| − | [[File:Figure 13 BBa K4170016.png|600px|thumb|center|'''Figure 10'''. 8% SDS PAGE electrophoresis of the SUMO-LbuCas13a protein. A timeline with 6 hours duration is presented at 25oC. The final IPTG concentration was 1mM. SUMO-LbuCas13a size is 155kDa. '''Lane1''': 1st hour of induction. '''Lane 2''': 2nd hour of induction. '''Lane3''': 3rd hour of induction. '''Lane 4''': 4th hour of induction. '''Lane 5''': 5th hour of induction. '''Lane 6''': Protein marker (Nippon genetics blue Star). '''Lane 7''': 6th hour of induction, soluble part of SUMO-LbuCas13a protein. '''Lane 8''': 6th hour of | + | [[File:Figure 13 BBa K4170016.png|600px|thumb|center|'''Figure 10'''. 8% SDS PAGE electrophoresis of the SUMO-LbuCas13a protein. A timeline with 6 hours duration is presented at 25oC. The final IPTG concentration was 1mM. SUMO-LbuCas13a size is 155kDa. '''Lane1''': Insoluble fraction-1st hour of induction. '''Lane 2''':Insoluble fraction-2nd hour of induction. '''Lane3''': Insoluble fraction-3rd hour of induction. '''Lane 4''': Insoluble fraction-4th hour of induction. '''Lane 5''': Insoluble fraction-5th hour of induction. '''Lane 6''': Protein marker (Nippon genetics blue Star). '''Lane 7''': 6th hour of induction, soluble part of SUMO-LbuCas13a protein. '''Lane 8''': Insoluble fraction-6th hour of induction. Lane 9: Uninduced.]] |
| − | [[File:Figure 14 BBa K4170016.png|600px|thumb|center|'''Figure 11'''. Western Blotting of the SUMO-LbuCas13a protein with anti-His primary antibody and anti-mouse alkaline Phosphatase-Labeled secondary antibody. A timeline with 6 hours duration is presented at 25oC. The final IPTG concentration was 1mM. SUMO-LbuCas13a size is 155kDa. Lane 1: 1st hour of induction. Lane 2: 2nd hour of induction. Lane3: 3rd hour of induction. Lane 4: 4th hour of induction. Lane 5: 5th hour of induction. Lane 6: Protein marker (Nippon genetics blue Star). Lane 7: 6th hour of induction soluble part of SUMO-LbuCas13a. Lane 8: 6th hour of induction | + | [[File:Figure 14 BBa K4170016.png|600px|thumb|center|'''Figure 11'''. Western Blotting of the SUMO-LbuCas13a protein with anti-His primary antibody and anti-mouse alkaline Phosphatase-Labeled secondary antibody. A timeline with 6 hours duration is presented at 25oC. The final IPTG concentration was 1mM. SUMO-LbuCas13a size is 155kDa. Lane 1: Insoluble fraction-1st hour of induction. Lane 2:Insoluble fraction-2nd hour of induction. Lane3:Insoluble fraction-3rd hour of induction. Lane 4:Insoluble fraction-4th hour of induction. Lane 5:Insoluble fraction-5th hour of induction. Lane 6: Protein marker (Nippon genetics blue Star). Lane 7: 6th hour of induction soluble part of SUMO-LbuCas13a. Lane 8:Insoluble fraction-6th hour of induction. Lane 9: Uninduced]] |
At the end of the six-hour time point the expression of the soluble SUMO-LbuCas13a was observed. At the same time the quantity of the insoluble SUMO-LbuCas13a has been increased also. | At the end of the six-hour time point the expression of the soluble SUMO-LbuCas13a was observed. At the same time the quantity of the insoluble SUMO-LbuCas13a has been increased also. | ||
| Line 146: | Line 150: | ||
<h3>LbuCas13a protein expression procedure with overnight induction, at 25oC using different concentrations of IPTG</h3> | <h3>LbuCas13a protein expression procedure with overnight induction, at 25oC using different concentrations of IPTG</h3> | ||
| − | After the conformation of the expression conditions, different concentrations of IPTG were tested, in order to: a) determine the most efficient concentration that produces a satisfactory quantity of soluble SUMO-LbuCas13a; b) investigate and understand which concentration offers the best soluble/insoluble ratio. Taking into account the above five different concentrations of IPTG were used: 1mM, 0.2mM, 0.4mM, 0.6mM and 0.8Mm following the same protocol | + | After the conformation of the expression conditions, different concentrations of IPTG were tested, in order to: a) determine the most efficient concentration that produces a satisfactory quantity of soluble SUMO-LbuCas13a; b) investigate and understand which concentration offers the best soluble/insoluble ratio. Taking into account the above five different concentrations of IPTG were used: 1mM, 0.2mM, 0.4mM, 0.6mM and 0.8Mm following the same protocol (1L bacterial cultures induced overnight at 25oC). The final products were analyzed using SDS-page electrophoresis and western blotting methods. The results rendered IPTG concentration among the most important factors for LbuCas13a protein expression. The higher the concentration of IPTG was, the higher the amount of the protein expressed, as depicted in Figures 12,13a,b. It is also observed that the induction procedure with 1mM IPTG offered the best results. |
| − | [[File:Figure 15 BBa K4170016.png|600px|thumb|center|'''Figure 12'''.SUMO-Cas13a | + | [[File:Figure 15 BBa K4170016.png|600px|thumb|center|'''Figure 12'''.SUMO-Cas13a in 8% SDS PAGE gel electrophoresis, at 25oC with overnight induction and different final concentrations of IPTG. The Soluble fraction of SUMO-LbuCas13a protein is depicted. SUMO-LbuCas13a size is 155kDa. Lane1: Protein marker (Nippon genetics blue Star). Lane 2: SUMO-LbuCas13a soluble 1mM IPTG. Lane3: SUMO-LbuCas13a soluble 0.2mM IPTG. Lane 4: SUMO-LbuCas13a soluble 0.4mM IPTG. Lane5: SUMO-Cas13a soluble 0.6 mM IPTG. Lane 6: SUMO-LbuCas13a soluble 0.8mM IPTG. Lane 7: Uninduced.]] |
| − | [[File:Figure 16 BBa K4170016.png|600px|thumb|center|'''Figure 13a'''. | + | [[File:Figure 16 BBa K4170016.png|600px|thumb|center|'''Figure 13a'''. 8% SDS Page gel electrophoresis of SUMO-LbuCas13a protein with overnight induction at 25oC and different final IPTG concentrations. The Soluble fraction of SUMO-LbuCas13a protein is depicted. SUMO-LbCas13a size is 155kDa. Beginning from the left side: Lane1 Protein marker (Nippon genetics blue Star). Lane 2: SUMO-LbuCas13a soluble 1mM IPTG. Lane 3: SUMO-LbuCas13 soluble 0,2mM IPTG. Lane 4: SUMO-LbuCas13a soluble 0,4mM IPTG. Lane 5: SUMO-LbuCas13a soluble 0,6 mM IPTG. Lane 6: SUMO-LbuCas13a soluble 0,8mM IPTG.]] |
| Line 157: | Line 161: | ||
==Recombinant LbuCas13a purification and SUMO cleavage== | ==Recombinant LbuCas13a purification and SUMO cleavage== | ||
| − | The last step for the LbuCas13a production constitutes the purification and digestion of SUMO-LbuCas13a, using the cytiva His trap Ni-NTA column kit and the SUMO protease ULP1, respectively. Both protocols were applied on soluble and insoluble SUMO-LbuCas13a as well. The results were analyzed through SDS-page and western blotting methods. The purification and the cleavage of the SUMO tag were performed successfully on soluble and | + | The last step for the LbuCas13a production constitutes the purification and digestion of SUMO-LbuCas13a, using the cytiva His trap Ni-NTA column kit and the SUMO protease ULP1, respectively. Both protocols were applied on soluble and insoluble SUMO-LbuCas13a as well. The results were analyzed through SDS-page and western blotting methods. The purification and the cleavage of the SUMO tag were performed successfully on the protein derived from both the soluble and insoluble (inclusion bodies) fraction. |
| + | |||
| + | [[File:Figure 17 BBa K4170016.png|600px|thumb|center|'''Figure 14'''SUMO-LbuCas13a in 8% SDS PAGE gel electrophoresis, at 25oC from overnight induction with 1mM final concentrations of IPTG. SUMO-LbuCas13a size is 155kDa. LbuCas13a size is 138kDa. Lane 1: Uninduced. Lane 2: SUMO-LbuCas13a soluble. Lane 3: SUMO-LbuCas13a soluble purified with His Trap Ni-NTA column (Cytiva), 1st eluted fraction. Lane 4: SUMO-LbuCas13a soluble from 1st elution fraction, digested with SUMO protease ULP1 and further purified with His Trap Ni-NTA column (Cytiva). Lane 5: SUMO-Cas13a soluble purified with His Trap Ni-NTA column (Cytiva), 2nd eluted fraction. Lane 6: SUMO-LbuCas13a soluble purified with His Trap Ni-NTA column (Cytiva), 3rd eluted fraction. Lane 7: Protein marker (NZY protein marker II). Lane 8: SUMO-LbuCas13a from IBs, purified with His Trap Ni-NTA column (Cytiva), 2nd eluted fraction. Lane 9: SUMO-LbuCas13a IBs from 1st elution, digested with SUMO protease ULP1, purified with His Trap Ni-NTA column (Cytiva). Lane 10: SUMO-Cas13a IBs, purified with His Trap Ni-NTA column (Cytiva), 1st eluted fraction.]] | ||
| − | + | From the results obtained from the SDS PAGE gel electrophoresis we can conclude that the purification steps removed all the non specific bacterial proteins (lane 3, figure 14). The final purity of the recombinant SUMO-LbuCas13a protein is estimated at around 95%. | |
| + | In addition, the Ulp1 protease efficiently cleaved the SUMO chaperone at the diglycyl motif of the SUMO-LbuCas13a fusion protein. Specifically, after the addition of the Ulp1 protease the SUMO tag was efficiently removed form the LbuCas13a protein and this is clearly depicted at the SDS-PAGE electrophoresis (figure 14, lane 4). The LbuCas13a protein without the SUMo addition is estimated at a MW of 135 kDa as clearly depicted on the SDS-PAGE gel electrophoresis. | ||
==Feasibility of LbuCas13a/crRNA system for miRNA detection.== | ==Feasibility of LbuCas13a/crRNA system for miRNA detection.== | ||
| Line 229: | Line 236: | ||
'''A detection standard curve was constructed plotting the miRNA concentration in known tested samples (standards) against fluorescence intensity.''' The calibration curve is a bioanalytical method which represents a linear relationship between concentration of an analyte (independent variable-miRNA added) and response (dependend variable-fluorescence intensity). This relationship is used to predict the unknown concentration of the analyte in a complex matrix such as the blood or serum (Merom (Merom et al., 2019). The standard curve-based quantification method is efficiently applied by other analytical quantification assays and allows us to identify the miRNA concentration of an unknown sample just by acquiring its fluorescence intensity through the DIAS detection assay. | '''A detection standard curve was constructed plotting the miRNA concentration in known tested samples (standards) against fluorescence intensity.''' The calibration curve is a bioanalytical method which represents a linear relationship between concentration of an analyte (independent variable-miRNA added) and response (dependend variable-fluorescence intensity). This relationship is used to predict the unknown concentration of the analyte in a complex matrix such as the blood or serum (Merom (Merom et al., 2019). The standard curve-based quantification method is efficiently applied by other analytical quantification assays and allows us to identify the miRNA concentration of an unknown sample just by acquiring its fluorescence intensity through the DIAS detection assay. | ||
| − | '''For the standard curve construction we followed the procedure described at | + | '''For the standard curve construction we followed the procedure described at the measurement page of iGEM22_Thessaloniki_Meta WIKI page (https://2022.igem.wiki/thessaloniki-meta/measurement) '''. As for all bulk fluorescence experiments, 50μl of Cas13a mix was prepared with 20nM LbuCas13a, 20nM crRNA, 0.5μΜ FQ5U Reporter, different concentrations of target miRNA (0-negative control, 1pM, 5pM, 10pM, 50pM, 100pM) and 1X Reaction buffer (10mM Tris-HCl, 50mM NaCl, 10 mM MgCl2, pH 7.9). The fluorescence detection was performed at 37 °C for 60 min using a fluorescence plate reader with fluorescence collected every two minutes. To construct the final standard curve for the detection system we plotted the fluorescence intensity of each miRNA tested concentration versus time analyzing the data from the plate reader. For each time point a standard curve was constructed along with the corresponding linear trendline and coefficient of determination (R2). The curve showing the best linearity and R2 was chosen as the final standard curve for the the detection platform. |
[[File:Stan curve 8.png |800px|thumb|center|'''Figure 19'''.Final standard curve for bulk fluorescence detection utilizing the DIAS platform. Standard curves were generated for the miR-17-3p using a dilution series of known input amounts of synthetic miRNA oligonucleotides corresponding to the target of the assay. 50μl of Cas13a master mix was prepared for each miRNA. The Cas13a master mix was prepared with 20nM LbuCas13a, 20nM crRNA, 0.5μΜ FQ5U RNA reporter and different concentrations of synthetic miR-17-3p (0-negative control, 1pM, 5pM, 10pM, 50pM, 100pM) in 1X reaction buffer.]] | [[File:Stan curve 8.png |800px|thumb|center|'''Figure 19'''.Final standard curve for bulk fluorescence detection utilizing the DIAS platform. Standard curves were generated for the miR-17-3p using a dilution series of known input amounts of synthetic miRNA oligonucleotides corresponding to the target of the assay. 50μl of Cas13a master mix was prepared for each miRNA. The Cas13a master mix was prepared with 20nM LbuCas13a, 20nM crRNA, 0.5μΜ FQ5U RNA reporter and different concentrations of synthetic miR-17-3p (0-negative control, 1pM, 5pM, 10pM, 50pM, 100pM) in 1X reaction buffer.]] | ||
| Line 252: | Line 259: | ||
| − | [[File:Plot with know added miRNA concentrations..png |800px|thumb|center|'''Figure 20'''.Real values of added miRNA 17-3p concentrations versus the corresponding predicted values of the added miRNA concentrations based on the standard curve.]] | + | [[File:Plot with know added miRNA concentrations..png |800px|thumb|center|'''Figure 20'''.Real values of added miRNA 17-3p concentrations versus the corresponding predicted values of the added miRNA concentrations based on the standard curve of the Cas13a/crRNA system.]] |
| Line 260: | Line 267: | ||
| − | [[File:Target miRNA concentrations estimation based on standard curve+ added miRNAs.png |800px|thumb|center|'''Figure 21'''.Real values of added miRNA 17-3p concentrations in complex “non-selective miRNA-enriched envirnoment” versus the corresponding predicted values of the added miRNA concentrations based on the standard curve.]] | + | [[File:Target miRNA concentrations estimation based on standard curve+ added miRNAs.png |800px|thumb|center|'''Figure 21'''.Real values of added miRNA 17-3p concentrations in complex “non-selective miRNA-enriched envirnoment” versus the corresponding predicted values of the added miRNA concentrations based on the standard curve of the Cas13a/crRNA system.]] |
<h3>Relative quantification of miRNA-17-3P in total RNA extracts isolated from 2 different cell lines.</h3> | <h3>Relative quantification of miRNA-17-3P in total RNA extracts isolated from 2 different cell lines.</h3> | ||
| Line 274: | Line 281: | ||
| − | [[File:Triplo.jpg |500px|thumb|center|'''Figure 22'''.Expression levels of miR-17-3P in total RNA extracts isolated form MRC-5 normal cells and A549 cancer cells and in total RNA extract isolated form A549 cells with added spike in-miRNA concentration (36pM). One-way Anova was used to reveal difference in the miRNA detection levels between samples. *p<0.05, ***p<0.001.]] | + | [[File:Triplo.jpg |500px|thumb|center|'''Figure 22'''.Expression levels of miR-17-3P in total RNA extracts isolated form MRC-5 normal cells and A549 cancer cells and in total RNA extract isolated form A549 cells with added spike in-miRNA concentration (36pM). The CRISPR/Cas13a system was used for the estimation of the expression levels. One-way Anova was used to reveal difference in the miRNA detection levels between samples. *p<0.05, ***p<0.001.]] |
| − | [[File:Diplo.jpg |500px|thumb|center|'''Figure 23'''.Expression levels of miR-17-3P in total RNA extracts isolated form MRC-5 normal cells and A549 cancer cells. Unpaired t test was used to reveal difference in the miRNA detection levels between samples. ***p<0.001.]] | + | [[File:Diplo.jpg |500px|thumb|center|'''Figure 23'''.Expression levels of miR-17-3P in total RNA extracts isolated form MRC-5 normal cells and A549 cancer cells. The CRISPR/Cas13a system was used for the estimation of the expression levels. Unpaired t test was used to reveal difference in the miRNA detection levels between samples. ***p<0.001.]] |
The results of the detection assay revealed that the miR-17-3P expression levels in A549 lung cancer cells are slightly elevated compared to MRC-5 normal cells.In addition, the positive control sample containing the same quantity of total RNA extract with the addition of a predefined concentration of miR-17-3P (spike-in) revealed an approximately 10 fold elevation in miR-17-3P detection levels compared to MRC-5 and A549 cells (Figure 22). Therefore, we can conclude that the detection platform’s performance is retained in this biological complex matrix (MRC-5 & A549 cells) which contains the target miRNA molecules in a pool of several RNA molecules including mRNAs, rRNAs, tRNAs, miRNAs, etc. The next of our experimental pipeline involves the verification of miR-17-3P elevated levels in A549 compared to MRC-5 with qPCR. | The results of the detection assay revealed that the miR-17-3P expression levels in A549 lung cancer cells are slightly elevated compared to MRC-5 normal cells.In addition, the positive control sample containing the same quantity of total RNA extract with the addition of a predefined concentration of miR-17-3P (spike-in) revealed an approximately 10 fold elevation in miR-17-3P detection levels compared to MRC-5 and A549 cells (Figure 22). Therefore, we can conclude that the detection platform’s performance is retained in this biological complex matrix (MRC-5 & A549 cells) which contains the target miRNA molecules in a pool of several RNA molecules including mRNAs, rRNAs, tRNAs, miRNAs, etc. The next of our experimental pipeline involves the verification of miR-17-3P elevated levels in A549 compared to MRC-5 with qPCR. | ||
Latest revision as of 11:59, 13 October 2022
SUMO-LbuCas13a coding device under T7 promoter
This plasmid contains all the basic genetic parts required for the bacterial expression of codon-optimized LbuCas13a protein in fusion with small ubiquitin-like modifier (SUMO) protein which favors the increased expression and solubility of the recombinant LbuCas13a protein. Therefore, by expressing the LbuCas13a protein in fusion with the SUMO-chaperone protein the quantity of Cas13a protein that accumulates to the soluble cytoplasmic fraction can be elevated, succeeding proper protein folding and subsequent efficient SUMO tag removal.
Biology and usage
CRISPR/Cas13a systems as RNA sensors
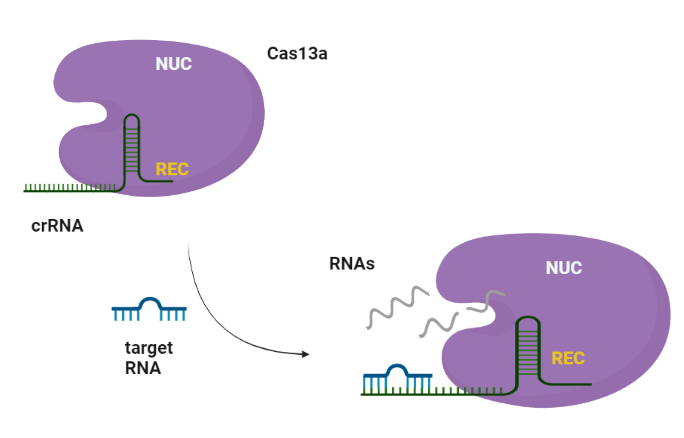
CRISPR-Cas systems are RNA-guided adaptive immune systems that protect prokaryotes from foreign genetic elements derived from evading viruses and phages (Shan et al., 2019). The Cas13a is ribonuclease with a double biological functionality: catalyzes the crRNA maturation and degrades the RNA-guided ssRNA (single-stranded RNA) interdependently using two separated catalytic sites (Rath et al., 2015). Generally, CRISPR/Cas system can be divided into two main classes, class I and II, according to the system comprising a single or multiple effectors (Liu et al., 2017). Among them, class II (e.g., Cas9, Cas12, and Cas13) possesses more widespread application, due to its simple components (a single effector protein and a programmable guide RNA, Wang et al., 2021). Cas13 can be further divided into four subtypes, Cas13a-d, exhibiting diverse primary sequences except the two highly conserved HEPN (higher eukaryotes and prokaryotes nucleotide-binding) domains, which are responsible for both cis- and trans-RNase activities (Florczuk et al., 2017). Structural studies revealed that Cas13a adopts a bilobed architecture including recognition (REC) and nuclease (NUC) lobes (Wang et al., 2021, Zhou et al., 2020). CRISPR-Cas12,13,14 exhibits nonspecific degradation of non target (trans cleavage) after specific recognition of nucleic acids, thus CRISPR/Cas biology promises rapid, accurate, and portable diagnostic tools, the next-generation diagnostics. Cas13a due to its propensity to cleave RNAs after binding a user-defined RNA target sequence, is used to detect single molecules of RNA species with high specificity (Liu et al., 2017).
Similarly to Cas9, Cas13a recognizes the short hairpin of the crRNA and made a complex. The target specificity is encoded by the 28-30-nt crRNA spacer sequence which is complementary to the target region. Cas13s exhibit collateral activity and after recognition and cleavage of the target transcript, degrades non-specifically any nearby RNAs regardless of complementarity to the spacer.
Weaknesses in traditional RNA detection methods
This innovative molecular system has provided breakthrough opportunities for RNA detection for clinical diagnostics (Shan et al., 2019). Since RNA molecules are key mediators in all biological processes, served as significant biomarkers to the clinical verification and differential diagnosis of cancer. MiRNAs are a class of small non-coding RNAs that participate in numerous cellular processes such as cellular development, proliferation and apoptosis. Indeed, deviating miRNA expression is often related to the occurrence of diseases such as cancer. Therefore, the accurate detection of differences in miRNAs detection serve could serve as significant biomarkers for cancer verification and diagnosis.
The RNA detection approaches can be characterized into 2 main categories, the direct detection and the indirect nucleic acid amplification (NAA)-based detection. Both approaches have advantages but also significant disadvantages which hinder their wide application in clinical practice. The direct classical methods including Nothern blotting, microarrays and FISH, despite their high fidelity, lack high sensitivity and are labor-intensive, time-consuming and require specialized personnel. On the other side, NAA-based detection approaches such as reverse transcription PCR (RT-PCR) and other isothermal amplification techniques show high sensitivity but introduce additional steps such as the conversion of RNA to DNA and auxiliary DNA template replication steps in order to achieve signal amplification. These additional steps often result in considerable sample loss due to incomplete RT step, amplification bias caused by error-prone sequence amplification, and a high risk of false-positive results due to possible contamination. These issues render the existing IVD tools for cancer diagnostics inadequate for clinical application in routine base.
SUMO solubility tag
SUMO protein has been previously fused to the N-terminus of several proteins leading to increased expression and solubility of the protein of interest (Liponska et al., 2018). But how does SUMO protein enhance protein solubility and proper folding? The answer lies in the structure of SUMO protein. Specifically, SUMO has an inner hydrophobic core and an external hydrophilic surface, thus exerting a detergent-like effect on proteins that cannot easily acquire their proper folding (Butt et al., 2005). Despite the advantages of SUMO addition, one drawback of this protein expression strategy is the necessary cleavage of the solubility tag. However, many SUMO proteases such as Ulp1, which are members of the cysteine protease superfamily can be used to cleave the SUMO tag without affecting the N-terminus of the desired protein (Panavas et al., 2009).
Basic parts of the device
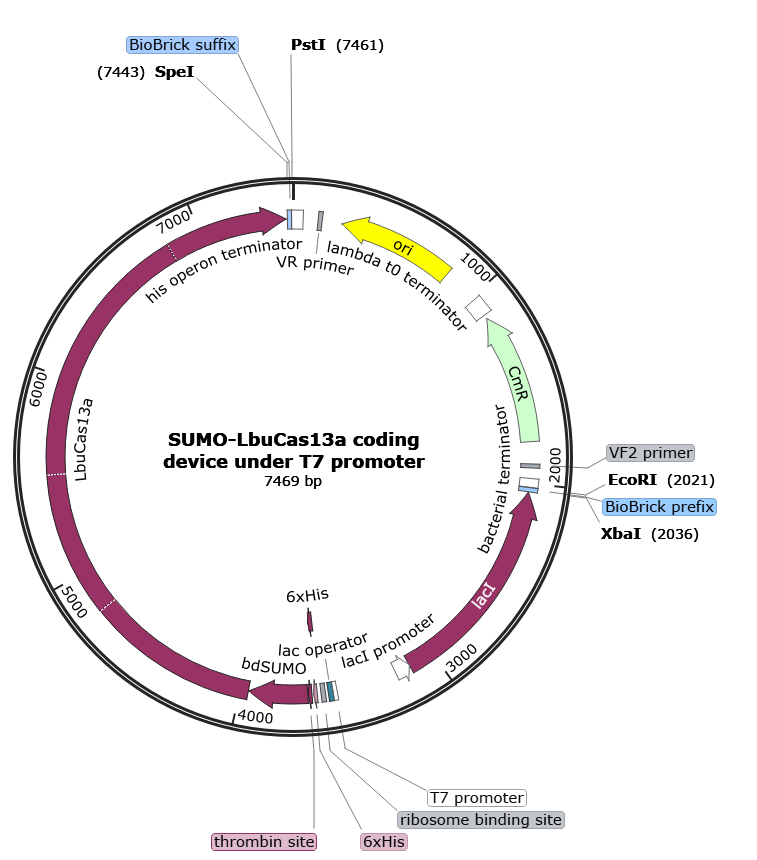
The part sample which is flanked at the beginning and the end with prefix and suffix respectively, is composed of the following basic parts assembled together in series and downstream of the prefix:
- Bacterial terminator for LacI CDS (upstream of prefix): putative bacterial transcription terminator
- Biobrick Prefix sequence (backbone sequence): BioBrick prefix for parts that do not start with "ATG"
- LacI Coding sequence: Lac repressor
- LacI promoter: Promoter that has the transcriptional control of Lac repressor
- T7 promoter: promoter for bacteriophage T7 RNA polymerase
- Lac operator: Lac repressor protein binding site
- Ribosome binding site: efficient ribosome binding site from bacteriophage T7 gene 10 (Olins and Rangwala, 1989)
- 6XHis tags: 6xHis affinity tag
- Thrombin site: thrombin recognition and cleavage site
- bdSUMO CDS: small ubiquitin-like modifier (SUMO) protein
- LbuCas13a CDS: Cas13a protein derived from Leptotrichia Buccalis
- Biobrick Suffix sequence (backbone sequence) : universal suffix for all parts
- His operon terminator (downstream of Suffix): putative transcription terminator from the E. coli
This genetic device is a part of the meta-CRISPR part collection developed by iGEM22_Thessaloniki_Meta.
Meta-CRISPR part collection
The meta-CRISPR part collection was developed in accordance with standardization, modularity and standard assembly rules aiming to enhance the CRISPR/crRNA applicability in synthetic biology projects. This collection allows the interchangeability of the genetic parts and the automation of construction following a standardized Golden Gate-based cloning strategy. Utilizing the meta-CRISPR collection, future iGEM teams can select the desired combination of DNA parts depending on the specific application of the CRISPR method (https://2022.igem.wiki/thessaloniki-meta/part-collection). Through the combination of different promoters and LbuCas13a coding sequences, one can select the desired LbuCas13a expression system, for example under the transcriptional control of the T7 or the pRha promoter. In addition, by combining the suitable genetic parts, researchers can select the purification method of the recombinant LbuCas13a protein either from inclusion bodies or from the soluble cytoplasmic fraction of the bacteria. Regarding the crRNA, utilizing the guidelines provided on the crPrep-crRNA preparation kit one can easily in silico design and produce the necessary crRNA sequence depending on the target miRNA utilizing the standardized cloning method and requiring only one additional primer. Last but not least, the LbuCas13a coding device can be assembled with the crRNA transcription system in a single plasmid enabling the simultaneous production of the LbuCas13a/crRNA complex in bacteria.

Cloning strategy and results
For the final assembly of the PCR amplified genetic elements into pSB1C3 plasmid we followed the Golden Gate-based ‘SevaBrick Assembly’ method and the SEVA 3.1 platform (Damalas et al., 2020).
'SevaBrick assembly' method
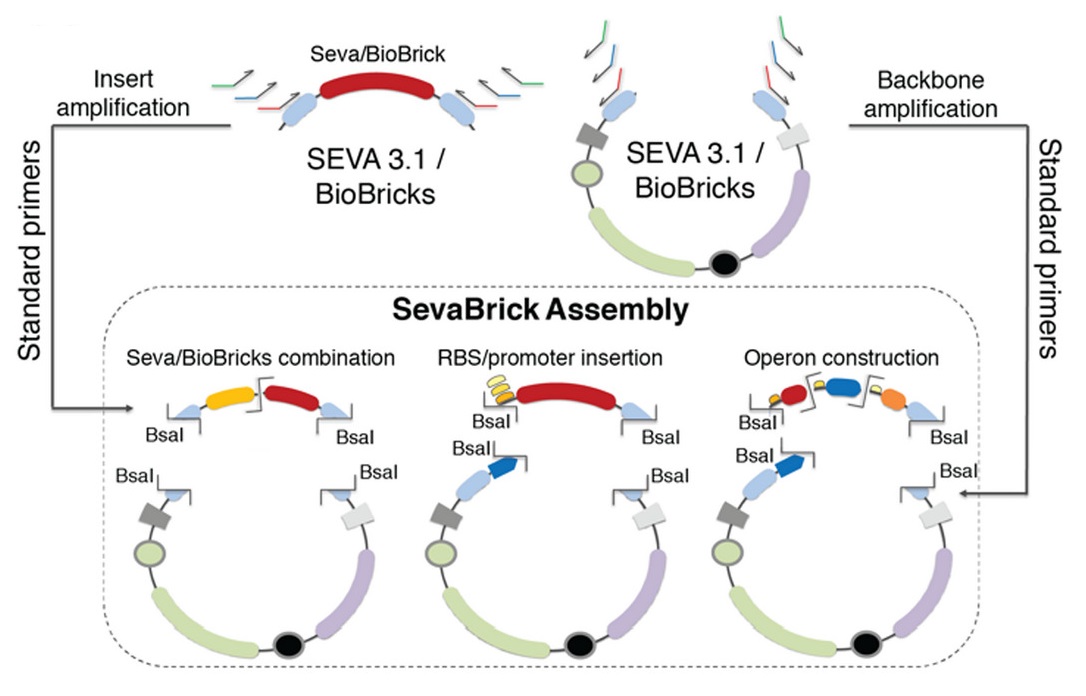
The Golden Gate-based ‘SevaBrick Assembly’ method was introduced by Stamatios G. Damalas and colleagues (Damalas et al., 2020). This method consists of standardized primers and protocols and facilitates the straightforward one-step assembly of multiple genetic elements into the SEVA 3.1 or the pSB#X# (# is determined by the identity of the replication origin and the letter X is determined by the antibiotic resistance marker) backbones in a fast and reliable process. The SevaBrick Assembly is a method where all the parts and backbones to be assembled are PCR amplified from any SEVA 3.1 or BioBrick vector, using a core set of standard long primers. All SevaBrick primers anneal on standard sequences of the SEVA 3.1 or BioBrick vectors, introducing BsaI recognition sites for directional multipart assembly via Golden Gate (Figure 2).
As for all our final composite parts, the initial steps of our cloning strategy constitute the PCR amplification of different genetic elements, followed by the efficient assembly of the PCR amplified genetic products into pSB1C3 backbone. The cloning process is described in detail below:
Step 1
- PCR amplification with T7 P0 FWD and T7 P0 RVS primers using the pGJK_His-SUMO-LbuCas13a as a template. This PCR produces the P0 part ready for Golden Gate assembly.
- PCR amplification with T7 P1 FWD and T7 P1 RVS primers using the pGJK_His-SUMO-LbuCas13a as a template. This PCR produces the P1 part ready for Golden Gate assembly.
- PCR amplification with P2 FWD and P4 RVS primers using the cloned cas13a repos plasmid (https://parts.igem.org/Part:BBa_K4170014) as a template. This PCR produces the P2-P4 part ready for Golden Gate assembly.
- PCR amplification with Ev and Pv standard primers from Basic SevaBrick Assembly [seva 3.1] using the Bba_J364007 part of the 2022 DNA distribution Kit. This PCR produced the pSB1C3 backbone linearized and ready for Golden Gate assembly.
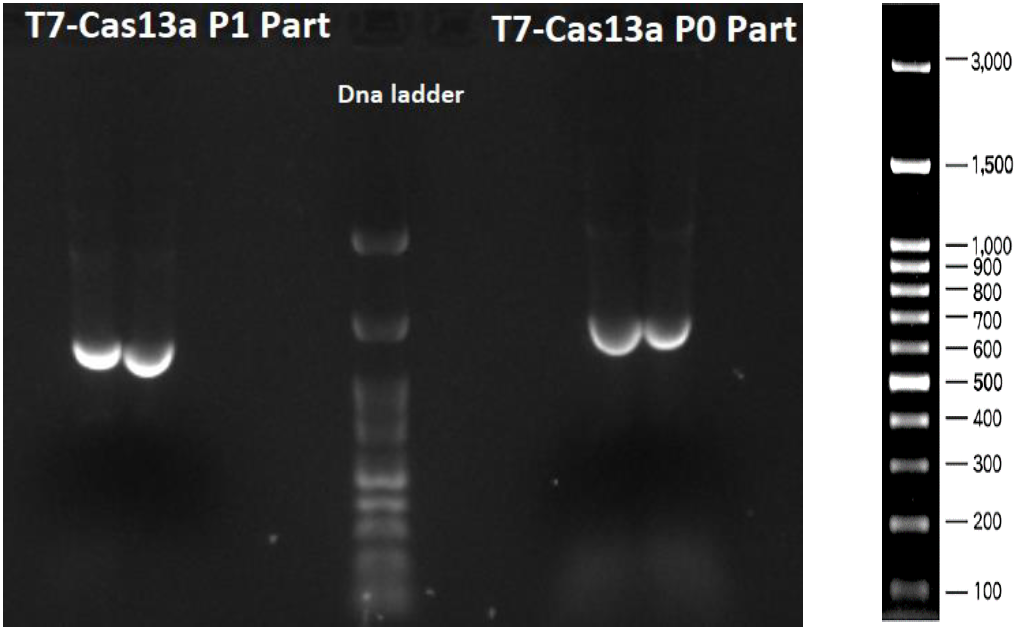
As shown in Figures 3, 4 and 5 all the PCR amplifications succeeded. In Figure 3 T7-Cas13a P1 part (1261 bp) and T7- Cas13a P0 part (1560 bp) are depicted. In Figure 4 T7-Cas13a P2-P4 part (2678 bp) is depicted.
Step 2
Golden Gate assembly of the PCR amplified P0, P1, P2-P4 parts with the linearized pSB1C3 vector for the efficient construction of the SUMO-LbuCas13a coding sequence under the transcriptional control of the T7 promoter. The products of the Golden Gate assembly underwent transformation into E.coli DH5a competent cells and then colony PCR was performed, using two pairs of primers: VR / VF and T7-Cas13a-P0-FWD / Cas13a-P4-RVS. For the colony PCR procedure, from the agar plate half amount of each colony was picked and diluted on 10 μl of dH20. The other half amount was picked for liquid overnight culture. The samples were loaded and run 1 % agarose gel electrophoresis. After gel electrophoresis completion we concluded that the Golden Gate assembly was successful at five out of six total colonies because these colonies have received the desired insert (5713 bp).
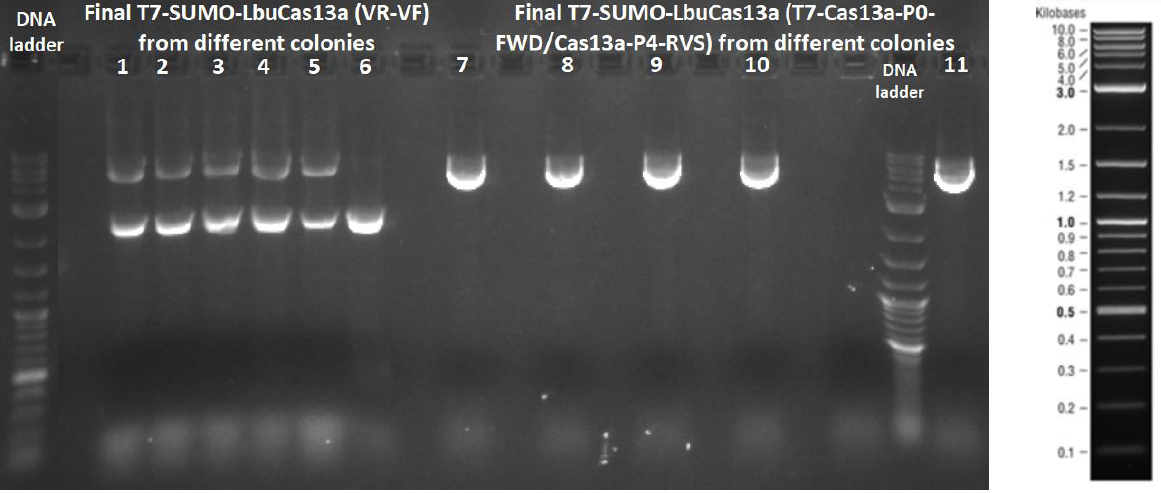
The final T7-SUMO-LbuCas13a contains all the basic genetic parts required for the bacterial expression of codon-optimized LbuCas13a protein in fusion with small ubiquitin-like modifier (SUMO) protein.
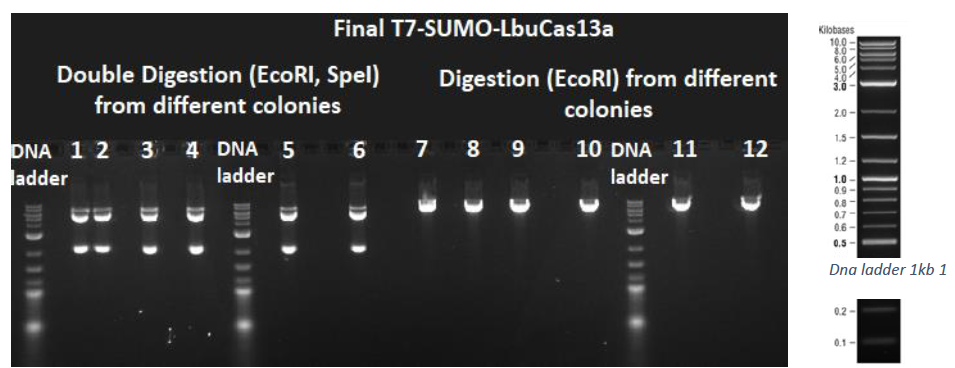
After the successful golden gate assembly as demonstrated by the colony PCR procedure, the final T7-SUMO-LbuCas13a plasmid was isolated from the appropriate colonies, followed by diagnostic digestions to verify the correct assembly with a different methodology than colony PCR. The isolated plasmid was submitted to a double digestion using the restriction enzymes EcoRI and SpeI, as well as to a single digestion using the restriction enzyme EcoRI. Then a 1% agarose gel electrophoresis was conducted. From the double digestion two bands should arise (5422 bp and 2047 bp), while from the simple digestion with EcoRI only a 7469bp band should arise. As depicted in the next figure all the digestions were successful.
Recombinant SUMO-LbuCas13a expression
General protein expression workflow
This protocol was followed for all the protein expression experiments with minor modifications at the IPTG concentration, induction temperature or time of induction . The procedure of the protein expression initiates with the preparation of the bacterial pre-culture (15ml) incubated overnight at 37 °C. The following day the pre-culture was diluted in 1L of nutrient media, followed by a further incubation at 37°C of the diluted pre-culture until Optical Density (OD600) reached 0.7 – 0.8 (continuous measurements at the photometer at specific time points). To induce LbuCas13a protein expression we added IPTG to the 1L bacterial culture to achieve a final concentration of 1mM (variable). The bacterial culture was then incubated for 6 hours (variable) at 37°C (variable). After overnight incubation, the bacterial culture was centrifuged at 10.000 g for 20 min at 4 °C and the supernatant was discarded. The bacterial pellets were resuspended in binding buffer (3oomM NaCl, 50mM NaH2PO4, 10mM imidazole, pH 8) followed by successive freeze-thaw cycles. After the freeze-thaw steps, Lysozyme (100mg/ml) and Triton x-100 were added and ultrasonication was performed to lyse the bacterial membrane. After ultrasonication, DNase (1mg/ml), MgCl2 (8mM) and Protease Inhibitor (PI) were added and the samples were incubated in a cold room for 2 hours on a rotator machine. To obtain the soluble fraction of the protein, refrigerated centrifugation was carried out and the supernatant was then filtered by using 0.22 μm filter units. The remaining pellet constitutes the Inclusion Bodies (IBs), which also contains the insoluble form of the protein of interest. To isolate the SUMO-LbuCas13a protein from the IBs, the bacterial pellet is subjected to successive washing steps using 3 different buffers (A, B, C) followed by ultracentrifugation at 30.000g for 20 min at 4 C. The process is completed by resuspending the protein in L-Arginine solution which promotes the proper folding of the protein restoring its functional quaternary structure.
LbuCas13a protein expression procedure with 4 hours induction, at 37 oC using 1mM IPTG
Initially, a four-hour induction with 1mM IPTG at 37oC was tested (1L bacterial culture). The aim was to observe the behavior of the system and decide the course of action. 1ml of the bacterial culture had been removed every hour (creation of timeline), and when the induction ended, the soluble part of SUMO- LbuCas13a was separated from the insoluble part. The samples then were analyzed using 8% SDS-PAGE gel electrophoresis, and further subjected to Western Blot analysis , using an Anti-His primary antibody (Santa Cruz Biotechnology) in 1:2000 dilution ratio.

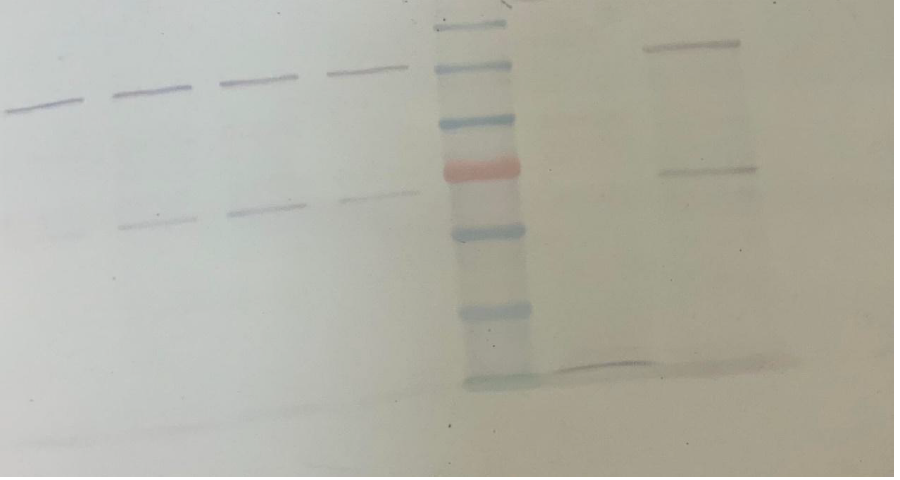
Based on the visual observation of the sample analysis we concluded that the use of high temperature and high concentration of IPTG, were not enough to promote the protein expression in the soluble cytoplasmid fraction of the bacteria. Therefore, the addition of the SUMO solubility enhancer accompanied by a 4h induction is not adequate to promote the recombinant protein expression in the soluble form. In contrast, the insoluble part (inclusion bodies) was observed to contain the protein of interest, but not in a quantity sufficient to be exploited in later procedures.
LbuCas13a protein expression timeline, at 25oC using 1mM IPTG
After the first inefficient attempt to produce high quantities of the LbuCas13a in the soluble fraction, we decided that the best route would be an overnight induction at 25oC with a 1mM concentration of IPTG. Since the four-hour protocol didn’t work a protein production timeline was constructed with a duration of 6 hour.Specifically, a sample from the bacterial culture was removed every hour and further processed to obtain the soluble and insoluble fraction. Then, the samples were analyzed using gel 8% SDS-PAGE electrophoresis followed by western blot analysis.


At the end of the six-hour time point the expression of the soluble SUMO-LbuCas13a was observed. At the same time the quantity of the insoluble SUMO-LbuCas13a has been increased also.
LbuCas13a protein expression procedure with overnight induction, at 25oC using different concentrations of IPTG
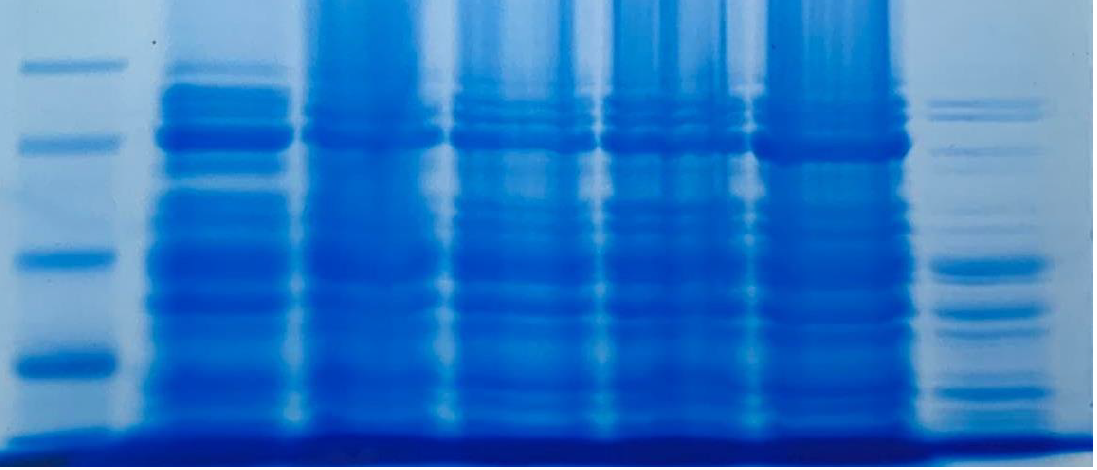
After the conformation of the expression conditions, different concentrations of IPTG were tested, in order to: a) determine the most efficient concentration that produces a satisfactory quantity of soluble SUMO-LbuCas13a; b) investigate and understand which concentration offers the best soluble/insoluble ratio. Taking into account the above five different concentrations of IPTG were used: 1mM, 0.2mM, 0.4mM, 0.6mM and 0.8Mm following the same protocol (1L bacterial cultures induced overnight at 25oC). The final products were analyzed using SDS-page electrophoresis and western blotting methods. The results rendered IPTG concentration among the most important factors for LbuCas13a protein expression. The higher the concentration of IPTG was, the higher the amount of the protein expressed, as depicted in Figures 12,13a,b. It is also observed that the induction procedure with 1mM IPTG offered the best results.


Recombinant LbuCas13a purification and SUMO cleavage
The last step for the LbuCas13a production constitutes the purification and digestion of SUMO-LbuCas13a, using the cytiva His trap Ni-NTA column kit and the SUMO protease ULP1, respectively. Both protocols were applied on soluble and insoluble SUMO-LbuCas13a as well. The results were analyzed through SDS-page and western blotting methods. The purification and the cleavage of the SUMO tag were performed successfully on the protein derived from both the soluble and insoluble (inclusion bodies) fraction.
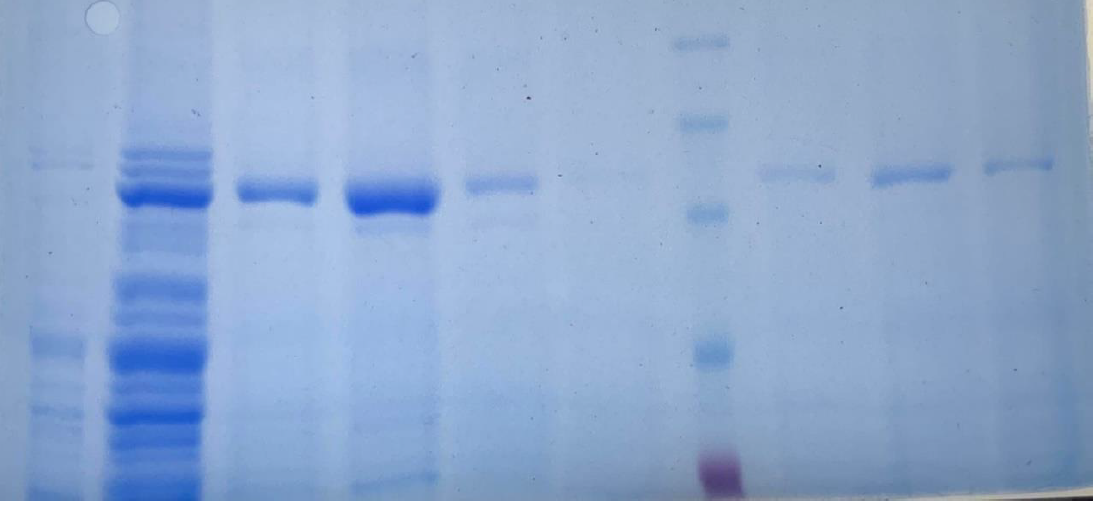
From the results obtained from the SDS PAGE gel electrophoresis we can conclude that the purification steps removed all the non specific bacterial proteins (lane 3, figure 14). The final purity of the recombinant SUMO-LbuCas13a protein is estimated at around 95%. In addition, the Ulp1 protease efficiently cleaved the SUMO chaperone at the diglycyl motif of the SUMO-LbuCas13a fusion protein. Specifically, after the addition of the Ulp1 protease the SUMO tag was efficiently removed form the LbuCas13a protein and this is clearly depicted at the SDS-PAGE electrophoresis (figure 14, lane 4). The LbuCas13a protein without the SUMo addition is estimated at a MW of 135 kDa as clearly depicted on the SDS-PAGE gel electrophoresis.
Feasibility of LbuCas13a/crRNA system for miRNA detection.
To efficiently construct a well-characterized LbuCas13a/crRNA based detection system we had to investigate the experimental conditions that affect the reaction performance. The following experimental conditions were investigated:
- The reaction buffer composition for enabling LbuCas13a collateral activity.
- The RNA reporter (FQ5U) concentration in the reaction, necessary for the fluorescence signal.
- The time point of fluorescence detection since reaction initiation. The fluorescence capture point should be in the linear part of the curve before the plateau phase for system’s best performance.
- Standard curve construction which plots the fluorescence intensity of known added miRNA concentrations (standards) in the reaction. This calibration curve can be used for the determination of the target miRNA concentration in unknown samples.
Reaction buffer composition enabling LbuCas13a collateral activity.
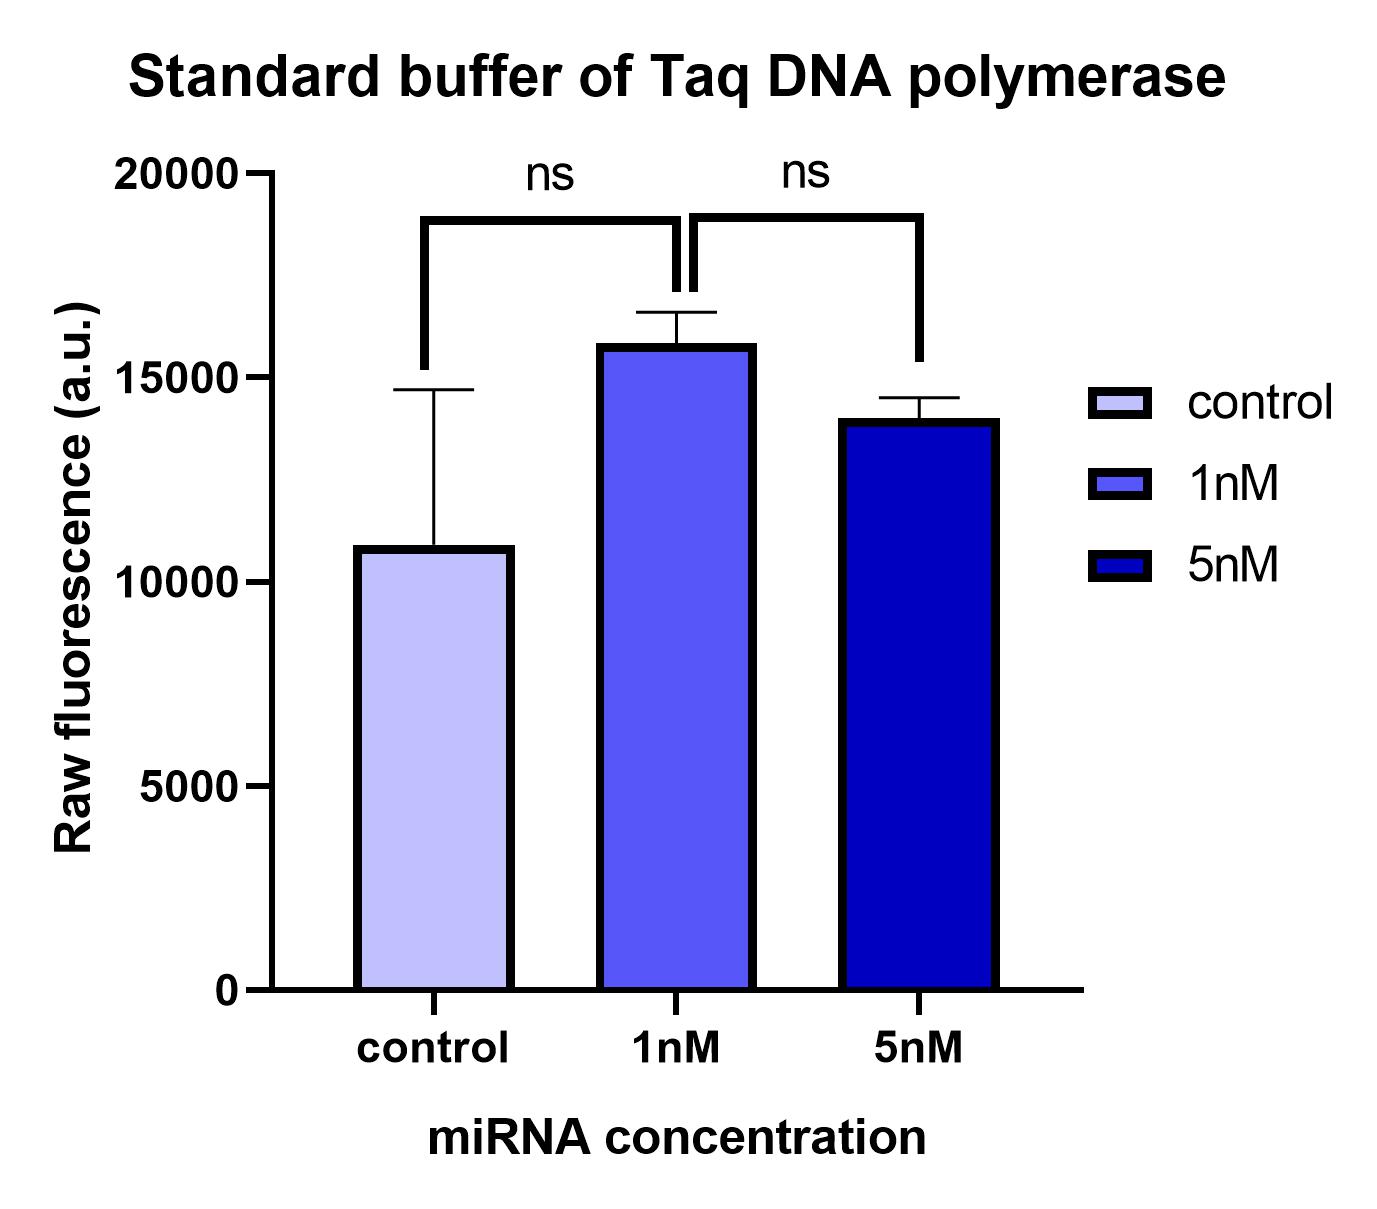
The reaction buffer composition affects the functionality of the LbuCas13a enzyme as well as the stability of the crRNA molecules necessary for the reaction. If the reaction buffer does not contain the necessary components or the appropriate pH, the functionality of the LbuCas13a protein can be minimized reducing the detection system’s performance (Shan, Zhou, Huang and Xing, 2019). According to an extensive literature research the reaction buffer A was deemed suitable for use (Liu et al., 2017). In addition, we decide to investigate the LbuCas13a activity on the Taq DNA polymerase standard buffer (Taq DNA Polymerase PCR Buffer, Cat. No. 18067-017, invitrogen) to clarify if the LbuCas13a/crRNA reaction can be performed at a standard PCR buffer.
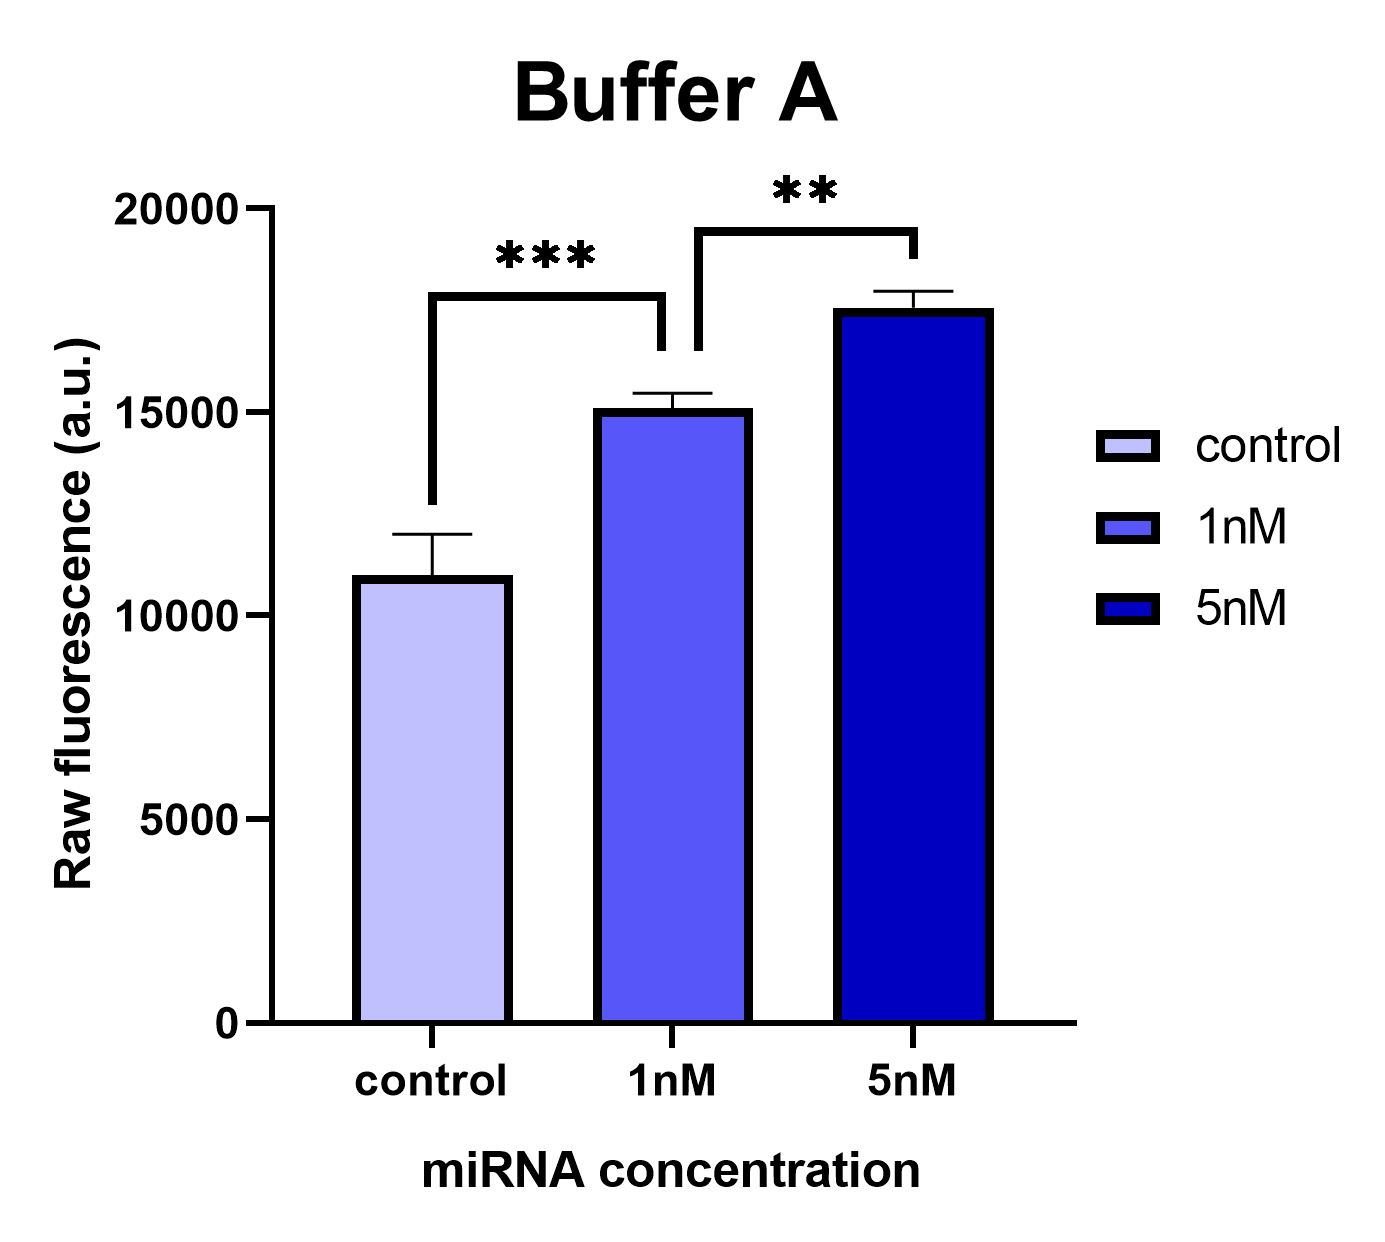
We conducted comparative experiments between the Buffer A and the Taq DNA Polymerase standard buffer to test the LbuCas13a enzyme’s functionality. LbuCas13a (20nM) was incubated with 20nM crRNA and 1μΜ FQ5U RNA reporter in reaction buffer A or in Taq DNA Polymerase standard buffer respectively. Two different concentrations of a synthetic target miR-17-3p (1nm & 5nM) was added in each reaction tube. The total reaction volumes were 50μl. The mixtures were then incubated in a fluorescence micropate reader (Tekan) at 37 °C for 1 hour with fluorescence measurements (FAM channel, λex 494 nm, λem 518nm) taken every second min. The raw fluorescence intensities generated by the efficient cleavage of the RNA reporter by the LbuCas13a enzyme in each tested reaction buffer are presented on the following figures.
Analyzing the results, we can conclude that the Buffer A provides consistent and reliable results while the common Taq Polymerase standard buffer provides inconsistent results without statistical significance in the observed fluorescence intensities of 1nM and 5nM reaction tubes. In the latter buffer, the fluorescence intensity is not proportionally elevated according to the target miRNA concentration (1nM or 5nM) added in the reaction. These results likely prove that the MgCl2 concentration added in Buffer A is necessary for the proper functionality of the LbuCas13a enzyme. The affect of the Mg2+ ion on the Cas13 processing efficiency has been previously reported on literately for the type VI-D Cas13d ribonuclease (Zhang et al., 2018). In addition, since the pH and the KCl concentrations are the same between the 2 buffers, the differences of Tris HCl buffer concentration could probably affect the system’s functionality. Improper reaction buffer could cause a significant background signal implicated the analysis.
Investigation of the RNA reporter concentration required for the detection assay.
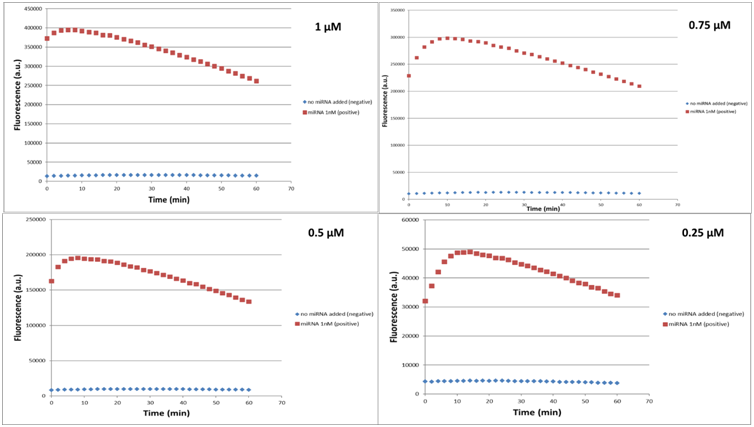
Since we concluded that the Buffer A ensures the enzyme’s functionality, we had then to evaluate the RNA Reporter concentration needed to achieve the best detection system’s performance. Reaction tubes were prepared with 20nM LbuCas13a, 20nM crRNA, 1nM target miR-17-3P and different concentrations of RNA Reporter (0.1nM, 0.25nM, 0.5 nM, 0.75nM & 1nM). The total reaction volumes were 50μl. The mixtures were then incubated in a fluorescence micropate reader (Tekan) at 37 °C for 1 hour with fluorescence measurements (FAM channel, λex 494 nm, λem 518nm) taken every second min as previously. After data acquisition we proceeded to a Michaelis-Menten analysis exploited the in silico analysis provided on the model page.
Michaelis-Menten enzyme kinetics
In Figure 17 are demonstrated the fluorescence curves of the LbuCas13a experiments. The concentrations of the crRNA 17-3p standard, LbuCas13a and miR 17-3p selected to be 10, 20 and 1 nM respectively for all the experiments. The concentration of reporter RNA selected to have values 1, 0.75, 0.5, 0.25, 0.1 μM. In every figure it can be seen that the fluorescence values for the experiments with the miR target are higher than the control values.
Every curve shows a maximum fluorescence intensity at around 5 minutes since reaction initiation. The curves presented on figure 17 can be split into 2 main parts. The first part of the curves is the linear increasing part that corresponds to the time interval between reaction initiation (o min) and the time point that the curves hit their maximum fluorescence intensity. The linear part of the curve is needed for the efficient detection of the target RNA. The linear behavior can be described by the mathematical formula of Michaelis – Menten enzyme kinetics which is: dF/dt=V0=Vm[reporter]/Km+[reporter] (1)
The term dF/dt is the slope term of the increasing part of the curve. The Vm is the maximum velocity of the reaction. The term Km is the concentration of the substrate (reporter) that will result in half Vm velocity. This mathematical formula can be transformed as: 1/V0=Km/Vm[reporter]+1/Vm (2)
So, the first step of the analysis is to find the slopes of the linear-increasing part of the curves. We firstly identify the maximum value of the fluorescence on each of the curves,then we take all the points before the maximum and finally we apply the least square line fitting.
After the calculation of the Vm and Km parameters, we can calculate the catalytic activity of the enzyme based on the equation:
kcleavage=Vm/Et(3)
The Vm term is the maximum velocity of the reaction and Et is the concentration of the active enzyme and in our case is the concentration of the target miR (10-9 M). By converting the fluorescence Arbitrary Units to concentration the derived values of the parameters found to be:
Vm (maximum velocity of the reaction)=7.936e-07 M sec-1
Km (substrate concentration of the half reaction velocity)=1.67e-08 M
Kcleavage (enzymatic activity)=793 turnovers per second
Calibration curve construction for the determination of the target miRNA concentration in unknown samples
A detection standard curve was constructed plotting the miRNA concentration in known tested samples (standards) against fluorescence intensity. The calibration curve is a bioanalytical method which represents a linear relationship between concentration of an analyte (independent variable-miRNA added) and response (dependend variable-fluorescence intensity). This relationship is used to predict the unknown concentration of the analyte in a complex matrix such as the blood or serum (Merom (Merom et al., 2019). The standard curve-based quantification method is efficiently applied by other analytical quantification assays and allows us to identify the miRNA concentration of an unknown sample just by acquiring its fluorescence intensity through the DIAS detection assay.
For the standard curve construction we followed the procedure described at the measurement page of iGEM22_Thessaloniki_Meta WIKI page (https://2022.igem.wiki/thessaloniki-meta/measurement) . As for all bulk fluorescence experiments, 50μl of Cas13a mix was prepared with 20nM LbuCas13a, 20nM crRNA, 0.5μΜ FQ5U Reporter, different concentrations of target miRNA (0-negative control, 1pM, 5pM, 10pM, 50pM, 100pM) and 1X Reaction buffer (10mM Tris-HCl, 50mM NaCl, 10 mM MgCl2, pH 7.9). The fluorescence detection was performed at 37 °C for 60 min using a fluorescence plate reader with fluorescence collected every two minutes. To construct the final standard curve for the detection system we plotted the fluorescence intensity of each miRNA tested concentration versus time analyzing the data from the plate reader. For each time point a standard curve was constructed along with the corresponding linear trendline and coefficient of determination (R2). The curve showing the best linearity and R2 was chosen as the final standard curve for the the detection platform.
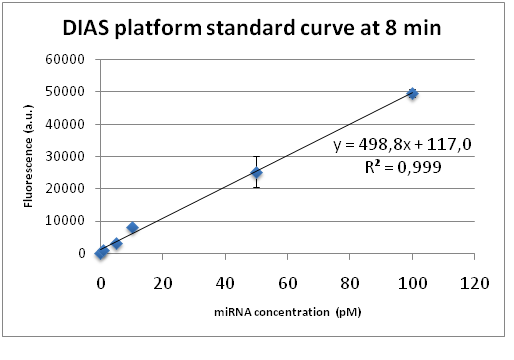
As clearly depicted in the figure the coefficient of determination R2, which is a measure of how well a linear regression line fits the data, approaches 1 indicating perfect fit. This linear calibration curve demonstrates the DIAS assay performance in a validated analytical range (1-100pM) and verifies the remarkable quality of the CRISPR-based bioanalytical method. The best standard curves with R2 approaching the 0.999 value correspond to the time point of 8 minutes after the initiation of the fluorescence detection. Therefore, we concluded that the fluorescence measurements should be made in the time interval from 5 to 10 minutes after the addition of the reagents to the microplate, confirming the short required test execution time. Furthermore, our system is capable of quantifying miRNA concentrations as low as 1pM which indicates the system’s exceptional sensitivity.
CRIPSR/LbuCas13a based-target miR-17-3P detection in complex matrices
Based on the standard curve constructed with known added miRNA concentrations (standards), we continued with additional experiments aiming to detect the miR-17-3P levels in more complex matrices. The following proof of concept experiments were conducted to assess the detection system’s performance:
- Quantification of known added miR-17-3P concentrations in different samples based on standard curve.
- Quantification of known added miRNA-17-3P concentrations in different samples to which a known concentration of other non selective miRNAs (miR-1246 & miR-143) has previously been added.
- Relative quantification of miRNA-17-3P in 2 different cells lines, including human fibroblast normal cells (MRC-5) and human lung adenocarcinoma cells (A549).
Quantification of known added miR-17-3P concentrations in different samples based on the standard curve.
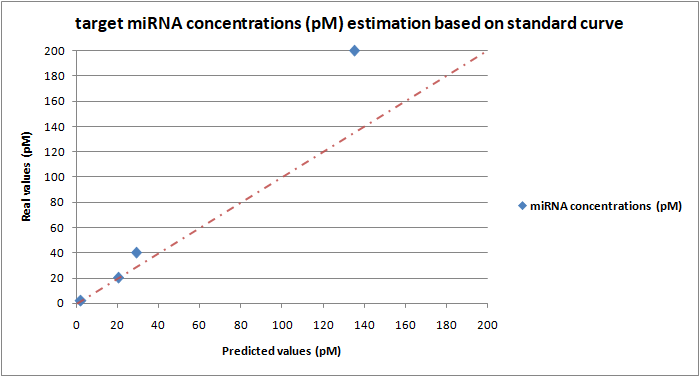
Based on the DIAS platform standard curve (Figure 19) we tested the system’s detection accuracy using different reaction samples which contain a specified known concentration of the miR-17-3P. After the fluorescence measurement, the obtained fluorescence intensity values corresponding to each miRNA concentration are processed by subtracting the background fluorescence corresponding to the negative control value (no miRNA added). The resulting values were entered on the equation y= 498,8 +117,0 of the standard curve (Figure 19, at 8 min) in place of the y variable. The resulting x value corresponds to the predicted miRNA concentration. Based on the analysis results we constructed a plot (Figure 20) where the y-axis shows the actual added miRNA concentrations while the x-axis shows the predicted values of the corresponding miRNA concentrations based on the standard curve. Four different miR-17-3P concentrations (2pM, 20pM, 40pM & 200pM) were investigated and finally plotted on the plot. As described previously, for all bulk fluorescence experiments, 50μl of Cas13a mix was prepared with 20nM LbuCas13a, 20nM crRNA, 0.5μΜ FQ5U Reporter and the different concentrations of target miRNA (standards) in 1X Reaction buffer (10mM Tris-HCl, 50mM NaCl, 10 mM MgCl2, pH 7.9). All reactions were conducted in triplicate.
Quantification of known added miR-17-3P concentrations in “non-selective miRNA-enriched complex environments”
Going one step further, we examined the system’s detection specificity by adding a specified same concentration (8pM) of miR-1246 and miR-143 in all the different reaction samples each containing a different concentration of the target miR-17-3P (2pM, 50pM, 40pM, 200pM) as described previously. The aim of this study is to investigate the LbuCas13a enzyme’s ability to efficiently bind with the crRNA and subsequently with the target miRNA in an “artificial environment” that contains a pool of non-specific miRNAs. As extensively described in the previous section, the obtained processed fluorescence intensity was entered on the equation y= 498,8 +117,0 of the standard curve in place of the y variable to predict the miRNA concentrations. Based on the analysis results we constructed a plot (Figure 21) where the y-axis shows the actual added miR-17-3P concentrations while the x-axis shows the predicted values of the corresponding miRNA concentrations based on the DIAS platform standard curve. As described previously, for all bulk fluorescence experiments, 50μl of Cas13a mix was prepared with 20nM LbuCas13a, 20nM crRNA, 0.5μΜ FQ5U Reporter, 8pM of miR-1246, 8pM of miR-143 and the different concentrations of target miRNA in 1X Reaction buffer (10mM Tris-HCl, 50mM NaCl, 10 mM MgCl2, pH 7.9). All reactions were conducted in triplicate.
Relative quantification of miRNA-17-3P in total RNA extracts isolated from 2 different cell lines.
To validate the detection method's performance in more complicated biological matrices which more closely resemble the clinical samples, we isolated total RNA extracts from human fibroblast normal cells and human lung adenocarcinoma cells. The aim of this experiment is to demonstrate the LbuCas13a/crRNA system's feasibility in detecting the miR-17-3P in a pool of total RNAs as well as investigate the target miRNA expression levels in lung cancer compared to lung normal cells. In addition, as a positive control, we added a specified concentration of the target miR-17-3P (36pM) in A549 cell-derived total RNA extract to demonstrate the system's performance.
The experimental procedures followed for the detection assay are briefly described below.
The two cell lines were cultured in high glucose Dulbecco's modified Eagle Medium (DMEM), enriched with 10% FBS and 1% PS, and incubated under the following circumstances: 37°C, 5% CO2. After the cell density reached 80%, the cells were detached, and centrifuged for collection. 5x10⁵ cells were collected from each cell line and washed with PBS 1%. Afterwards, RNA was isolated from each sample according to the RNeasy micro kit (Qiagen Inc., Chatsworth, CA, USA) which enables the recovery of the total RNA content including the miRNAs. The extracted RNA was assessed for purity and integrity via nanodrop 2000.
For the fluorescence experiments, 50μl of Cas13a mix was prepared with 20nM LbuCas13a, 20nM crRNA, 0.5μΜ FQ5U Reporter and 83.3ng of total isolated RNA extract from each cell line respectively in 1X Reaction buffer (10mM Tris-HCl, 50mM NaCl, 10 mM MgCl2, pH 7.9). All reactions were conducted in triplicate.

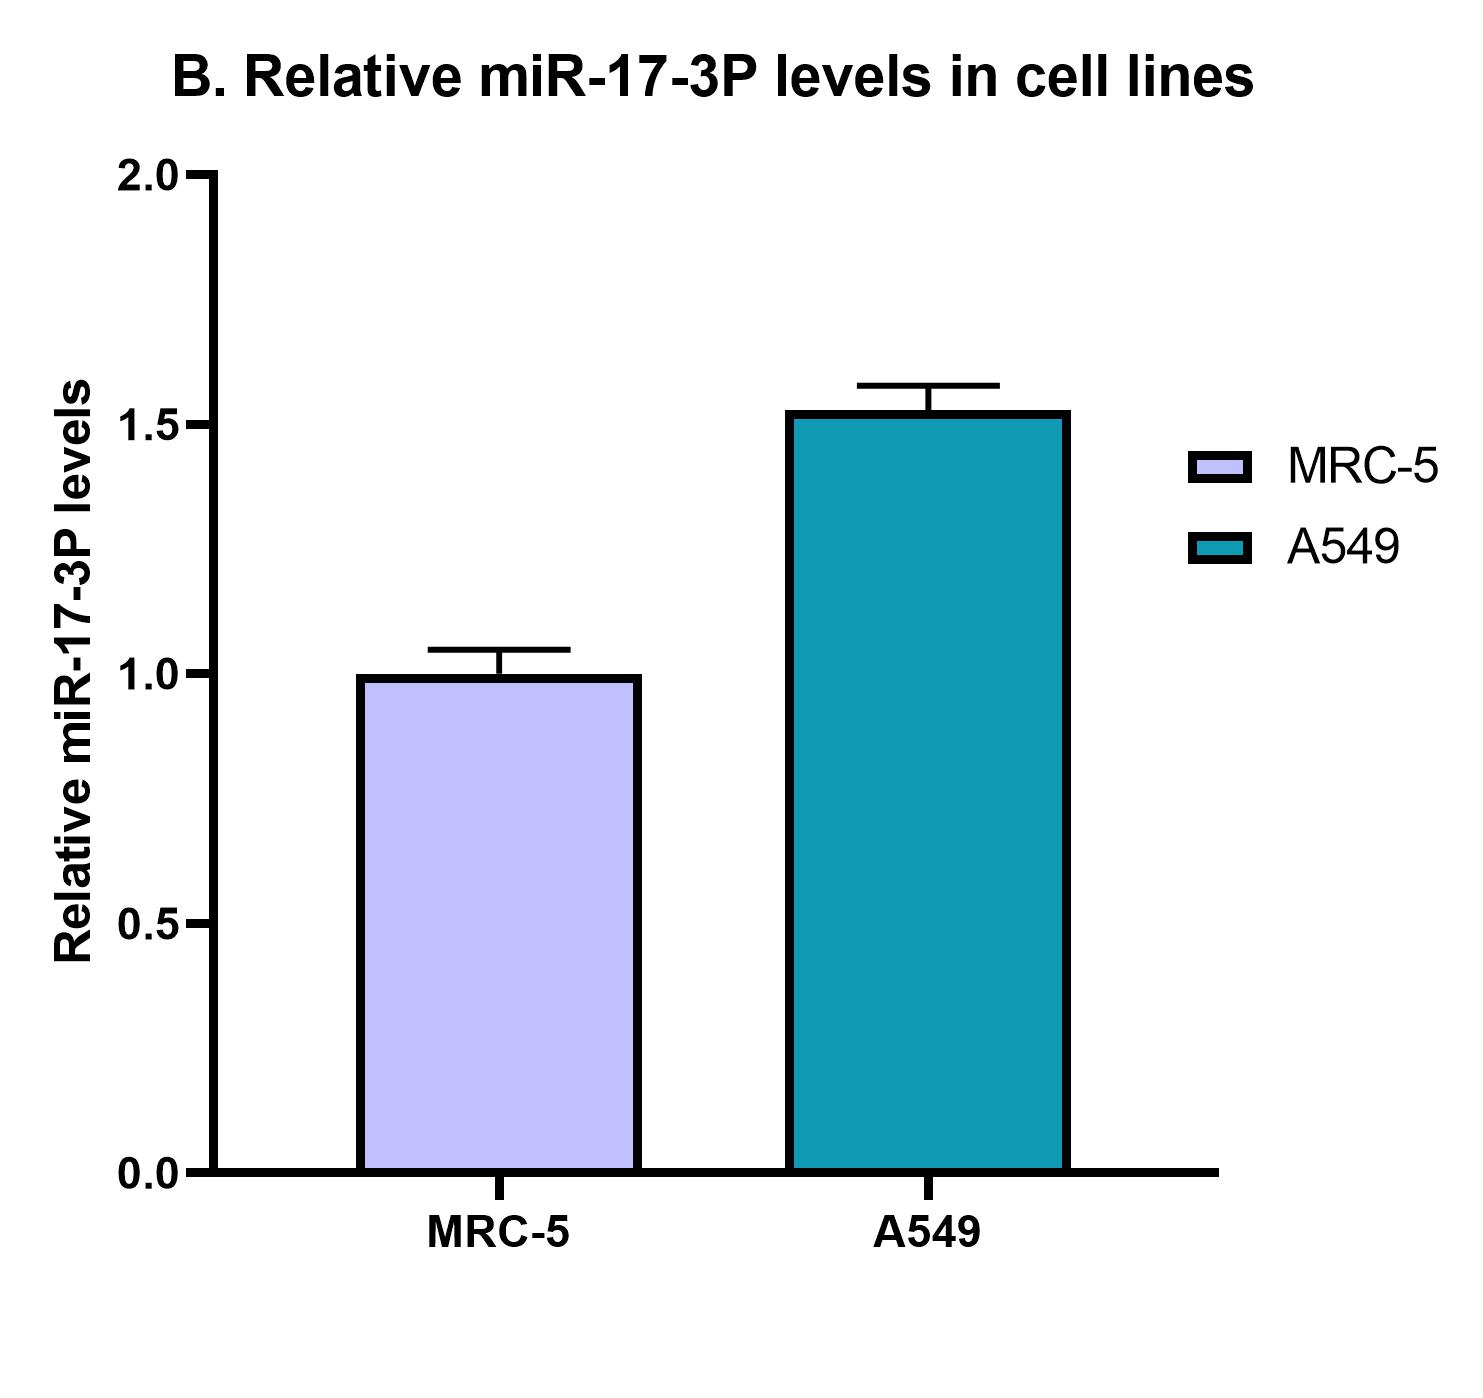
The results of the detection assay revealed that the miR-17-3P expression levels in A549 lung cancer cells are slightly elevated compared to MRC-5 normal cells.In addition, the positive control sample containing the same quantity of total RNA extract with the addition of a predefined concentration of miR-17-3P (spike-in) revealed an approximately 10 fold elevation in miR-17-3P detection levels compared to MRC-5 and A549 cells (Figure 22). Therefore, we can conclude that the detection platform’s performance is retained in this biological complex matrix (MRC-5 & A549 cells) which contains the target miRNA molecules in a pool of several RNA molecules including mRNAs, rRNAs, tRNAs, miRNAs, etc. The next of our experimental pipeline involves the verification of miR-17-3P elevated levels in A549 compared to MRC-5 with qPCR.
Sequence and Features
- 10COMPATIBLE WITH RFC[10]
- 12COMPATIBLE WITH RFC[12]
- 21INCOMPATIBLE WITH RFC[21]Illegal BglII site found at 1453
Illegal BglII site found at 5047 - 23COMPATIBLE WITH RFC[23]
- 25INCOMPATIBLE WITH RFC[25]Illegal NgoMIV site found at 1421
Illegal AgeI site found at 1910
Illegal AgeI site found at 3125 - 1000COMPATIBLE WITH RFC[1000]
Citations
1. Butt, T., Edavettal, S., Hall, J. and Mattern, M., (2005) "SUMO fusion technology for difficult-to-express proteins." Protein Expression and Purification, 43(1), pp.1-9.
2. Damalas, S., Batianis, C., Martin-Pascual, M., Lorenzo, V. and Martins dos Santos, V., (2020) "SEVA 3.1: enabling interoperability of DNA assembly among the SEVA, BioBricks and Type IIS restriction enzyme standards." Microbial Biotechnology, 13(6), pp.1793-1806.
3. Florczuk, M., Szpechcinski, A., & Chorostowska-Wynimko, J., (2017) "miRNAs as Biomarkers and Therapeutic Targets in Non-Small Cell Lung Cancer: Current Perspectives." Targeted Oncology, 12(2), 179-200.
4. Kaminski, M., Abudayyeh, O., Gootenberg, J., Zhang, F. and Collins, J., (2021) "CRISPR-based diagnostics." Nature Biomedical Engineering, 5(7), pp.643-656.
5. Liponska, A., Ousalem, F., Aalberts, D., Hunt, J. and Boel, G., (2018) "The new strategies to overcome challenges in protein production in bacteria." Microbial Biotechnology, 12(1), pp.44-47.
6. Liu, L., Li, X., Ma, J., Li, Z., You, L., Wang, J., Wang, M., Zhang, X.and Wang, Y., (2017) "The Molecular Architecture for RNA - Guided RNA Cleavage by Cas13a." Cell, 170(4), pp .714 - 726.e10.2.
7. Merom, D. and John, J., (2019) "Measurement Issues in Quantitative Research." Handbook of Research Methods in Health Social Sciences, pp.663-679
8. Panavas, T., Sanders, C. and Butt, T., (2009) "SUMO Fusion Technology for Enhanced Protein Production in Prokaryotic and Eukaryotic Expression Systems." Methods in Molecular Biology, pp.303-317.
9. Rath, D., Amlinger, L., Rath, A. and Lundgren, M., (2015) "The CRISPR-Cas immune system: Biology, mechanisms and applications." Biochimie, 117, pp.119-128.
10. Shan, Y., Zhou, X., Huang, R.and Xing, D., (2019) "High - Fidelity and Rapid Quantification of miRNA Combining crRNA Programmability and CRISPR / Cas13a trans - Cleavage Activity." Analytical Chemistry, 91(8), pp .5278 - 5285. 3.
11. Wang, B., Zhang, T., Yin, J., Yu, Y., Xu, W., Ding, J., Patel, D. and Yang, H., (2021) "Structural basis for self-cleavage prevention by tag:anti-tag pairing complementarity in type VI Cas13 CRISPR systems." Molecular Cell, 81(5), pp.1100-1115.e5
12. Zhang, C., Konermann, S., Brideau, N., Lotfy, P., Wu, X., Novick, S., Strutzenberg, T., Griffin, P., Hsu, P.and Lyumkis, D., (2018) "Structural Basis for the RNA - Guided Ribonuclease Activity of CRISPR - Cas13d." Cell, 175(1), pp .212 - 223.e17.

