Difference between revisions of "Part:BBa K4235012"
| (One intermediate revision by the same user not shown) | |||
| Line 2: | Line 2: | ||
__NOTOC__ | __NOTOC__ | ||
<partinfo>BBa_K4235012 short</partinfo> | <partinfo>BBa_K4235012 short</partinfo> | ||
| − | [[Image:lac.jpg| | + | [[Image:lac.jpg|500px|center|]] |
===Usage and biology=== | ===Usage and biology=== | ||
This T7 promoter is part of the Protein S expression circuit <partinfo>BBa_K4235030</partinfo> which was generated by cloning our insert <partinfo>BBa_K4235011</partinfo> into the vector <partinfo>BBa_K4235016</partinfo> using LIC protocol. | This T7 promoter is part of the Protein S expression circuit <partinfo>BBa_K4235030</partinfo> which was generated by cloning our insert <partinfo>BBa_K4235011</partinfo> into the vector <partinfo>BBa_K4235016</partinfo> using LIC protocol. | ||
Latest revision as of 23:22, 22 September 2022
T7 promoter
Usage and biology
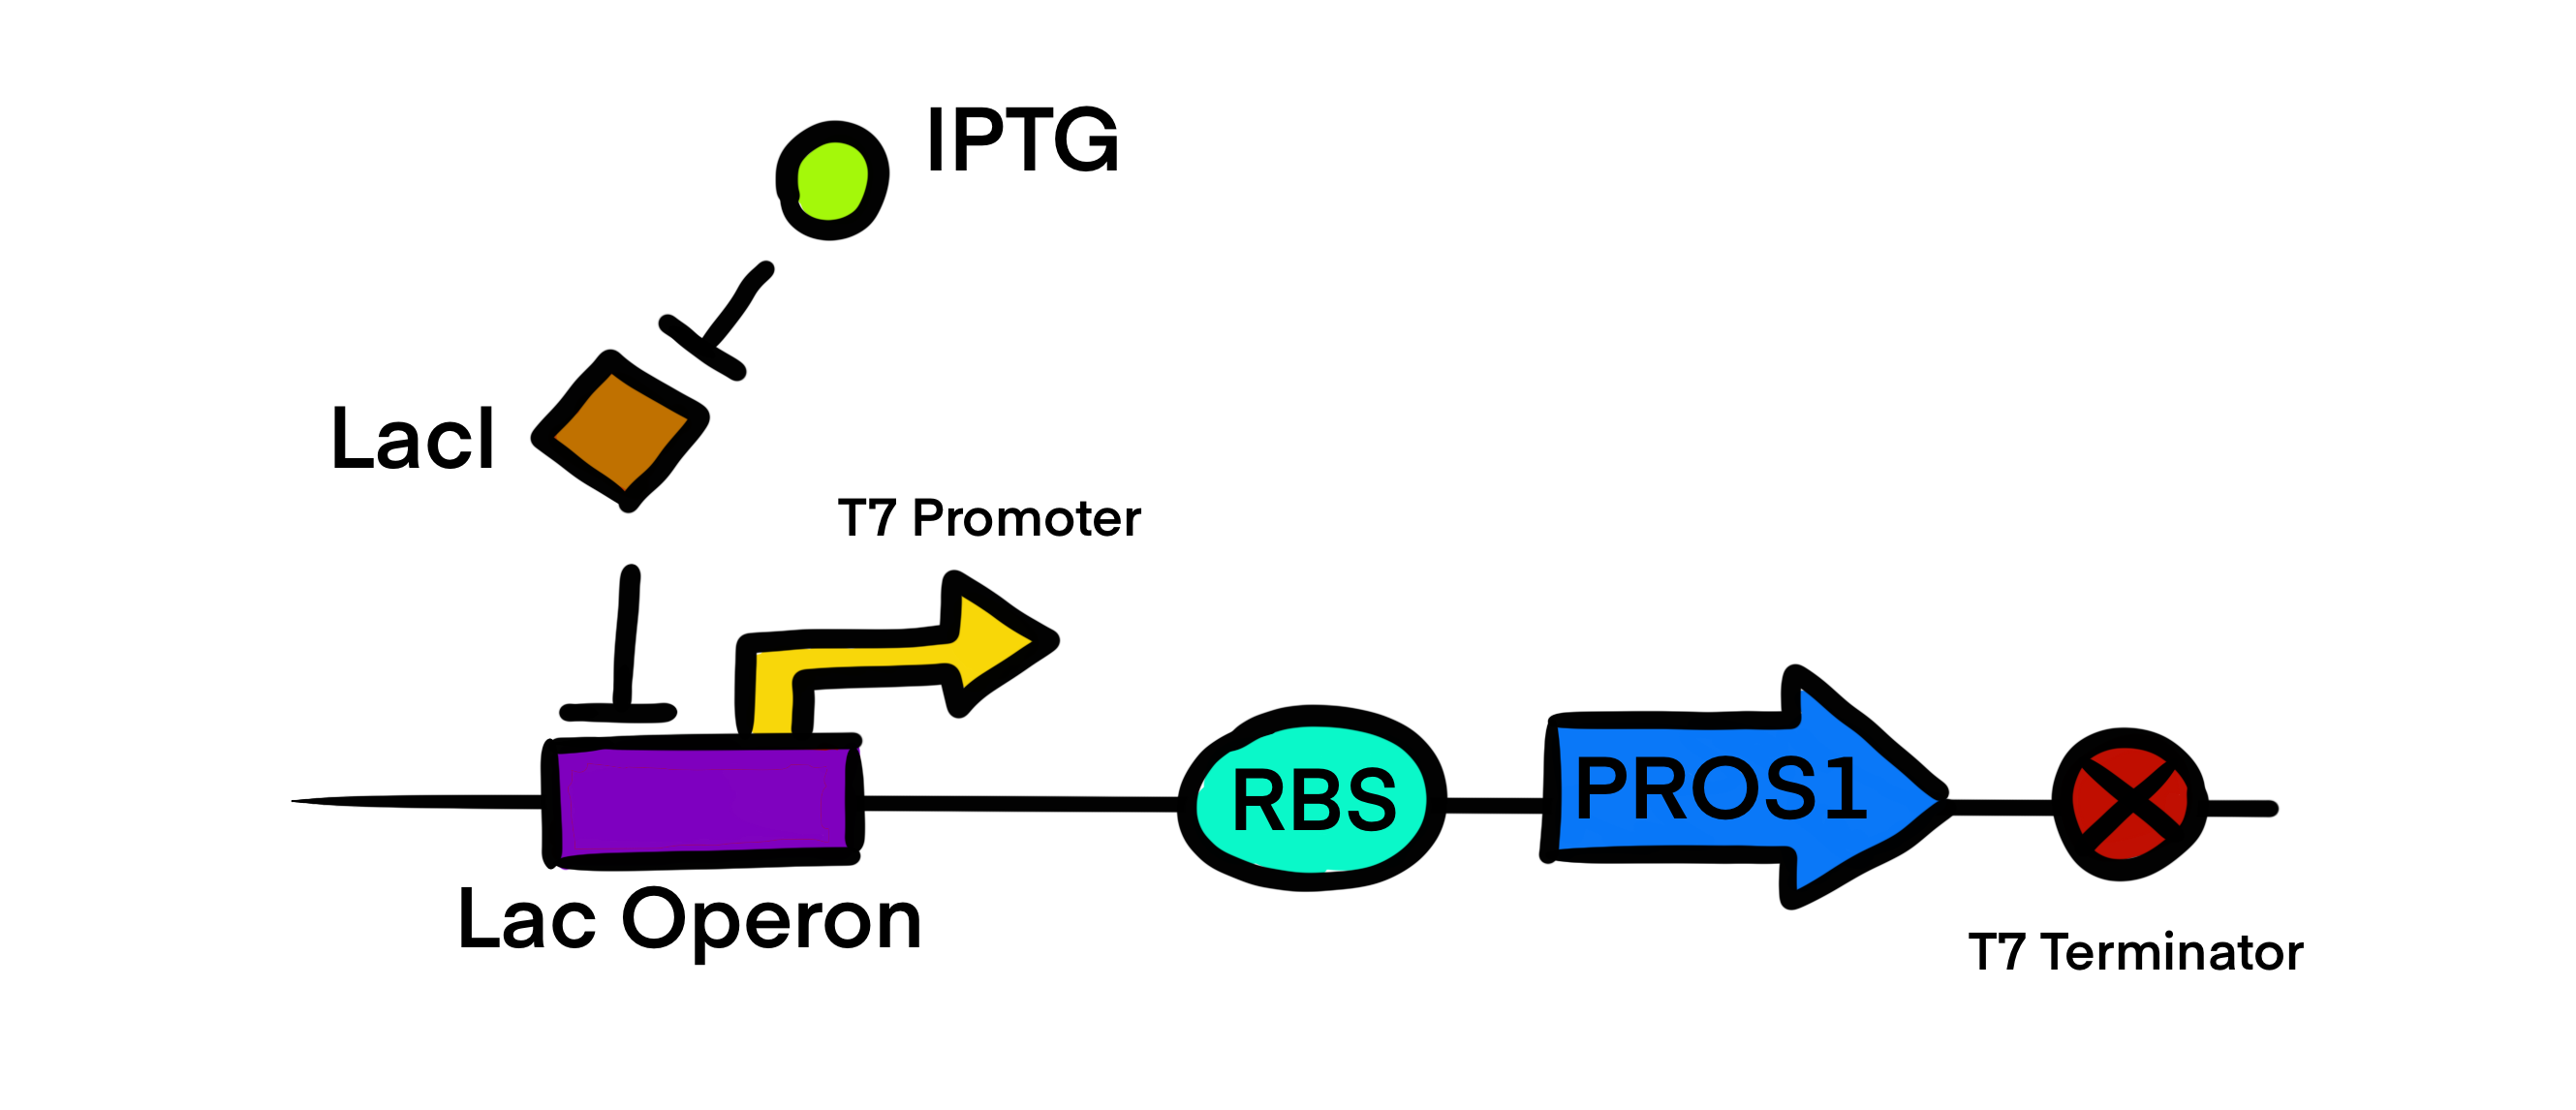
This T7 promoter is part of the Protein S expression circuit BBa_K4235030 which was generated by cloning our insert BBa_K4235011 into the vector BBa_K4235016 using LIC protocol. T7 promoter regulatory gene circuit employs transcriptional control by a repressor protein. The lac operon circuit consists of an operator site in the promoter region, to which the lacI repressor protein can bind and establish transcriptional repression. For initiating transcription, an inducer must bind to the lac repressor protein (lacI) which prevents the repressor from binding to the operator. The T7 promoter is induced using IPTG, which mimics allolactose and binds the lac repressor protein, allowing for the T7 RNA polymerase to bind to the promoter and induce transcription of the downstream gene sequence.
Mathematical modeling
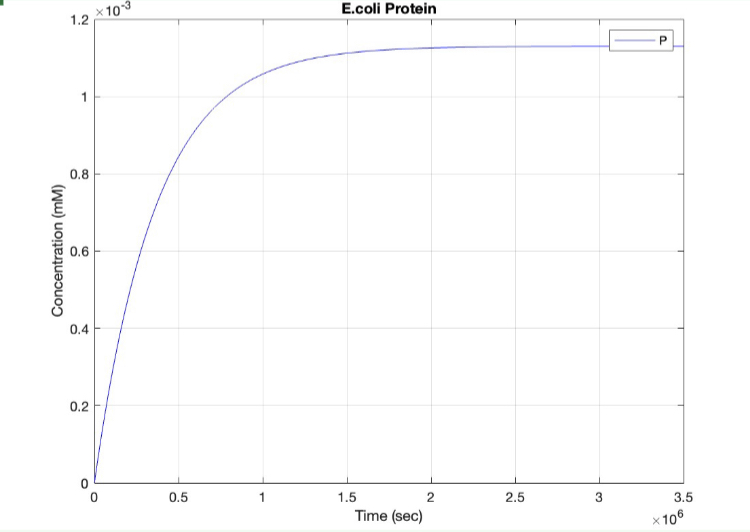
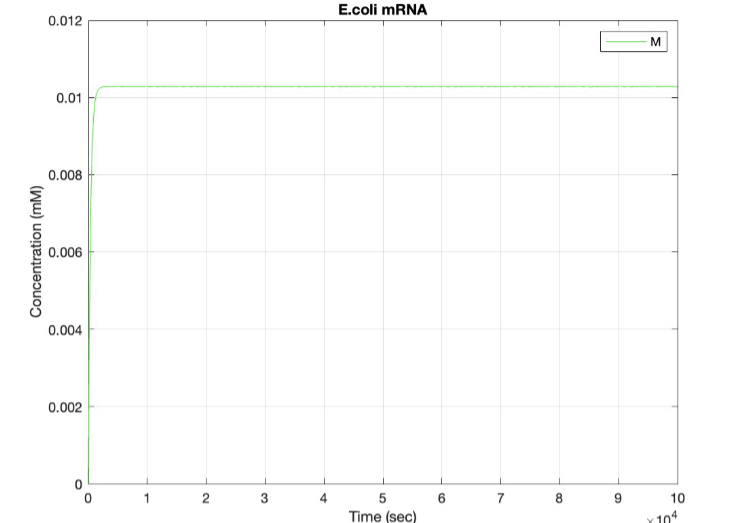
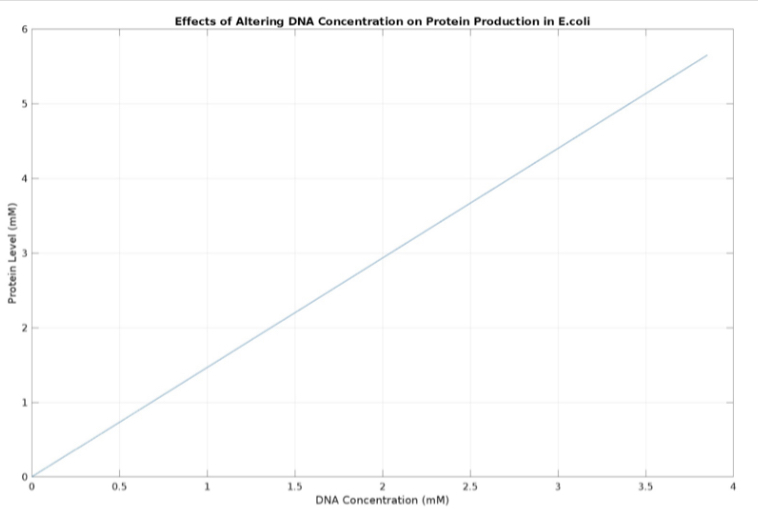
We used MATLAB simulations to model our genetic circuits. We used a system of ODEs derived for both constitutive and regulatory genetic circuits(IPTG inducible lac operon) for our E coli expression system. We were able to input our system of ODE’s into MATLAB to predict our steady state concentrations prior to starting wet lab in order to determine the process that would yield more favorable results. Those plots can be found below:
E coli constitutive gene circuit model:
(1.) Protein vs time:
(2.) mRNA vs time:
(3.) Effects of altering DNA concentration on protein production:
Sequence and Features
- 10COMPATIBLE WITH RFC[10]
- 12COMPATIBLE WITH RFC[12]
- 21COMPATIBLE WITH RFC[21]
- 23COMPATIBLE WITH RFC[23]
- 25COMPATIBLE WITH RFC[25]
- 1000COMPATIBLE WITH RFC[1000]


