Difference between revisions of "Part:BBa K3136004"
(→Improvement) |
(→Variation of fluorescence intensity with the concentration of oligo DNA) |
||
| (4 intermediate revisions by 3 users not shown) | |||
| Line 12: | Line 12: | ||
Different Function | Different Function | ||
First of all, we aim to detect different organisms for different illnesses. The old part is used to detect the African Swine fever virus (ASFV). Our new part is used to detect the presence of Listeria monocytogenes, which is easily survival in low temperature like refrigerator environment, and then cause Listeriosis illness, like fever, muscle ache, and so on. | First of all, we aim to detect different organisms for different illnesses. The old part is used to detect the African Swine fever virus (ASFV). Our new part is used to detect the presence of Listeria monocytogenes, which is easily survival in low temperature like refrigerator environment, and then cause Listeriosis illness, like fever, muscle ache, and so on. | ||
| + | [[File:T--SHSID-BBa K3521001 Fig 7.png|600px|thumb|center| ]] | ||
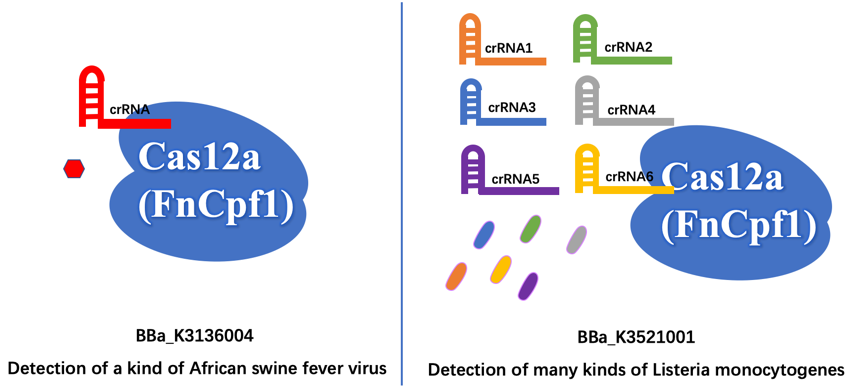
Furthermore, the old part only designed a crRNA that just targeting a site of ASFV, which may have less wide application. In contrast, we design six different crRNAs that can guide our improved Cas12a (FnCpf1) protein targeting six different genomic sites of Listeria monocytogenes, so that our new part can detect more extensive Listeria monocytogenes. | Furthermore, the old part only designed a crRNA that just targeting a site of ASFV, which may have less wide application. In contrast, we design six different crRNAs that can guide our improved Cas12a (FnCpf1) protein targeting six different genomic sites of Listeria monocytogenes, so that our new part can detect more extensive Listeria monocytogenes. | ||
| + | |||
| + | ===Biology and Contribution=== | ||
| + | Our new part is used to detect the presence of Listeria monocytogenes, which is easily survival in low temperature like refrigerator environment,and then cause Listeriosis illness, like fever, muscle ache, and so on. | ||
| + | |||
| + | |||
| + | ===Engineering Success=== | ||
| + | The FnCpf1 (BBa_K3521001) was designed to function as the core part in constructing a reaction system consisting of recombinant FnCpf1, crRNA, and ssDNA, aiming at detecting Listeria monocytogenes. | ||
| + | |||
| + | Recombinant FnCpf1 production, purification, and SDS-PAGE analysis. | ||
| + | To date, two FnCpf1 related parts (BBa_K2003000 and BBa_K3228100) were registered in the part system. The nucleotide sequences of BBa_K3521001 is different from that of BBa_K2003000 and BBa_K3228100 (Figure 1). The amino acid sequences of the three FnCpf1 are almost identical except for a single amino acid variant at residue 242 (isoleucine in BBa_K3521001 and leucine in BBa_K2003000 and BBa_K3228100) (Figure 2). | ||
| + | [[File:T--SHISID-BBa_K3521001 Fig 1.png|400px|thumb|center|Figure 1. Nucleotide sequence alignment of FnCpf1 in BBa_K3521001, BBa_K2003000, and BBa_K3228100.]] | ||
| + | [[File:T--SHSID-BBa_K3521001 Fig 2.jpg|400px|thumb|center|Figure 2. Amino acid sequence alignment of FnCpf1 in BBa_K3521001, BBa_K2003000, and BBa_K3228100. The variant amino acid residue is indicated by asterisk.]] | ||
| + | |||
| + | In combination with T7 promoter, single RNA-guided endonuclease FnCpf1, and polyhistidine tag, the FnCpf1 BBa_K3521001 was used to construct a composite part BBa_K3521005 to detect Listeria monocytogenes. The N-terminal His tag was used to Ni-affinity purification of FnCpf1. | ||
| + | |||
| + | Following are the results of functional tests of our reaction system: | ||
| + | The reaction system was incubated at 37℃ for 10 minutes then the value of fluorescence intensity was measured by microplate reader. The model number of our microplate reader is MD Spectra Max i3x with emission wavelength at 522nm and absorbing wavelength at 494nm. | ||
| + | |||
| + | The results of fluorescence intensity for all the six oligo sequences which simulated Listeria monocytogenes. are shown in Figure 3. The oligo DNA 16s RNA-2, actA-1 and hylA-1 are the only ones show distinct fluorescence intensity at different concentrations. At the same time, they show a ubiquitous rising trend of fluorescence intensity with an increasing concentration, which is consistent with logic. Therefore, we choose to give a more detailed and specific analysis to these three groups. The results of our further analysis are presented in Figures 4 - 6. | ||
| + | [[File:T--SHSID-BBa_K3521001 Fig 3.jpg|400px|thumb|center|Figure 3. The fluorescence intensity of different oligo DNAs and their respective concentrations.]] | ||
| + | The fluorescence intensity all display an increasing trend when the concentration of oligo DNA increases in Figures 4 - 6. The system can detect the oligo sequence at a concentration as low as 0.56 pM. | ||
| + | [[File:T--SHSID-BBa_K3521005 Fig 3.jpg|400px|thumb|center|Figure 4 The fluorescence intensity corresponding to four different concentrations of 16s RNA-2 oligo DNA]] | ||
| + | As shown in Figure 4, when 16s RNA-2 is used as the oligo sequence, the fluorescence intensity is positively related to oligo concentrations. When the concentration of oligo DNA increases from 0.56 pM to 2.25 pM, the fluorescence intensity increases drastically from 7.82x10⁵ to 9.61 x10⁵. | ||
| + | [[File:T--SHSID-BBa_K3521005 Fig 4.jpg|400px|thumb|center|Figure 5. The fluorescence intensity corresponding to four different concentrations of actA-1 oligo DNA.]] | ||
| + | Figure 5 demonstrates the increasing trend of fluorescence intensity according to an increase in the concentration of actA-1. The trend follows a generally linear line with intensity being 8.90 x 10⁵ at a concentration of 1.12 pM and 9.48 x 10⁵ at 2.25 pM. | ||
| + | [[File:T--SHSID-BBa_K3521005 Fig 5.jpg|400px|thumb|center|Figure 6 The fluorescence intensity corresponding to four different concentrations of hlyA-1 oligo DNA.]] | ||
| + | In figure 6, the data points of the graph resemble a linear progression. The fluorescence intensity is 8.46 x 10⁵ when the concentration of oligo DNA is 0.56 pM, the lowest concentration we tested. The fluorescence intensity is the highest corresponding to the lowest concentration of oligo DNA among all three samples. After this, the fluorescence intensity is 9.08 x 10⁵ and1.04 x 106 when the concentration of hlyA-1 is 1.12 pM and 2.25 pM. | ||
| + | At both low and high concentrations, its fluorescence intensity can be used to compare the concentrations of Listeria monocytogenes oligo DNA using the FnCpf1 system. The fluorescence intensity difference between different oligo DNAs demonstrates the highest efficiency for hylA-1 detection among all three samples. | ||
| + | |||
| + | The experiment results above provided us with the evidence that our detection system of Listeria monocytogenes functions as expected. | ||
| + | |||
-------------------------------------------------------------------------------------------------- | -------------------------------------------------------------------------------------------------- | ||
| Line 65: | Line 97: | ||
==Reference== | ==Reference== | ||
<p>Li S Y, Cheng Q X, Liu J K, et al. CRISPR-Cas12a has both cis-and trans-cleavage activities on single-stranded DNA[J]. Cell research, 2018, 28(4): 491.</p> | <p>Li S Y, Cheng Q X, Liu J K, et al. CRISPR-Cas12a has both cis-and trans-cleavage activities on single-stranded DNA[J]. Cell research, 2018, 28(4): 491.</p> | ||
| + | |||
| + | ==Improvement by 2022 YkPaO == | ||
| + | |||
| + | In order to improve the efficiency of gene editing by cas12a protein, we carried out codon optimization on the gene sequence of cas12a in the E. coli system based on the previous work. Through sequence comparison. Through codon optimization, the CAI value is increased from the previous 0.4 to the current 0.81; the GC content is increased from the previous 30.1% to the current 42.98%we can see that the optimized cas12a protein is more suitable for Expression in the E. coli system also demonstrated that codon optimization improved the efficiency of cas12a recognition and cleavage of oligonucleotides. | ||
| + | |||
| + | [[File:T-- YkPaO--BBa K4304002-figure5.png|500px|thumb|center|Figure 5. Comparison of codon optimization results of cas12a]] | ||
| + | |||
| + | ===Variation of fluorescence intensity with the concentration of oligo DNA=== | ||
| + | To assess if our Cas12a-based system worked well, we designed a reporter system by ligating a 6-FAM at the 5’ terminal of the target DNA probes. Then we measured the fluorescence intensity using SpectraMax i3x Multi-Mode Microplate Reader every time the oligo DNA concentration increased, with the excitation of 485nm and emission wavelength of 507nm. | ||
| + | |||
| + | [[File:T-- YkPaO--BBa K4304002-figure6.jpg|500px|thumb|center|Figure 6. Fluorescence intensity at different concentrations of oligo DNA in simulated bacteria.NC = negative control]] | ||
| + | |||
| + | |||
| + | |||
| + | The time between oligo DNA mixed with Cas12a protein and sgRNA system and measuring a sharp change in fluorescence intensity within 10 minutes. As shown in the graph, as the concentration of oligo DNA increased from 0 ng/L to 4 ng/L, the fluorescence intensity of the ssDNA fluorescent probes of the ipaH, invA, cagA, and 16S systems also increased significantly. The fluorescence intensity of a system with higher oligo DNA concentration is always higher than the fluorescence intensity of a system with lower oligo DNA concentration. Also, our results showed that the fluorescence intensity of the oligo DNA represent group is similar to or higher than the negative control (Figure 6). | ||
| + | |||
| + | After our experimental optimization, compared with the similar experimental results uploaded by Group: iGEM19_Shanghai_HS_United (2019-09-18) in the iGEM library, the number is Part: BBa_K3136004, which is a great improvement, which also highlights the advantages of our experimental scheme. | ||
| + | |||
| + | Thus, the results indicate that our fluorescent detection experiment is successful. Cas12a protein and sgRNA can recognize and cut the oligo DNA probes and the fluorescence emission can be detected. | ||
| + | |||
| + | == Cas12a == | ||
| + | |||
| + | ==Contribution== | ||
| + | Based on CRISPR pathogenic microbial detection technology was developed in recent years, and was applied to a series of pathogenic microorganism detection, and the DETECTR system is based on Cas12a, and once the target DNA-specific sgRNA is detected, the Cas12a’s endonuclease activity would be activated and cleave both the target and non-target genes. In order to verify if there are related parts, we searched the iGEM Biological Parts library and picked BBa_K3136004. This is a biologic part submitted by iGEM19_Shanghai_HS_United in 2019, and the team provided a complete reaction system to detect the presence of Listeria monocytogenes. Our team developed a similar reaction platform to detect pathogenic microorganisms, such as Helicobacter Pylori, salmonella, and shigella, adding data from in vitro DETECTR reaction system. | ||
| + | |||
| + | What’s more, once the endonuclease activity of FnCas12a was activated, this protein could also cut the non-target DNA fragments. Based on this phenomenon, we employed DNA probes with the 6-FAM flag on its 5’-terminal. When there was sgRNAs of target genes were recognized by FnCas12a, the probes would also be cleaved, then we could detect the fluorescence. | ||
| + | |||
| + | We synthesized four DNA fragments amplified from the pathogenic microorganisms we chose, and insert them in the pUC57 vector. Next, we purified the FnCas12a protein and synthesized probes with the 6-FAM flag. Then, we mixed those materials and the reaction buffer to develop the in vitro reaction system, and we also changed the concentration of the target genes. Finally, we detected the fluorescence of the reaction system and measured the activity of FnCas12a (Figure 1). | ||
| + | [[File:T-- YkPaO--BBa K4304002-figure1.jpg|500px|thumb|center| Figure 1. The workflow of our project.]] | ||
| + | |||
| + | ==Engineering Success == | ||
| + | |||
| + | FnCas12a, which is amplified from Francisella novicida, is a new class II family of CRISPR-Cas RNA-programmable endonucleases with unique features that make it a very attractive alternative or complement to Cas9 for genome engineering. | ||
| + | |||
| + | a) Construction of pathogenic micro-organisms expression plasmids | ||
| + | |||
| + | We designed 5 plasmids: the FnCas12 protein expression plasmid, 16S, cagA, ipaH, and invA expression plasmids. Among them, the DNA fragments 16S and cagA are amplified from the genome of Helicobacter Pylori, and the gene fragments ipaH and invA are amplified from salmonella and shigella genomic DNA respectively. | ||
| + | |||
| + | In order to construct our plasmids, we let the company synthesize the DNA fragments, FnCas12 was inserted into the pET28a vector, and the fragments 16S, cagA, ipaH, and invA were inserted into the pUC57 vector. The constructed plasmids were contained in E. coli strains, we streak inoculated them on LB solid medium plates containing corresponding antibiotics, and incubate them at 37℃ overnight. | ||
| + | |||
| + | b) Verification of the microorganisms expression plasmids | ||
| + | |||
| + | We used TAE agarose gel electrophoresis to testify the presence of oligo DNA in the plasmid by performing PCR and then doing gel electrophoresis of the amplicons (Figure 2). | ||
| + | [[File:T-- YkPaO--BBa K4304002-figure2.jpg|500px|thumb|center|Figure 2. Gel electrophoresis to verify the construction of oligo DNA containing plasmids.]] | ||
| + | |||
| + | Our results show that a band of 200bp to 400bp is present in cagA, 16S, invA, and ipaH, but not in negative control (NC) lanes. Because oligo DNA has a size between 200bp to 400bp, our result supports the fact that the plasmids contain desired oligo DNA. The four plasmid transformations were successful. | ||
| + | |||
| + | === Expression and purification of Cas12a protein=== | ||
| + | |||
| + | We transformed the pET28a-FnCas12a expression plasmid into E. coli BL21(DE3) competent cells, and cultured at 37℃ overnight (Figure 1A). we inoculated a single colony into LB (Kana+) culture medium, incubated overnight, and then transferred the cultured medium into 1L fresh LB (Kana+) culture medium. We induced the expression of FnCas12a with IPTG when the OD600 was around 0.6-1.0, and cultured at 16℃ for 12h. Subsequently, we used nickel affinity purification to purify the acquired Cas12a proteins from other proteins in E. coli (Figure 1B). | ||
| + | [[File:T--YkPaO--BBa K4304007-figure1.jpg|500px|thumb|center|Figure 3. Expression and purification of protein FnCas12a.A. Incubate the plasmid pET28a-FnCas12a containing BL21(DE3). | ||
| + | B. SDS-PAGE electrophoresis gel of Cas12a protein compared to nonspecific protein impurities. | ||
| + | ]] | ||
| + | |||
| + | ===Bicinchoninic Acid Assay (BCA)=== | ||
| + | Cas12a protein has a size of 130kDa. The SDS-PAGE electrophoresis result indicates that the Cas12a protein is present in the solution we collected at 130kDa, and not present in the nonspecific protein impurities. Thus, Cas12a proteins were expressed and purified with high quality. | ||
| + | |||
| + | Then, we tested the concentration of Cas12a protein by Bicinchoninic Acid Assay (BCA), using SpectraMax i3x Multi-Mode Microplate Reader with the absorption peak at 562nm (Figure 2). | ||
| + | [[File:T--YkPaO--BBa K4304007-figure2.jpg|500px|thumb|center|Figure 4. BCA method standard linear regression line for calculation of protein concentration.]] | ||
| + | |||
| + | Table 1. Absorbance and calculated protein concentration of Cas12a 1 and Cas12a 2. | ||
| + | [[File:T-- YkPaO--BBa K4304002-figure11.jpg]] | ||
| + | |||
| + | With this BCA standard curve, we measured the concentration of two samples of Cas12a protein, they are 10.9 µg/mL and 7.32 µg/mL respectively. This result indicated that we obtained a sufficient concentration of Cas12a protein. | ||
| + | |||
Latest revision as of 15:28, 12 October 2022
FnCas12a-typeIIS
It is a conding sequence of CRISPR-Cas12a from Francisella novicida U112. The sequence is coden optimized.
Improvement by SHSID 2020
Sequence Analysis We blast the sequences of our new part BBa_K3521001 and the existing part BBa_K3136004. As shown in the figure, there is 2852bp inconsistent good, 1058bp inconsistent bad from the old one part.
Different Function First of all, we aim to detect different organisms for different illnesses. The old part is used to detect the African Swine fever virus (ASFV). Our new part is used to detect the presence of Listeria monocytogenes, which is easily survival in low temperature like refrigerator environment, and then cause Listeriosis illness, like fever, muscle ache, and so on.
Furthermore, the old part only designed a crRNA that just targeting a site of ASFV, which may have less wide application. In contrast, we design six different crRNAs that can guide our improved Cas12a (FnCpf1) protein targeting six different genomic sites of Listeria monocytogenes, so that our new part can detect more extensive Listeria monocytogenes.
Biology and Contribution
Our new part is used to detect the presence of Listeria monocytogenes, which is easily survival in low temperature like refrigerator environment,and then cause Listeriosis illness, like fever, muscle ache, and so on.
Engineering Success
The FnCpf1 (BBa_K3521001) was designed to function as the core part in constructing a reaction system consisting of recombinant FnCpf1, crRNA, and ssDNA, aiming at detecting Listeria monocytogenes.
Recombinant FnCpf1 production, purification, and SDS-PAGE analysis. To date, two FnCpf1 related parts (BBa_K2003000 and BBa_K3228100) were registered in the part system. The nucleotide sequences of BBa_K3521001 is different from that of BBa_K2003000 and BBa_K3228100 (Figure 1). The amino acid sequences of the three FnCpf1 are almost identical except for a single amino acid variant at residue 242 (isoleucine in BBa_K3521001 and leucine in BBa_K2003000 and BBa_K3228100) (Figure 2).
In combination with T7 promoter, single RNA-guided endonuclease FnCpf1, and polyhistidine tag, the FnCpf1 BBa_K3521001 was used to construct a composite part BBa_K3521005 to detect Listeria monocytogenes. The N-terminal His tag was used to Ni-affinity purification of FnCpf1.
Following are the results of functional tests of our reaction system: The reaction system was incubated at 37℃ for 10 minutes then the value of fluorescence intensity was measured by microplate reader. The model number of our microplate reader is MD Spectra Max i3x with emission wavelength at 522nm and absorbing wavelength at 494nm.
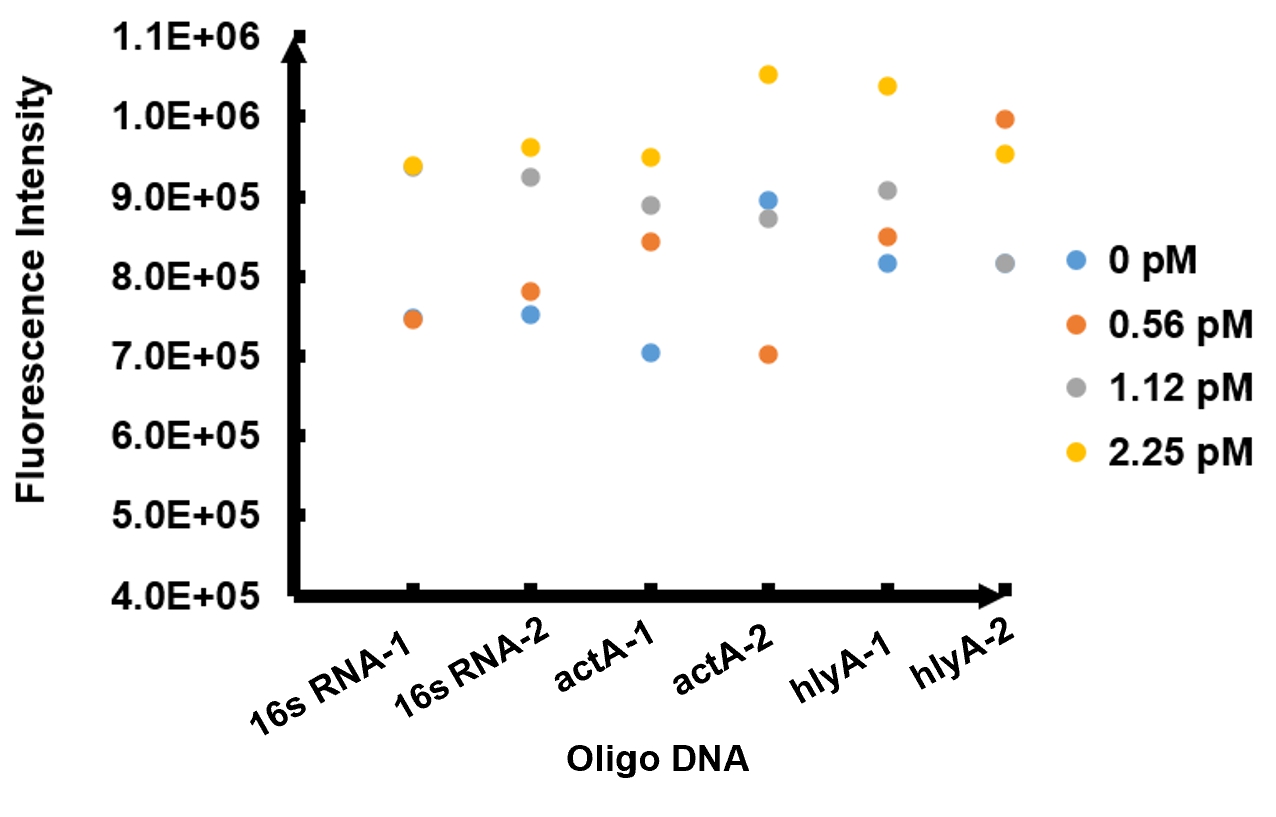
The results of fluorescence intensity for all the six oligo sequences which simulated Listeria monocytogenes. are shown in Figure 3. The oligo DNA 16s RNA-2, actA-1 and hylA-1 are the only ones show distinct fluorescence intensity at different concentrations. At the same time, they show a ubiquitous rising trend of fluorescence intensity with an increasing concentration, which is consistent with logic. Therefore, we choose to give a more detailed and specific analysis to these three groups. The results of our further analysis are presented in Figures 4 - 6.
The fluorescence intensity all display an increasing trend when the concentration of oligo DNA increases in Figures 4 - 6. The system can detect the oligo sequence at a concentration as low as 0.56 pM.
As shown in Figure 4, when 16s RNA-2 is used as the oligo sequence, the fluorescence intensity is positively related to oligo concentrations. When the concentration of oligo DNA increases from 0.56 pM to 2.25 pM, the fluorescence intensity increases drastically from 7.82x10⁵ to 9.61 x10⁵.
Figure 5 demonstrates the increasing trend of fluorescence intensity according to an increase in the concentration of actA-1. The trend follows a generally linear line with intensity being 8.90 x 10⁵ at a concentration of 1.12 pM and 9.48 x 10⁵ at 2.25 pM.
In figure 6, the data points of the graph resemble a linear progression. The fluorescence intensity is 8.46 x 10⁵ when the concentration of oligo DNA is 0.56 pM, the lowest concentration we tested. The fluorescence intensity is the highest corresponding to the lowest concentration of oligo DNA among all three samples. After this, the fluorescence intensity is 9.08 x 10⁵ and1.04 x 106 when the concentration of hlyA-1 is 1.12 pM and 2.25 pM. At both low and high concentrations, its fluorescence intensity can be used to compare the concentrations of Listeria monocytogenes oligo DNA using the FnCpf1 system. The fluorescence intensity difference between different oligo DNAs demonstrates the highest efficiency for hylA-1 detection among all three samples.
The experiment results above provided us with the evidence that our detection system of Listeria monocytogenes functions as expected.
Usage and Biology
BBa_K3136004 FnCas12a-typeIIS
Methods:
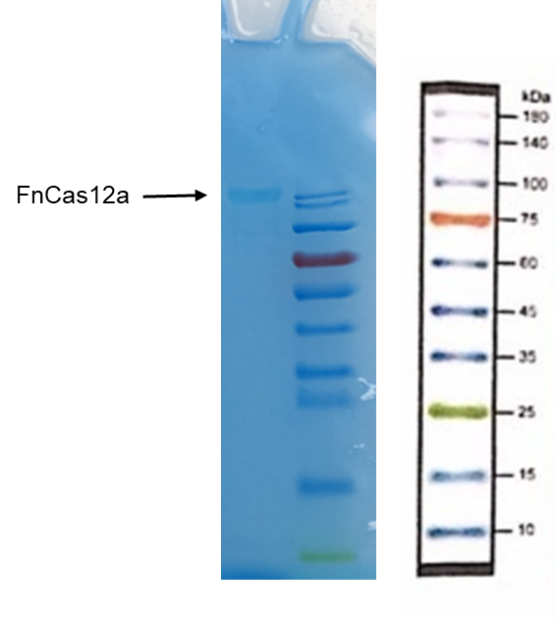
1. Put the EP tube containing purified FnCas12a protein at 99℃ water for 15 minutes.
2. After heating, centrifuge the tubes for 5min.
3. Take and install the gel, add the electrophoresis buffer to the sample hole, and check if there is any leakage. Add marker, to the first and last sample holes, add FnCas12a to the other sample holes, respectively.
7. Connect the electrophoresis device to the power supply. Connect the positive electrode to the tank and the negative electrode to the slot for electrophoresis. The voltage is adjusted to 160V.
8. Turn off the power supply and disconnect the electrode until the bromophenol blue reaches the bottom of the release adhesive. Remove the glass sheet from the electrophoresis device and then remove the gel.
9. Soak the gel in Coomassie brilliant blue dye and dye it in a horizontal shaking bed for 15 min.
Observe the protein bands
Cas12a detection method:
Materials:
Water. 14.5 μL
Buffer. 2 μL
Enzyme (Cas12a). 0.5 μL
Template. 0.5 μL
(From solution we made after LAMP)
Detector. 2 μL
crRNA. 0.5 μL
(Note: the Deteror is sequence of ssDNA HEX-N12-BHQ1 or FAM-N12-BHQ1 or FITC-T14-Biotin)
Procedure:
1. Add all the materials together:
• Firstly, use pipette to straw 14.5 μL pure water from the pure water bottle to one tube.
• Secondly, use pipette to straw 2 μL buffer to the previous tube.
• Thirdly, use pipette to straw 0.5 μL enzyme to the previous tube.
• Next, use pipette to straw 0.5 μL template to the previous tube.
• Then, add 0.5 μL crRNA to the previous tube.
• Finally, use pipette to straw 2 μL detector to the previous tube.
2. Straw 1 μL of the mixed solution in the tubes to the 96-well Plate.
3. Detect the solution using fluorescent detector machine to check the fluorescence when they react 10min.
Results:
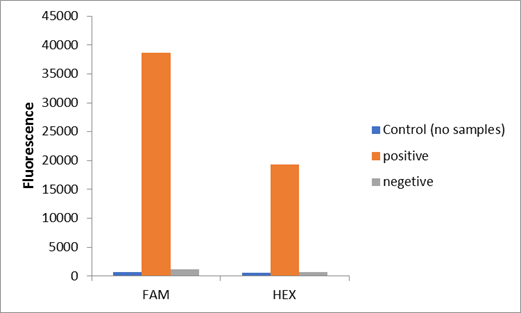
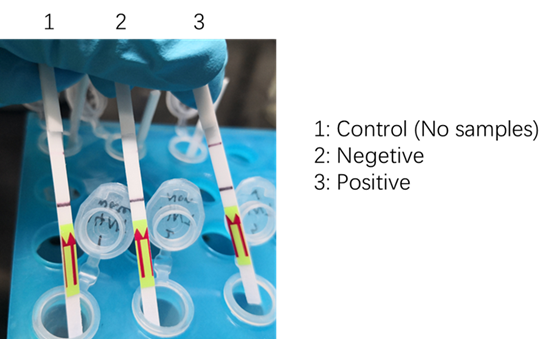
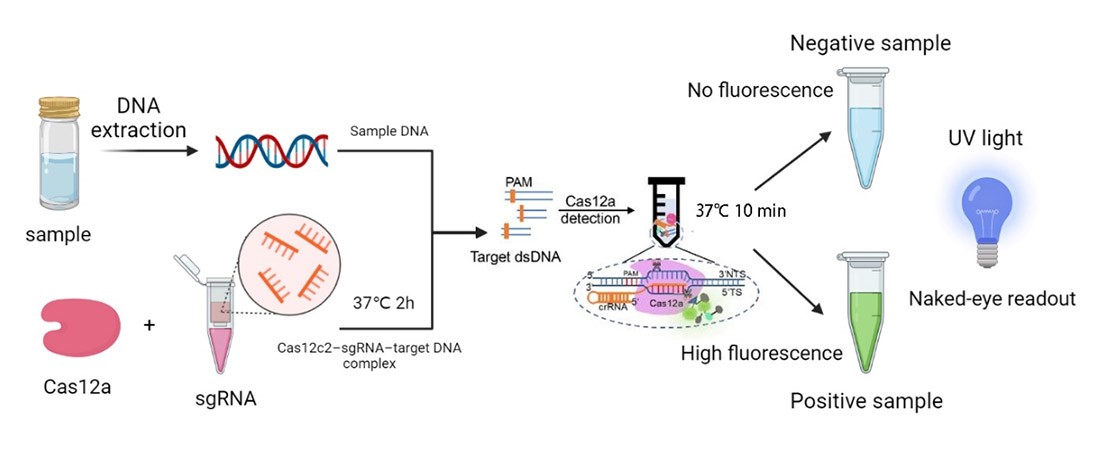
We used two types of fluorescent probe (FAM and HEX) to check the fluorescence of FnCas12a reaction system at 10min as shown in Fig1. Linked to the control and negative samples, the positive sample has a high fluorescence. It means that FnCas12a slices the fluorescent probe in the reaction system and the cracked fluorescent probe produce fluorescence. we also checked the fluorescence of FnCas12a reaction system at 10min by lateral flow using briDetect (Milenia Biotec GmbH) (Fig2).
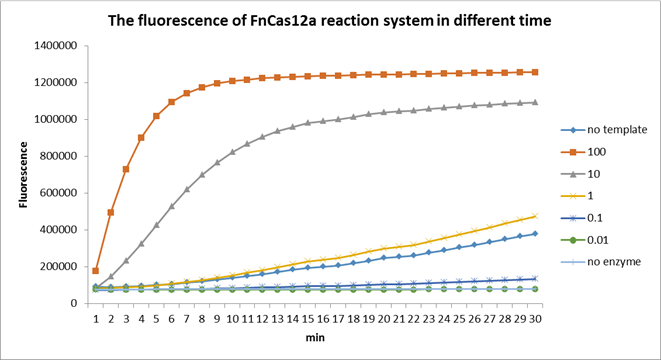
Using fluorescent detector machine, we can detect the fluorescence of FnCas12a reaction system at different time by setting up program properly in the machine. We detect the fluorescence under different concentration FnCas12a and different time(Fig3). With the time growth, the fluorescence gradually raised until a certain time. Higher concentration FnCas12a had higher fluorescence and the fluorescence increased quickly.
Reference
Li S Y, Cheng Q X, Liu J K, et al. CRISPR-Cas12a has both cis-and trans-cleavage activities on single-stranded DNA[J]. Cell research, 2018, 28(4): 491.
Improvement by 2022 YkPaO
In order to improve the efficiency of gene editing by cas12a protein, we carried out codon optimization on the gene sequence of cas12a in the E. coli system based on the previous work. Through sequence comparison. Through codon optimization, the CAI value is increased from the previous 0.4 to the current 0.81; the GC content is increased from the previous 30.1% to the current 42.98%we can see that the optimized cas12a protein is more suitable for Expression in the E. coli system also demonstrated that codon optimization improved the efficiency of cas12a recognition and cleavage of oligonucleotides.
Variation of fluorescence intensity with the concentration of oligo DNA
To assess if our Cas12a-based system worked well, we designed a reporter system by ligating a 6-FAM at the 5’ terminal of the target DNA probes. Then we measured the fluorescence intensity using SpectraMax i3x Multi-Mode Microplate Reader every time the oligo DNA concentration increased, with the excitation of 485nm and emission wavelength of 507nm.
The time between oligo DNA mixed with Cas12a protein and sgRNA system and measuring a sharp change in fluorescence intensity within 10 minutes. As shown in the graph, as the concentration of oligo DNA increased from 0 ng/L to 4 ng/L, the fluorescence intensity of the ssDNA fluorescent probes of the ipaH, invA, cagA, and 16S systems also increased significantly. The fluorescence intensity of a system with higher oligo DNA concentration is always higher than the fluorescence intensity of a system with lower oligo DNA concentration. Also, our results showed that the fluorescence intensity of the oligo DNA represent group is similar to or higher than the negative control (Figure 6).
After our experimental optimization, compared with the similar experimental results uploaded by Group: iGEM19_Shanghai_HS_United (2019-09-18) in the iGEM library, the number is Part: BBa_K3136004, which is a great improvement, which also highlights the advantages of our experimental scheme.
Thus, the results indicate that our fluorescent detection experiment is successful. Cas12a protein and sgRNA can recognize and cut the oligo DNA probes and the fluorescence emission can be detected.
Cas12a
Contribution
Based on CRISPR pathogenic microbial detection technology was developed in recent years, and was applied to a series of pathogenic microorganism detection, and the DETECTR system is based on Cas12a, and once the target DNA-specific sgRNA is detected, the Cas12a’s endonuclease activity would be activated and cleave both the target and non-target genes. In order to verify if there are related parts, we searched the iGEM Biological Parts library and picked BBa_K3136004. This is a biologic part submitted by iGEM19_Shanghai_HS_United in 2019, and the team provided a complete reaction system to detect the presence of Listeria monocytogenes. Our team developed a similar reaction platform to detect pathogenic microorganisms, such as Helicobacter Pylori, salmonella, and shigella, adding data from in vitro DETECTR reaction system.
What’s more, once the endonuclease activity of FnCas12a was activated, this protein could also cut the non-target DNA fragments. Based on this phenomenon, we employed DNA probes with the 6-FAM flag on its 5’-terminal. When there was sgRNAs of target genes were recognized by FnCas12a, the probes would also be cleaved, then we could detect the fluorescence.
We synthesized four DNA fragments amplified from the pathogenic microorganisms we chose, and insert them in the pUC57 vector. Next, we purified the FnCas12a protein and synthesized probes with the 6-FAM flag. Then, we mixed those materials and the reaction buffer to develop the in vitro reaction system, and we also changed the concentration of the target genes. Finally, we detected the fluorescence of the reaction system and measured the activity of FnCas12a (Figure 1).
Engineering Success
FnCas12a, which is amplified from Francisella novicida, is a new class II family of CRISPR-Cas RNA-programmable endonucleases with unique features that make it a very attractive alternative or complement to Cas9 for genome engineering.
a) Construction of pathogenic micro-organisms expression plasmids
We designed 5 plasmids: the FnCas12 protein expression plasmid, 16S, cagA, ipaH, and invA expression plasmids. Among them, the DNA fragments 16S and cagA are amplified from the genome of Helicobacter Pylori, and the gene fragments ipaH and invA are amplified from salmonella and shigella genomic DNA respectively.
In order to construct our plasmids, we let the company synthesize the DNA fragments, FnCas12 was inserted into the pET28a vector, and the fragments 16S, cagA, ipaH, and invA were inserted into the pUC57 vector. The constructed plasmids were contained in E. coli strains, we streak inoculated them on LB solid medium plates containing corresponding antibiotics, and incubate them at 37℃ overnight.
b) Verification of the microorganisms expression plasmids
We used TAE agarose gel electrophoresis to testify the presence of oligo DNA in the plasmid by performing PCR and then doing gel electrophoresis of the amplicons (Figure 2).
Our results show that a band of 200bp to 400bp is present in cagA, 16S, invA, and ipaH, but not in negative control (NC) lanes. Because oligo DNA has a size between 200bp to 400bp, our result supports the fact that the plasmids contain desired oligo DNA. The four plasmid transformations were successful.
Expression and purification of Cas12a protein
We transformed the pET28a-FnCas12a expression plasmid into E. coli BL21(DE3) competent cells, and cultured at 37℃ overnight (Figure 1A). we inoculated a single colony into LB (Kana+) culture medium, incubated overnight, and then transferred the cultured medium into 1L fresh LB (Kana+) culture medium. We induced the expression of FnCas12a with IPTG when the OD600 was around 0.6-1.0, and cultured at 16℃ for 12h. Subsequently, we used nickel affinity purification to purify the acquired Cas12a proteins from other proteins in E. coli (Figure 1B).
Bicinchoninic Acid Assay (BCA)
Cas12a protein has a size of 130kDa. The SDS-PAGE electrophoresis result indicates that the Cas12a protein is present in the solution we collected at 130kDa, and not present in the nonspecific protein impurities. Thus, Cas12a proteins were expressed and purified with high quality.
Then, we tested the concentration of Cas12a protein by Bicinchoninic Acid Assay (BCA), using SpectraMax i3x Multi-Mode Microplate Reader with the absorption peak at 562nm (Figure 2).
Table 1. Absorbance and calculated protein concentration of Cas12a 1 and Cas12a 2.

With this BCA standard curve, we measured the concentration of two samples of Cas12a protein, they are 10.9 µg/mL and 7.32 µg/mL respectively. This result indicated that we obtained a sufficient concentration of Cas12a protein.
Sequence and Features
- 10INCOMPATIBLE WITH RFC[10]Illegal PstI site found at 310
Illegal PstI site found at 364
Illegal PstI site found at 1627
Illegal PstI site found at 2533
Illegal PstI site found at 3727 - 12INCOMPATIBLE WITH RFC[12]Illegal PstI site found at 310
Illegal PstI site found at 364
Illegal PstI site found at 1627
Illegal PstI site found at 2533
Illegal PstI site found at 3727 - 21INCOMPATIBLE WITH RFC[21]Illegal BglII site found at 1253
Illegal BglII site found at 1586
Illegal BglII site found at 1706
Illegal BglII site found at 2000
Illegal BglII site found at 2444
Illegal BglII site found at 3335
Illegal BglII site found at 3425 - 23INCOMPATIBLE WITH RFC[23]Illegal PstI site found at 310
Illegal PstI site found at 364
Illegal PstI site found at 1627
Illegal PstI site found at 2533
Illegal PstI site found at 3727 - 25INCOMPATIBLE WITH RFC[25]Illegal PstI site found at 310
Illegal PstI site found at 364
Illegal PstI site found at 1627
Illegal PstI site found at 2533
Illegal PstI site found at 3727
Illegal NgoMIV site found at 2480
Illegal NgoMIV site found at 3319
Illegal NgoMIV site found at 3530 - 1000COMPATIBLE WITH RFC[1000]


