Difference between revisions of "Part:BBa K3304003"
PlatonMega (Talk | contribs) |
PlatonMega (Talk | contribs) |
||
| (7 intermediate revisions by 2 users not shown) | |||
| Line 4: | Line 4: | ||
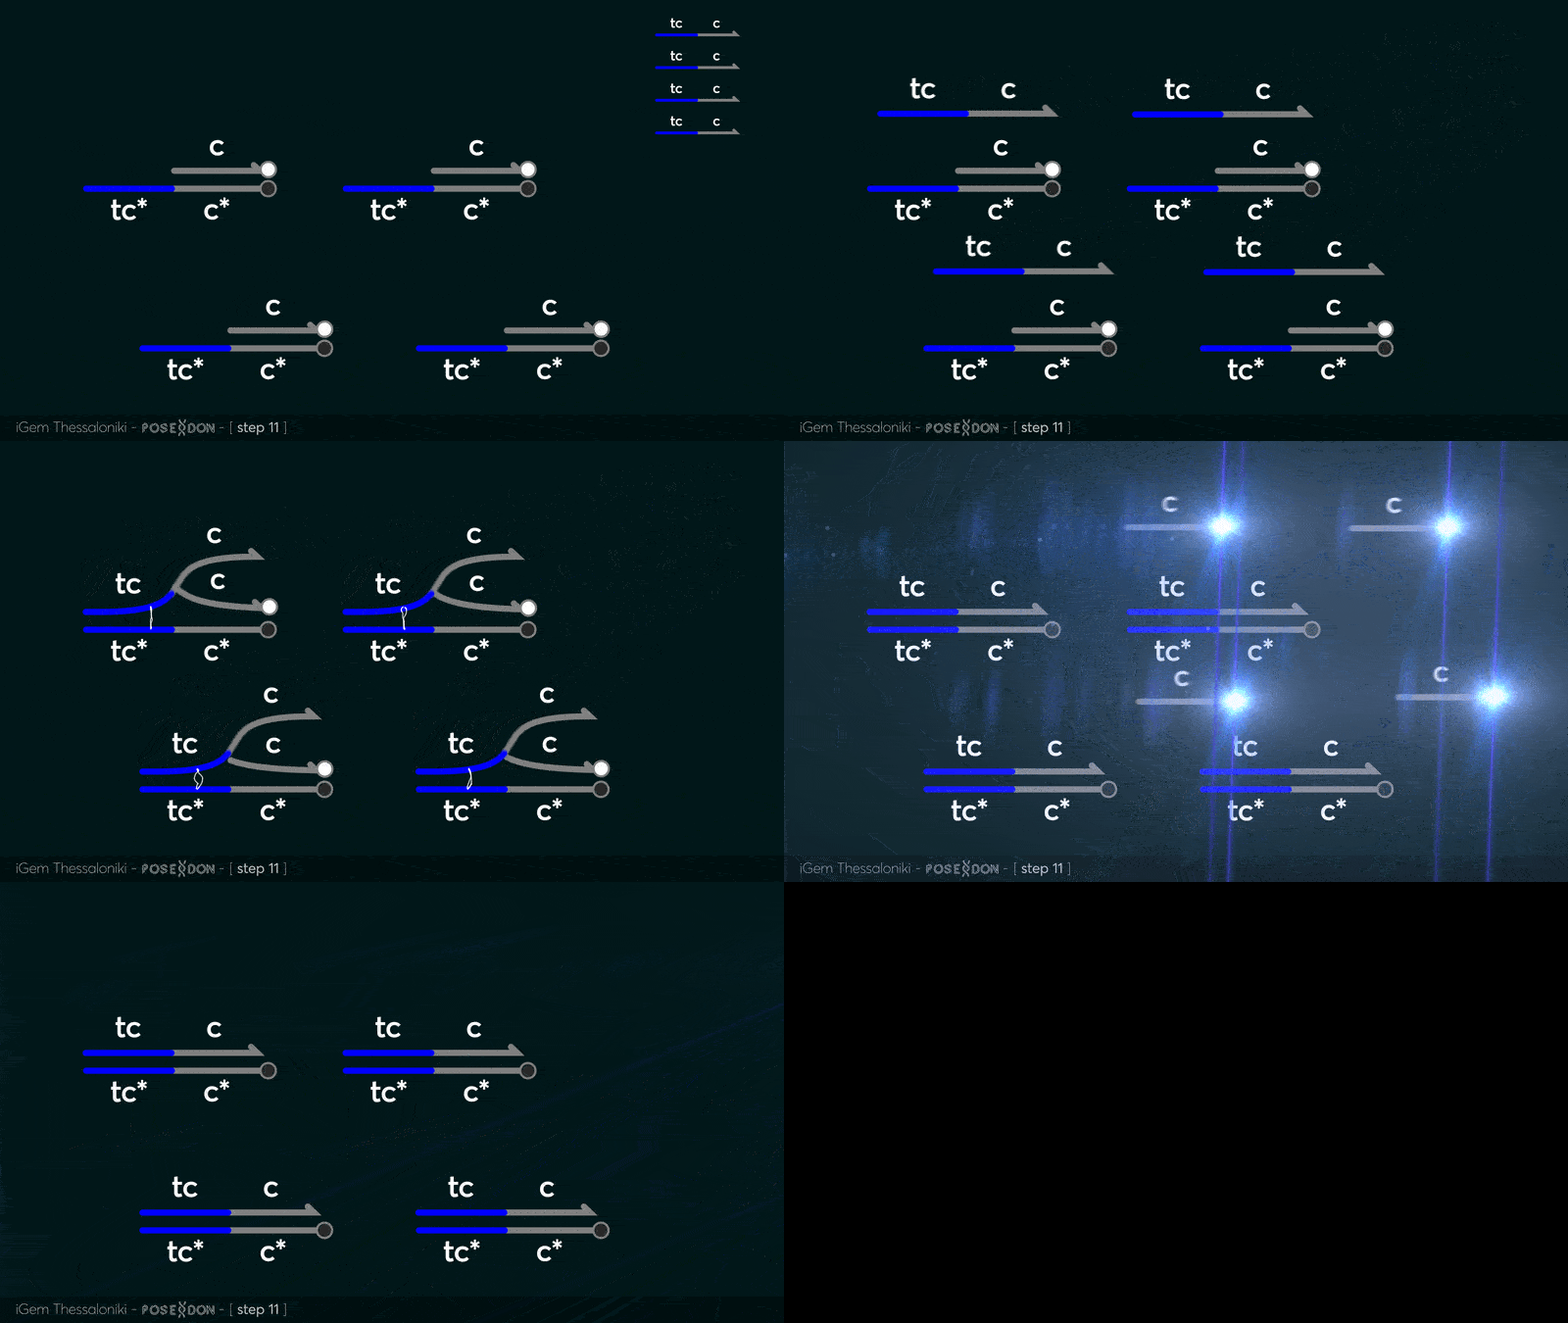
This is the reporter complex that generates the fluorescent output to be measured as a quantitative readout of the formal CRN's function. The top strand is labeled with a fluorophore molecule at its 3' end while it's complementary strand is labeled with a quencher at it's 5' end. The quencher is able to absorb the fluorescence emitted by the fluorophore for as long as they're paired. The strand displacement reaction induces the separation of the quencher from the fluorophore producing measurable output. | This is the reporter complex that generates the fluorescent output to be measured as a quantitative readout of the formal CRN's function. The top strand is labeled with a fluorophore molecule at its 3' end while it's complementary strand is labeled with a quencher at it's 5' end. The quencher is able to absorb the fluorescence emitted by the fluorophore for as long as they're paired. The strand displacement reaction induces the separation of the quencher from the fluorophore producing measurable output. | ||
| + | Additionally, the reporter complex can receive additional modifications for use in an alternative measurement practice, through an electrochemical sensor. Reportedly, the bottom strand can be modified with a thiol modification at it's 3' end to be plated on a gold electrode. Furthermore, the top strand can be labeled with a redox tag, mainly methylene blue, at its 5'end. | ||
https://2019.igem.org/wiki/images/d/d3/T--Thessaloniki--animation-step11.gif | https://2019.igem.org/wiki/images/d/d3/T--Thessaloniki--animation-step11.gif | ||
| − | https://2019.igem.org/ | + | https://2019.igem.org/wiki/images/5/5b/T--Thessaloniki--results-f1.png |
| + | The fluorescence levels of signal C at the measurement endpoint (200 min) after we corrected for bleaching shows a linear relationship with the initial concentration of signal C. This measurement was used to make the relative curve for later experiments in regards to maximum and minimum fluorescence | ||
| + | https://2019.igem.org/wiki/images/c/c1/T--Thessaloniki--results-f12.png | ||
| + | The bleaching of the reporter FAM observed throughout our reporter measurements. As the fluorophore becomes excited throughout the measurements it loses in fluorescence intensity resulting in a distinct dip observed in the graph. It is apparent that the more the fluorescence the more obvious the bleaching effect as more fluorophores are exposed | ||
https://2019.igem.org/wiki/images/9/97/T--Thessaloniki--results-f8.png | https://2019.igem.org/wiki/images/9/97/T--Thessaloniki--results-f8.png | ||
| + | The voltage diagram from our MOSFET circuit that translates the binding of a single-stranded DNA to the bottom strand of the reporter complex that is probed to a DNA plated electrode. The binding is expressed through the change in capacitance and it is viewed as drop-in voltage readout. As a bigger concentration of the corresponding strand is bound to the DNA probes we observe a bigger dip in voltage | ||
https://2019.igem.org/wiki/images/2/22/T--Thessaloniki--results-f10.png | https://2019.igem.org/wiki/images/2/22/T--Thessaloniki--results-f10.png | ||
https://2019.igem.org/wiki/images/3/3a/T--Thessaloniki--results-f11.png | https://2019.igem.org/wiki/images/3/3a/T--Thessaloniki--results-f11.png | ||
| + | A second experiment is designed to measure conductance variance, observed when specific DNA strands with redox tag bonded on the probe strand ( that is sulfur gold bonding on a gold plated electrode) are displaced through a DSD reaction. The results obtained show that the system is not as sensitive as the previous method, as it requires higher concentrations. The system’s response is also very high, as the existence of the specific strand is almost immediately detected. In the following graphs, the measurements obtained for various specific and non-specific strands are shown. | ||
| + | |||
| + | |||
| + | https://parts.igem.org/File:BBa_K3304003-ReporterCharacterizationThessaloniki2019.png | ||
| + | |||
<!-- Add more about the biology of this part here | <!-- Add more about the biology of this part here | ||
===Usage and Biology=== | ===Usage and Biology=== | ||
Latest revision as of 03:13, 22 October 2019
Reporter complex for output - TCC
This is the reporter complex that generates the fluorescent output to be measured as a quantitative readout of the formal CRN's function. The top strand is labeled with a fluorophore molecule at its 3' end while it's complementary strand is labeled with a quencher at it's 5' end. The quencher is able to absorb the fluorescence emitted by the fluorophore for as long as they're paired. The strand displacement reaction induces the separation of the quencher from the fluorophore producing measurable output. Additionally, the reporter complex can receive additional modifications for use in an alternative measurement practice, through an electrochemical sensor. Reportedly, the bottom strand can be modified with a thiol modification at it's 3' end to be plated on a gold electrode. Furthermore, the top strand can be labeled with a redox tag, mainly methylene blue, at its 5'end.
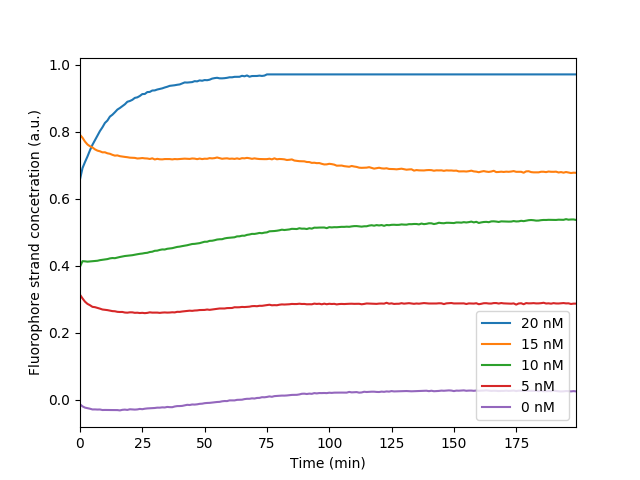 The fluorescence levels of signal C at the measurement endpoint (200 min) after we corrected for bleaching shows a linear relationship with the initial concentration of signal C. This measurement was used to make the relative curve for later experiments in regards to maximum and minimum fluorescence
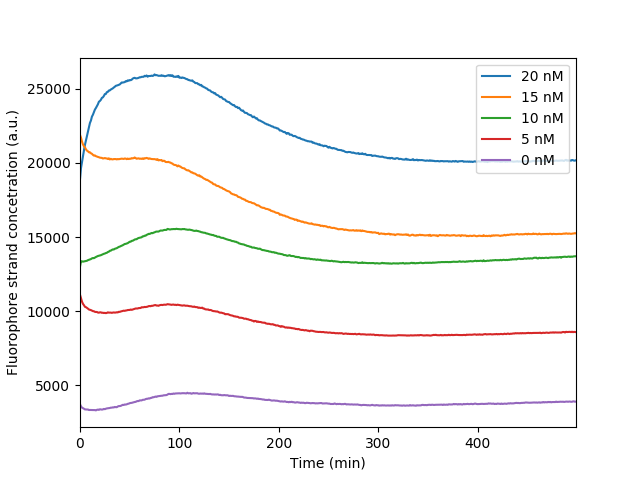 The bleaching of the reporter FAM observed throughout our reporter measurements. As the fluorophore becomes excited throughout the measurements it loses in fluorescence intensity resulting in a distinct dip observed in the graph. It is apparent that the more the fluorescence the more obvious the bleaching effect as more fluorophores are exposed
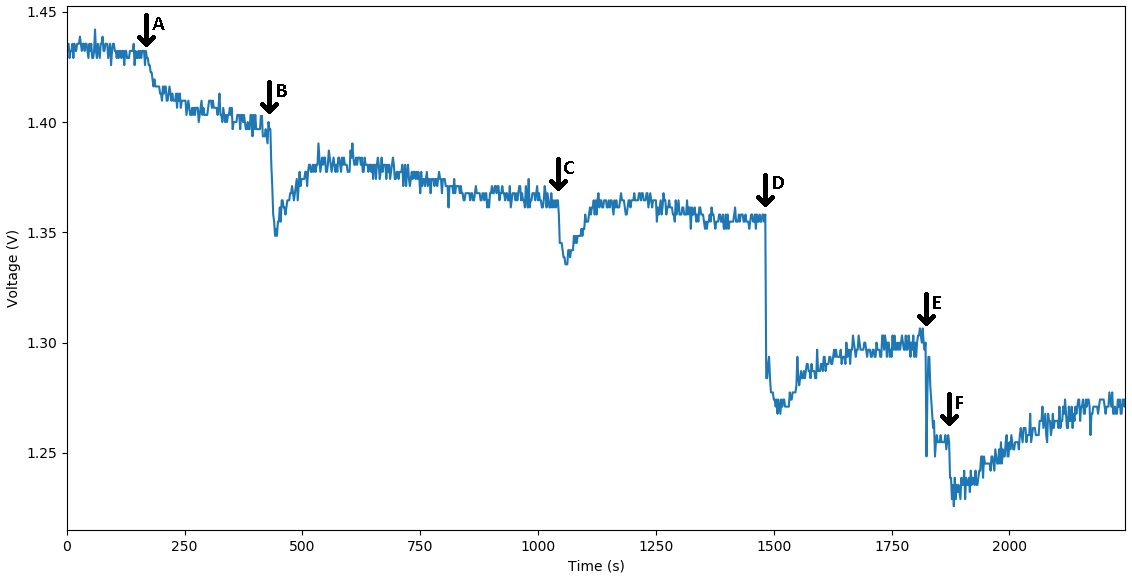 The voltage diagram from our MOSFET circuit that translates the binding of a single-stranded DNA to the bottom strand of the reporter complex that is probed to a DNA plated electrode. The binding is expressed through the change in capacitance and it is viewed as drop-in voltage readout. As a bigger concentration of the corresponding strand is bound to the DNA probes we observe a bigger dip in voltage
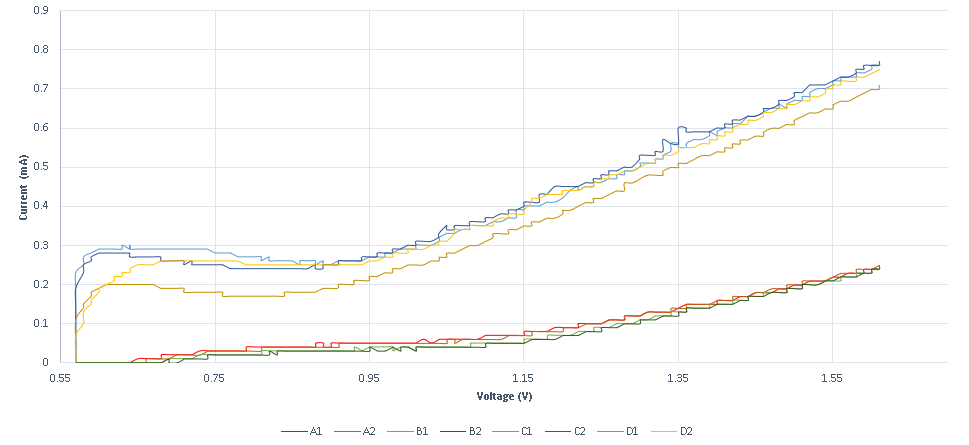
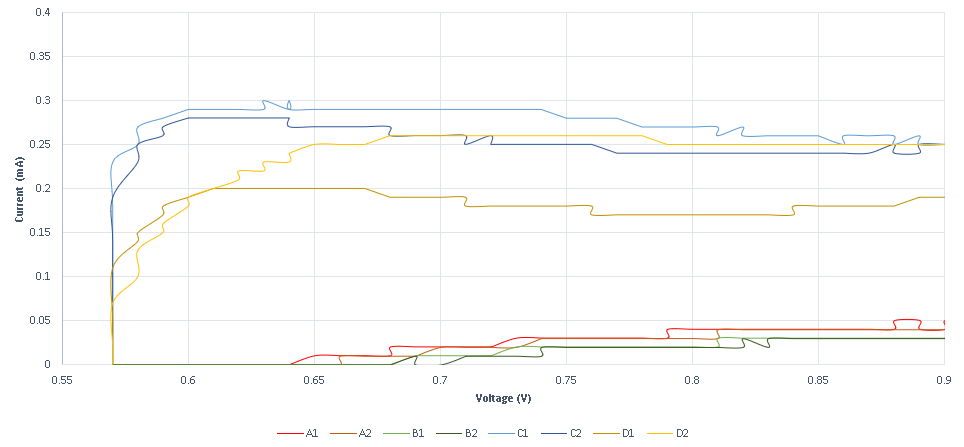 A second experiment is designed to measure conductance variance, observed when specific DNA strands with redox tag bonded on the probe strand ( that is sulfur gold bonding on a gold plated electrode) are displaced through a DSD reaction. The results obtained show that the system is not as sensitive as the previous method, as it requires higher concentrations. The system’s response is also very high, as the existence of the specific strand is almost immediately detected. In the following graphs, the measurements obtained for various specific and non-specific strands are shown.
https://parts.igem.org/File:BBa_K3304003-ReporterCharacterizationThessaloniki2019.png
Sequence and Features
- 10COMPATIBLE WITH RFC[10]
- 12COMPATIBLE WITH RFC[12]
- 21COMPATIBLE WITH RFC[21]
- 23COMPATIBLE WITH RFC[23]
- 25COMPATIBLE WITH RFC[25]
- 1000COMPATIBLE WITH RFC[1000]
