Difference between revisions of "Part:BBa K1378001"
Aemetzloff (Talk | contribs) |
Liuhaosheng (Talk | contribs) |
||
| (5 intermediate revisions by 2 users not shown) | |||
| Line 45: | Line 45: | ||
<h3>Contribution</h3> | <h3>Contribution</h3> | ||
<p>Aalto-Helsinki 2016 team has contributed to this part by improving its sequence and characterization. The part number is <a href = "https://parts.igem.org/Part:BBa_K1907002" target="blank" > BBa_K1907002</a>.</p> | <p>Aalto-Helsinki 2016 team has contributed to this part by improving its sequence and characterization. The part number is <a href = "https://parts.igem.org/Part:BBa_K1907002" target="blank" > BBa_K1907002</a>.</p> | ||
| − | <p>SBS_SH_112144 2018 team has improved parts mlrA gene BBa_K1378001 by modifying its sequence, adding 6x His tag, as well as making it a segment of composite parts. Its part number is <html> <a href='https://parts.igem.org/Part:BBa_K2888010'>BBa_K2888010</a>.<p> | + | <p>SBS_SH_112144 2018 team has improved parts mlrA gene BBa_K1378001 by modifying its sequence, adding 6x His tag, as well as making it a segment of composite parts. Its part number is <html> <a href='https://parts.igem.org/Part:BBa_K2888010'>BBa_K2888010</a>. |
| + | <p>Cornell 2019 has contributed to this part by improving its characterization using a novel detection and degradation system.</p> | ||
| + | <p>BUCT 2020 has contributed to this part by improving its sequence and characterization. The part number is <a href = "https://parts.igem.org/Part:BBa_K3699008" target="blank" > BBa_K3699008</a>, <a href = "https://parts.igem.org/Part:BBa_K3699009" target="blank" > BBa_K3699009</a>, <a href = "https://parts.igem.org/Part:BBa_K3699010" target="blank" > BBa_K3699010</a>.</p> | ||
| + | |||
</html> | </html> | ||
| Line 91: | Line 94: | ||
To test the efficacy of the in vivo mlrA microcystinase activity, we first incorporated it into a composite part (BBa_K2960012) containing a strong constitutive promoter, ribosome binding site, and terminator, in order to ensure strong expression of the enzyme. Using the restriction enzyme digest method, we transformed this sequence in pSB1C3 into NEB DH5α cells. | To test the efficacy of the in vivo mlrA microcystinase activity, we first incorporated it into a composite part (BBa_K2960012) containing a strong constitutive promoter, ribosome binding site, and terminator, in order to ensure strong expression of the enzyme. Using the restriction enzyme digest method, we transformed this sequence in pSB1C3 into NEB DH5α cells. | ||
| − | We then immobilized the engineered strain in approximately 3 millimeter diameter alginate beads [1]. We then placed these beads into a packed-bed bioreactor, through which we passed a solution containing microcystin-LR. Using our novel gold nanoparticle-based colorimetric detection system, we measured MC-LR concentration of the | + | We then immobilized the engineered strain in approximately 3 millimeter diameter alginate beads [1]. We then placed these beads into a packed-bed bioreactor, through which we passed a solution containing a known amount of microcystin-LR. Using our novel gold nanoparticle-based colorimetric aptamer detection system (ssDNA aptamer BBa_k2960000), we measured MC-LR concentration of the outflow based on a standard curve generated from known MC-LR concentrations. To estimate mlrA activity, we compared the MC-LR concentration of the outflow to that of a control reaction, in which the same solution was passed through the empty chamber. |
| − | + | ||
===Methods=== | ===Methods=== | ||
| Line 138: | Line 140: | ||
===Results=== | ===Results=== | ||
| − | As compared to the control, the outflow from the bioreactor packed with beads containing mlrA has lower relative MC-LR concentration. | + | As compared to the control, the outflow from the bioreactor packed with beads containing mlrA has lower relative MC-LR concentration. Relative concentration was determined by normalizing the test (mlrA) absorbance values in the outflow by those of the control and then using the equation given by the standard curve to calculate corresponding relative concentration. |
<html> | <html> | ||
| Line 144: | Line 146: | ||
</html> | </html> | ||
| + | Figure 3. Relative concentration of MC-LR in outflow from control vs reactor packed with mlrA expressing E. coli encapsulated in alginate beads. n=3. | ||
References | References | ||
| Line 149: | Line 152: | ||
1. Dziga, D., Sworzen, M., Wladyka, B., & Wasylewski, M. (2013). Genetically Engineered Bacteria Immobilized in Alginate as an Option of Cyanotoxins Removal. International Journal of Environmental Science and Development, 360–364. https://doi.org/10.7763/IJESD.2013.V4.371 | 1. Dziga, D., Sworzen, M., Wladyka, B., & Wasylewski, M. (2013). Genetically Engineered Bacteria Immobilized in Alginate as an Option of Cyanotoxins Removal. International Journal of Environmental Science and Development, 360–364. https://doi.org/10.7763/IJESD.2013.V4.371 | ||
| + | ==Characterization of MlrA by BUCT 2020== | ||
| + | ===BBa_K1378001 MlrA=== | ||
| + | <html> | ||
| + | <h3 id="degradation0301">Design </h3> | ||
| + | <p> | ||
| + | In order to obtain higher expression and improve the degradation effect, we replaced the original promoter J23110 with a much stronger constitutive promoter J23119. | ||
| + | </p> | ||
| + | <div class="imgBox" style="flex-direction: column"> | ||
| + | <img style="width: 850px;height: 351px" src="https://2020.igem.org/wiki/images/a/ae/T--BUCT--collaboration_1.png"><br> | ||
| + | <p><b>Figure 1. Schematic of pKMV-mlrA-C1. </b>We replaced the original promoter J23110 with a stronger constitutive promoter J23119, and transformed the plasmid into E. coli JM109. | ||
| + | </p></div> | ||
| + | <h3 id="degradation0301">Method </h3> | ||
| + | <p> | ||
| + | <b>◇1.</b>Plasmids including pKMV-mlrA-C1 (including BBa_K1378001) and pKMV-mlrA-THN1 (including BBa_K3699001) synthesized by BGI Tec were transformed into E. coli JM109 to construct two strains, E. coli JM109 (pKMV-mlrA-C1) and E. coli JM109 (pKMV-mlrA-THN1). | ||
| + | <div class = "imgBox"> | ||
| + | <img src="https://2020.igem.org/wiki/images/6/69/T--BUCT--collaboration_12.png"> | ||
| + | <img src="https://2020.igem.org/wiki/images/f/f4/T--BUCT--collaboration_13.png"> | ||
| + | </div> | ||
| + | <p><b>Figure 2. Plasmid Profile.</b>pKMV-mlrA-C1 (including BBa_K1378001) and pKMV-mlrA-THN1 (including BBa_K3699001). | ||
| + | </p> | ||
| + | <p> | ||
| + | <b>◇2.</b>Culture these two strains for 16 h, and then transfer 150 mL of the bacterial culture for centrifugation, collect the cell pellets, and resuspended the cells by adding 20 mL of PB buffer. | ||
| + | </p> | ||
| + | <p> | ||
| + | <b>◇3.</b>Take 10 mL for ultrasonic fragmentation, take the supernatant as the crude extract of cells, and use it for toxin degradation experiment; take another 10 mL bacterial resuspend solution, and directly use it for toxin degradation experiment. | ||
| + | </p> | ||
| + | <p> | ||
| + | <b>◇4.</b>Take 1.5 mL centrifuge tubes, add the toxin to the final concentration of about 20 ng/mL, carry out the toxin degradation experiment at 37℃. Samples were taken every 6 h for measuring the concentration. | ||
| + | <div class = "imgBox"> | ||
| + | <img src="https://2020.igem.org/wiki/images/c/c7/T--BUCT--collaboration_4.png"> | ||
| + | <img src="https://2020.igem.org/wiki/images/e/e5/T--BUCT--collaboration_5.png"> | ||
| + | </div> | ||
| + | </p> | ||
| + | <h3 style="font-size: 25px;">Figure 3. Enzyme in centrifuge tube. </h3> | ||
| + | <h2></h2> | ||
| + | <h3 id="degradation0301">Testing </h3> | ||
| + | <p> | ||
| + | <br> | ||
| + | We used ELISA kits to detect toxin concentrations in samples. (Kits ordered from Zhenke Biotec)<br> | ||
| + | <b>Assay procedure:</b><br> | ||
| + | <b>◇1.</b>Prepare all reagents before starting assay procedure. It is recommended that all Standards and Samples be added in duplicate to the Microelisa Stripplate.<br> | ||
| + | <b>◇2.</b>Add standard: Set Standard wells, testing sample wells. Add standard 50 μL to standard well.<br> | ||
| + | <b>◇3.</b>Add Sample: Add testing sample 10 μL then add Sample Diluent 40 μL to testing sample well; Blank well doesn’t add anything.<br> | ||
| + | <b>◇4.</b>Add 100 μL of HRP-conjugate reagent to each well, cover with an adhesive strip and incubate for 60 minutes at 37℃.<br> | ||
| + | <b>◇5.</b>Aspirate each well and wash, repeating the process four times for a total of five washes. Wash by filling each well with Wash Solution (400 μL) using a squirt bottle, manifold dispenser or autowasher. Complete removal of liquid at each step is essential to good performance. After the last wash, remove any remaining Wash Solution by aspirating or decanting. Invert the plate and blot it against clean paper towels.<br> | ||
| + | <b>◇6.</b>Add chromogen solution A 50 μL and chromogen solution B 50 μL to each well. Gently mix and incubate for 15 minutes at 37℃。Protect from light.<br> | ||
| + | <b>◇7.</b>Add 50 μL Stop Solution to each well. The color in the wells should change from blue to yellow. If the color in the wells is green or the color change does not appear uniform, gently tap the plate to ensure thorough mixing.<br> | ||
| + | <b>◇8.</b>Read the Optical Density(OD), at 450 nm using a microtiter plate reader within 15 minutes.<br> | ||
| + | |||
| + | </p> | ||
| + | <div class="imgBox"> | ||
| + | <img src="https://2020.igem.org/wiki/images/f/fd/T--BUCT--collaboration_6.png" style="margin: 20px auto;width: 700px;height: 545px" /> | ||
| + | </div> | ||
| + | <h3 style="font-size: 25px;">Figure 4. Standard curve of MC-LR. </h3> | ||
| + | <p> | ||
| + | We plotted the working curve with standard MC-LR samples. The standard curve established a linear relationship between Absorbance and MC-LR concentration. | ||
| + | </p> | ||
| + | <h3 id="degradation0301">Result </h3> | ||
| + | |||
| + | <p> | ||
| + | <br> | ||
| + | We measured the concentration of toxin in the reaction system every 6 hours (Fig. 5 and Fig. 6). | ||
| + | <div class="imgBox"> | ||
| + | <img src="https://2020.igem.org/wiki/images/e/e8/T--BUCT--collaboration_7.png" style="margin: 20px auto;width: 700px;height: 612px" /> | ||
| + | </div> | ||
| + | |||
| + | <h3 style="font-size: 25px;">Figure 5. Degradation result of pKMV-mlrA-C1 cell culture.</h3> | ||
| + | <div class="imgBox"> | ||
| + | <img src="https://2020.igem.org/wiki/images/3/33/T--BUCT--collaboration_8.png" style="margin: 20px auto;width: 700px;height: 612px" /> | ||
| + | </div> | ||
| + | <h3 style="font-size: 25px;">Figure 6. Degradation result of pKMV-mlrA-C1 cell extract.</h3> | ||
| + | <br> | ||
| + | <br> | ||
| + | <p> | ||
| + | ●As can be seen from the graph, within 24 h, the toxins were degraded by 32.13% (cell culture) and 35.32% (cell extract). The latter is more efficient in degradation. | ||
| + | </p> | ||
| + | <p> | ||
| + | ●Comparing the degradation rates of 18 h and 24 h, we can find that the degradation efficiency basically reaches the maximum value when the reaction is carried out for 18 h. | ||
| + | </p> | ||
| + | <p> Due to the different experimental conditions, we cannot compare this result with the previous data. </p> | ||
| + | <p> | ||
| + | <b> | ||
| + | However, this result successfully indicated that the MlrA enzyme we designed was able to degrade MC-LR and reduce its toxicity. | ||
| + | </b> | ||
| + | </p> | ||
| + | |||
| + | <br> | ||
| + | <h3 id="degradation0301">Reference </h3> | ||
| + | <p> | ||
| + | |||
| + | <b>[1]</b>Bourne D G . Enzymatic pathway for the bacterial degradation of the cyanobacterial cyclic peptide toxin microcystin LR.[J]. Applied & Environmental Microbiology, 1996, 62. <br> | ||
| + | <b>[2]</b>Ren YY. Synthesis, expression and purification of microcystin-degrading enzyme Mlr A gene optimized by Lactococcus lactis preference codon. [D]. Jilin University, 2015. | ||
| + | </p> | ||
| + | </html> | ||
<!-- Uncomment this to enable Functional Parameter display | <!-- Uncomment this to enable Functional Parameter display | ||
Latest revision as of 01:02, 28 October 2020
MlrA

Introduction
MlrA is a 28kDa protease found in Sphingomonas sp. which can cleavage microcystins(MCs).
MlrA is one part of the gene cluster responsible for the ability of MC degradation. The cluster includes four ORFs, mlrA, mlrB, mlrC and mlrD, which can hydrolyze MCs and facilitate absorption of the products as carbon source. MlrA is sometimes referred as a metalprotease by inhibitor studies.
MlrA can cleavage the Adda-Arg bond and causes ring opening.(Fig. 1) The first-step linearized product shows much weaker hepatoxin compared with MCs. In the experiment of mouse bioassay, up to 250 mg/kg of linearized MC-LR shows no toxicity to mouse, much higher than 50% lethal dose 50mg/kg of cyclic MC-LR. Furthermore, the linearization also raise the median inhibition concentration to 95nM, around 160 times higher than original 0.6nM. [1]

Usage and Biology
Characterization
1. Constructing method for analysis of MC concentration
p-Nitrophenyl phosphate (pNPP) is a widely used non-specific substrate to test protein phosphatase activity and it can be hydrolyzed to p-Nitrophenyl(pNP) with characteristic absorption at 405nm. The measurement of PP1 activity is based on the accumulation of pNP. Considering the microcystin (MC) is the inhibitor of PP1 and MlrA can disrupt MC’s structure to disrupt its inhibitory effect, the MlrA activity can be detected by quantification of absorption at 405nm (Fig. 2). So the concentration of MCs after degradation can be finally measured by absorption spectrophotometry method with all the calibration curves for all the interactions above.

Firstly a calibration curve of PP1 activity was generated. The concentration of substrate pNP is sufficient overall so the PP1 enzyme is saturated and proportion to the accumulation rate of product pNPP. We could select a proper working concentration of PP1 in the range of nearly linear relationship between PP1 and change rate of 405nm absorption.

Based on the premise of linear relationship between product and absorbance, we choose 0.05unit/ul as the working concentration of PP1 and then test the inhibition efficiency of MC-LR. As a result, PP1 activity decreases after the addition of MC-LR and there is a positive correlation between the reduction of absorbance and concentration of MC-LR.

2. Verifying the degradation effect of MlrA
To test the degradation efficiency of MlrA expressed by E. coli, MlrA expression plasmid has been constructed and transformed into E. coli strain BL21(DE3) (Fig. 5a). After induction, the bacteria are lysed by lysozyme and incubated with MC solution. Judged by PP1 activity treated by the mixture, the activity in experiment group expressing MlrA is much higher than strain carrying blank vectors, suggesting that MC-LR is degraded (Fig. 5b). Therefore, it could be concluded that MlrA function well in E. coli expression system.

References
[1] Gehringer, M. M., Milne, P., Lucietto, F., & Downing, T. G. (2005). Comparison of the structure of key variants of microcystin to vasopressin. Environmental toxicology and pharmacology, 19(2), 297-303.
Contribution
Aalto-Helsinki 2016 team has contributed to this part by improving its sequence and characterization. The part number is BBa_K1907002.
SBS_SH_112144 2018 team has improved parts mlrA gene BBa_K1378001 by modifying its sequence, adding 6x His tag, as well as making it a segment of composite parts. Its part number is BBa_K2888010.
Cornell 2019 has contributed to this part by improving its characterization using a novel detection and degradation system.
BUCT 2020 has contributed to this part by improving its sequence and characterization. The part number is BBa_K3699008, BBa_K3699009, BBa_K3699010.
Shanghai_HS 2019‘s characterization
BBa_K1378001 MlrA
Methods:
1. replicating the MlrA DNA through a technology called PCR, Gel Electrophoresis and Extraction of MlrA
2. combining the gene MlrA with plasmids, and transformed the plasmids to DH5-alpha, a strain of E. coli.
3. Senting the extracted plasmid to Sangon, a biotech company, for DNA sequencing after a series of procedures.
4. transforming the plasmid to E. coli BL21(DE3), another type of E-coli characterized in producing protein, to express the targeted protein.
5. purifing the protein MlrA and utilizing HPLC to determine the effectiveness of the protein MlrA.
Results:
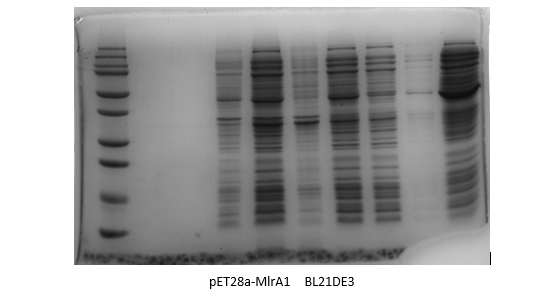
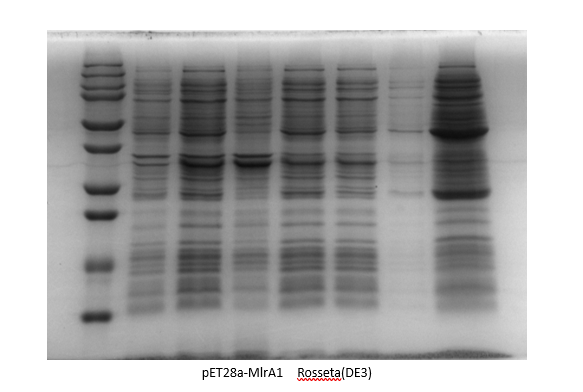
By adding the protein that binds to the Ni21-NTA to the affinity column, we were able to collect the liquid that went through. We ran the SDS-Page Gel with thirteen chosen samples to verify the results of the protein purification. It turns out, we successfully purified pET28-mlrA1, indiciating that it can be devoted to degrading MC-LR.
Results:
Protein Purification
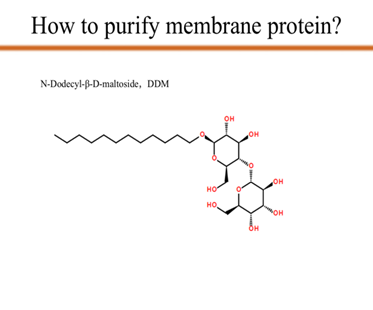
As you can see from the picture, we use N-Dodecyl-β-D-maltoside, which is also known as DDM, to transfer the target membrane protein mlrA from the supernatant to the membrane of DDM. Since DDM provides the membrane which mlrA depends on, with the DDM concentration increases, the concentration of the mlrA in the supernatant decreases to zero. That is the last step of protein purification.
After centrifuge the solution, to further purify the protein, we put Ni21-NTA with the supernatant and incubate overnight. The mlrA will be combined with the specific binding sites on Ni21-NTA. Then, using the method of gradient elution, while the amount of imidazole, which is a competitive agent in this step, increases, it will compete with mlrA on the binding sites of the Ni column. Therefore, the mlrA is gradually elated.
Enzyme Function Test
High Performance Liquid Chromatography (HPLC)
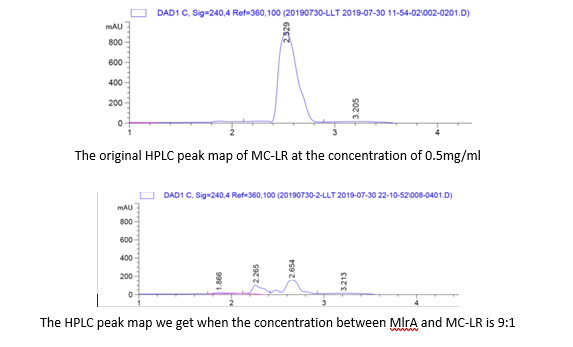
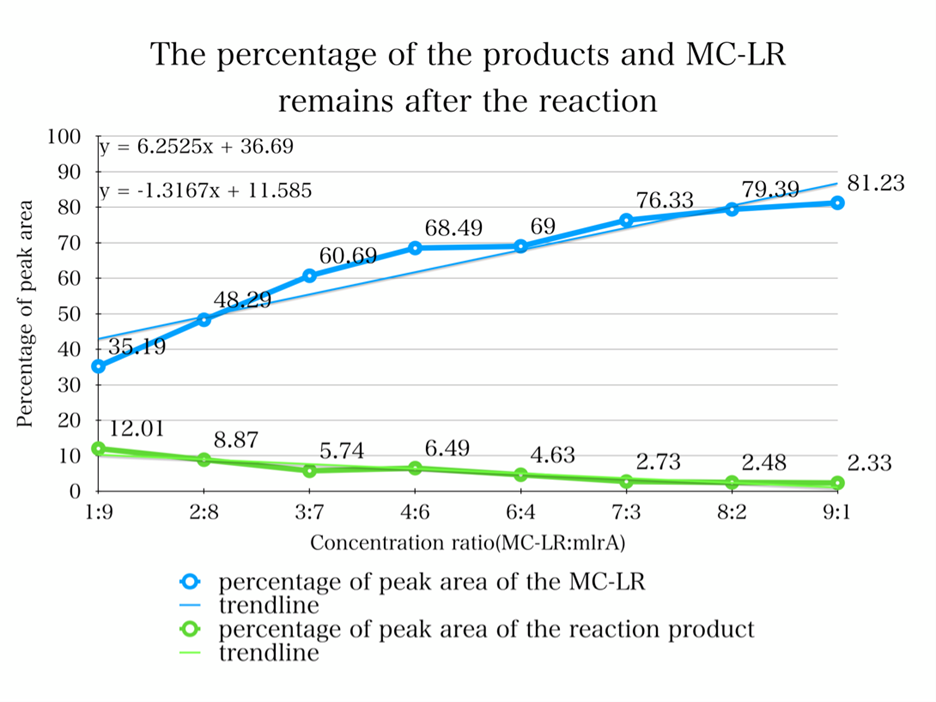
To quantify whether MC-LR can be degraded from the samples, we conducted a control variable experiments, and the following are the data we got:
1. By adding the protein that we have designed, and letting it react with the MC-LR, we find that they successfully reacted just as we expected.
2. From the HPLC results, we find that as the ratio of the mlrA we have designed increases, the percentage of the reaction product increases and the amount of MC-LR decreases consequencely. This result successful indicates that the protein mlrA we have designed is able to react with MC-LR and release the product which is 160 times less toxic than MC-LR, as we mentioned in the Background.
</html>
Characterization of MlrA by Cornell University 2019
BBa_K1378001 MlrA
Assessment of the ability of mlrA to degrade MC-LR in vivo
To test the efficacy of the in vivo mlrA microcystinase activity, we first incorporated it into a composite part (BBa_K2960012) containing a strong constitutive promoter, ribosome binding site, and terminator, in order to ensure strong expression of the enzyme. Using the restriction enzyme digest method, we transformed this sequence in pSB1C3 into NEB DH5α cells.
We then immobilized the engineered strain in approximately 3 millimeter diameter alginate beads [1]. We then placed these beads into a packed-bed bioreactor, through which we passed a solution containing a known amount of microcystin-LR. Using our novel gold nanoparticle-based colorimetric aptamer detection system (ssDNA aptamer BBa_k2960000), we measured MC-LR concentration of the outflow based on a standard curve generated from known MC-LR concentrations. To estimate mlrA activity, we compared the MC-LR concentration of the outflow to that of a control reaction, in which the same solution was passed through the empty chamber.
Methods
IMMOBILIZATION
1. Culture 40 mL of E.coli.
2. Centrifuge 40 mL of freshly cultured E.coli (Dilute to OD600 = 3.0) and resuspend the pellet in 2 mL of 50 mM phosphate buffer, pH = 7.0. Use 50 mL falcon tubes.
3. Slowly add 40 mg of sodium alginate to the cell suspension. Mix.
4. Add the suspension dropwise into 5% CaCl2 to obtain beads of approximately 3 mm in diameter.
5. Incubate in CaCl2 for 30 minutes at 4°C.
6. Beads can then be refrigerated or held at room temperature.
TESTING
1. Suspend the alginate beads in a 23.5°C water bath.
2. Every 24 hours dissolve some of the beads in 0.1M EDTA.
3. Plate the resulting solution onto LB + CAM (if using pSB1C3 vector) plates and incubate overnight to test for bacterial activity. Presence of colonies on the plates indicated survival of the E. Coli and successful encapsulation. To further test viability, wet cultures of the beads were successfully made by piercing the bead and placing the sample into LB.

Figure 1. Model of packed-bed bioreactor which was used for testing.


Figure 2. Top: Plated solution of dissolved beads resulted in a lawn when incubated overnight at 37°C. Bottom: Pelleted overnight culture of cells (see end of tube) obtained by puncturing 11-day old beads suggests long-term viability of encapsulated cells.
Results
As compared to the control, the outflow from the bioreactor packed with beads containing mlrA has lower relative MC-LR concentration. Relative concentration was determined by normalizing the test (mlrA) absorbance values in the outflow by those of the control and then using the equation given by the standard curve to calculate corresponding relative concentration.

Figure 3. Relative concentration of MC-LR in outflow from control vs reactor packed with mlrA expressing E. coli encapsulated in alginate beads. n=3.
References
1. Dziga, D., Sworzen, M., Wladyka, B., & Wasylewski, M. (2013). Genetically Engineered Bacteria Immobilized in Alginate as an Option of Cyanotoxins Removal. International Journal of Environmental Science and Development, 360–364. https://doi.org/10.7763/IJESD.2013.V4.371
Characterization of MlrA by BUCT 2020
BBa_K1378001 MlrA
Design
In order to obtain higher expression and improve the degradation effect, we replaced the original promoter J23110 with a much stronger constitutive promoter J23119.

Figure 1. Schematic of pKMV-mlrA-C1. We replaced the original promoter J23110 with a stronger constitutive promoter J23119, and transformed the plasmid into E. coli JM109.
Method
◇1.Plasmids including pKMV-mlrA-C1 (including BBa_K1378001) and pKMV-mlrA-THN1 (including BBa_K3699001) synthesized by BGI Tec were transformed into E. coli JM109 to construct two strains, E. coli JM109 (pKMV-mlrA-C1) and E. coli JM109 (pKMV-mlrA-THN1).


Figure 2. Plasmid Profile.pKMV-mlrA-C1 (including BBa_K1378001) and pKMV-mlrA-THN1 (including BBa_K3699001).
◇2.Culture these two strains for 16 h, and then transfer 150 mL of the bacterial culture for centrifugation, collect the cell pellets, and resuspended the cells by adding 20 mL of PB buffer.
◇3.Take 10 mL for ultrasonic fragmentation, take the supernatant as the crude extract of cells, and use it for toxin degradation experiment; take another 10 mL bacterial resuspend solution, and directly use it for toxin degradation experiment.
◇4.Take 1.5 mL centrifuge tubes, add the toxin to the final concentration of about 20 ng/mL, carry out the toxin degradation experiment at 37℃. Samples were taken every 6 h for measuring the concentration.


Figure 3. Enzyme in centrifuge tube.
Testing
We used ELISA kits to detect toxin concentrations in samples. (Kits ordered from Zhenke Biotec)
Assay procedure:
◇1.Prepare all reagents before starting assay procedure. It is recommended that all Standards and Samples be added in duplicate to the Microelisa Stripplate.
◇2.Add standard: Set Standard wells, testing sample wells. Add standard 50 μL to standard well.
◇3.Add Sample: Add testing sample 10 μL then add Sample Diluent 40 μL to testing sample well; Blank well doesn’t add anything.
◇4.Add 100 μL of HRP-conjugate reagent to each well, cover with an adhesive strip and incubate for 60 minutes at 37℃.
◇5.Aspirate each well and wash, repeating the process four times for a total of five washes. Wash by filling each well with Wash Solution (400 μL) using a squirt bottle, manifold dispenser or autowasher. Complete removal of liquid at each step is essential to good performance. After the last wash, remove any remaining Wash Solution by aspirating or decanting. Invert the plate and blot it against clean paper towels.
◇6.Add chromogen solution A 50 μL and chromogen solution B 50 μL to each well. Gently mix and incubate for 15 minutes at 37℃。Protect from light.
◇7.Add 50 μL Stop Solution to each well. The color in the wells should change from blue to yellow. If the color in the wells is green or the color change does not appear uniform, gently tap the plate to ensure thorough mixing.
◇8.Read the Optical Density(OD), at 450 nm using a microtiter plate reader within 15 minutes.

Figure 4. Standard curve of MC-LR.
We plotted the working curve with standard MC-LR samples. The standard curve established a linear relationship between Absorbance and MC-LR concentration.
Result
We measured the concentration of toxin in the reaction system every 6 hours (Fig. 5 and Fig. 6).

Figure 5. Degradation result of pKMV-mlrA-C1 cell culture.

Figure 6. Degradation result of pKMV-mlrA-C1 cell extract.
●As can be seen from the graph, within 24 h, the toxins were degraded by 32.13% (cell culture) and 35.32% (cell extract). The latter is more efficient in degradation.
●Comparing the degradation rates of 18 h and 24 h, we can find that the degradation efficiency basically reaches the maximum value when the reaction is carried out for 18 h.
Due to the different experimental conditions, we cannot compare this result with the previous data.
However, this result successfully indicated that the MlrA enzyme we designed was able to degrade MC-LR and reduce its toxicity.
Reference
[1]Bourne D G . Enzymatic pathway for the bacterial degradation of the cyanobacterial cyclic peptide toxin microcystin LR.[J]. Applied & Environmental Microbiology, 1996, 62.
[2]Ren YY. Synthesis, expression and purification of microcystin-degrading enzyme Mlr A gene optimized by Lactococcus lactis preference codon. [D]. Jilin University, 2015.
Sequence and Features
- 10COMPATIBLE WITH RFC[10]
- 12COMPATIBLE WITH RFC[12]
- 21COMPATIBLE WITH RFC[21]
- 23COMPATIBLE WITH RFC[23]
- 25INCOMPATIBLE WITH RFC[25]Illegal AgeI site found at 244
Illegal AgeI site found at 373 - 1000COMPATIBLE WITH RFC[1000]

