Difference between revisions of "Part:BBa K1033906"
(→Contribution) |
(→Contribution) |
||
| (14 intermediate revisions by 2 users not shown) | |||
| Line 30: | Line 30: | ||
Summary: We characterized tsPurple's absorption and emission spectra. <br><br> | Summary: We characterized tsPurple's absorption and emission spectra. <br><br> | ||
We expressed tsPurple with a his-tag in <I>E. coli</I> DH5α cells using the high copy pSB1C3 vector with the <partinfo>BBa_J23110</partinfo> promoter. We selected and cultured two different tsPurple expressing colonies, lysed them, and used | We expressed tsPurple with a his-tag in <I>E. coli</I> DH5α cells using the high copy pSB1C3 vector with the <partinfo>BBa_J23110</partinfo> promoter. We selected and cultured two different tsPurple expressing colonies, lysed them, and used | ||
| − | affinity chromatography with Ni-NTA-agarose to purify two separate samples of | + | affinity chromatography with Ni-NTA-agarose to purify two separate samples of his-tsPurple. |
| − | + | ||
<br><br> | <br><br> | ||
<b>Purification results and Mw determination:</b> | <b>Purification results and Mw determination:</b> | ||
| + | <br><br> | ||
| + | After purification, the protein is seen as a band at a size of approximately 28 kDa on 10 % SDS-PAGE gels of both samples (<I>Figure 1.</I>). Considering that the his-tag adds roughly 2.5 kDa [1] to the total weight of the protein, we can conclude that tsPurple’s molecular weight is around 25.5 kDa, this result is consistent with SVCE_Chennai iGEM-2016 team’s computational data.<br> | ||
<br> | <br> | ||
[[File:T--Uppsala Universitet--tsPurpleGel.png|600px|thumb|left|<b>Figure 1: SDS-PAGE analysis of purification of tsPurple sample 2.</b><br> | [[File:T--Uppsala Universitet--tsPurpleGel.png|600px|thumb|left|<b>Figure 1: SDS-PAGE analysis of purification of tsPurple sample 2.</b><br> | ||
| − | SDS-PAGE analysis of affinity purification steps of the | + | SDS-PAGE analysis of affinity purification steps of the his-tagged protein from <I>E. coli</I> cell lysate, flow-through (F), wash 1 (W1), wash 2 (W2), elutions 1-4 (E1-E4), and elute 3 after dialysis for buffer exchange (D) on 10 % SDS-PAGE stained with Coomassie |
Blue. Purified tsPurple is seen as a band at a size of approximately 28 kDa.]] | Blue. Purified tsPurple is seen as a band at a size of approximately 28 kDa.]] | ||
<br><br><br><br><br><br><br><br><br><br><br><br><br><br><br><br><br><br><br><br><br><br><br><br><br><br><br><br> | <br><br><br><br><br><br><br><br><br><br><br><br><br><br><br><br><br><br><br><br><br><br><br><br><br><br><br><br> | ||
| − | |||
| − | |||
We used Bradford assay to determine protein concentration in both samples and measured their fluorescence spectra. For absorption spectrum, we concentrated the protein samples 10x with Amicon Ultra-0.5 mL Centrifugal Filters (3K) to get better absorption peaks. | We used Bradford assay to determine protein concentration in both samples and measured their fluorescence spectra. For absorption spectrum, we concentrated the protein samples 10x with Amicon Ultra-0.5 mL Centrifugal Filters (3K) to get better absorption peaks. | ||
<br><br> | <br><br> | ||
| − | + | Excitation is equivalent to absorption as it brings a molecule to its excited state S<sub>n</sub>. Thus when there is no interference from impurities in the solution, the excitation and the absorption spectra of a fluorophore should be identical [2]. Our results showed, indeed, that both are at 588 nm. While the emission peak was at 624 nm (when excited at 540 nm) (<I>Figure 2a, 2b, 2c</I>). | |
| + | <br><br> | ||
| + | We chose a LacI fused cy3 fluorophore as our positive control for fluorescence measurement. Cy3 has an excitation peak at 550 nm and an emission peak at 570 nm [3], the closest to tsPurple’s peaks among all the fluorophores that we had in hand. Through absorbance measurements at 540 nm, we normalized LacI-cy3 and tsPurple’s concentrations to the same value: Abs<sub>540</sub> = 0.03. As can be seen from the comparison in <I>Figure 2d</I>, tsPurple is a non-fluorescent protein. | ||
<br><br> | <br><br> | ||
<b>Absorbance, excitation and emission spectra:</b> | <b>Absorbance, excitation and emission spectra:</b> | ||
<br> | <br> | ||
| − | [[File:T--Uppsala_Universitet-- | + | [[File:T--Uppsala_Universitet--tsPurple_Spectra2.png|600px|thumb|left|<b>Figure 2: Excitation (a), absorbance (b) and emission (c) spectra of tsPurple; Emission spectra of tsPurple vs. LacI-cy3 (d).</b> <br>Fluorescence measurements were done using the microplate reader model Tecan Spark 10M in a flat black 384, low volume plate with non-binding surface. The measurements were made in a range of 440-750 nm. Absorbance measurements were done using Nanodrop 2000 (UV-vis), blanked against PBS buffer, in a range of 200-750 nm.]] |
| − | Fluorescence measurements were done using the microplate reader model Tecan Spark 10M in a flat black 384, low volume plate with non-binding surface. The measurements were made in a range of 440-750 nm. Absorbance measurements were done using Nanodrop 2000 (UV-vis), blanked against PBS buffer, in a range of 200-750 nm. ]]<br> | + | <br><br><br><br><br><br><br><br><br><br><br><br><br><br><br><br><br><br><br><br><br><br><br><br><br><br> |
| − | + | <I>* His-tsPurple was first made and published by Josefine L. et al. from Anthony Foster's group at Uppsala University, Sweden [4]. We would like to thank Josefine and Anthony for kindly providing us with the his-tsPurple plasmid.</I> | |
| − | <br><br><br><br><br><br><br><br><br><br><br><br><br><br><br><br><br><br><br><br><br><br><br><br><br>< | + | <br><br> |
[1] Booth, William T., et al. “Impact of an N-Terminal Polyhistidine Tag on Protein Thermal Stability.” ACS Omega, vol. 3, no. 1, Jan. 2018, pp. 760–68, doi:10.1021/acsomega.7b01598.<br> | [1] Booth, William T., et al. “Impact of an N-Terminal Polyhistidine Tag on Protein Thermal Stability.” ACS Omega, vol. 3, no. 1, Jan. 2018, pp. 760–68, doi:10.1021/acsomega.7b01598.<br> | ||
| − | [2] Albani, J. R. “Chapter 2 - Fluorescence: Principles and Observables.” Structure and Dynamics of Macromolecules: Absorption and Fluorescence Studies, edited by J.R. Albani, Elsevier Science, 2004, pp. 55–98, doi:10.1016/B978-044451449-3/50002-2. | + | [2] Albani, J. R. “Chapter 2 - Fluorescence: Principles and Observables.” Structure and Dynamics of Macromolecules: Absorption and Fluorescence Studies, edited by J.R. Albani, Elsevier Science, 2004, pp. 55–98, doi:10.1016/B978-044451449-3/50002-2.<br> |
| − | [3] Abcam®, “A Guide to Fluorochromes”. Online, accessed on 2019-08-19. https://docs.abcam.com/pdf/immunology/fluorochrome_guide.pdf. | + | [3] Abcam®, “A Guide to Fluorochromes”. Online, accessed on 2019-08-19. [https://docs.abcam.com/pdf/immunology/fluorochrome_guide.pdf <link>]<br> |
| + | [4] Liljeruhm, Josefine et al. “Engineering a palette of eukaryotic chromoproteins for bacterial synthetic biology.” Journal of biological engineering vol. 12 8. 10 May. 2018, doi:10.1186/s13036-018-0100-0. | ||
| − | + | <br><br><br><br> | |
===Structure and SWISS MODEL Homology Modelling Report=== | ===Structure and SWISS MODEL Homology Modelling Report=== | ||
Latest revision as of 01:51, 22 October 2019
tsPurple, purple chromoprotein
This chromoprotein (also known as TinselPurple) naturally exhibits strong purple color when expressed.
Usage and Biology
This part is useful as a reporter.
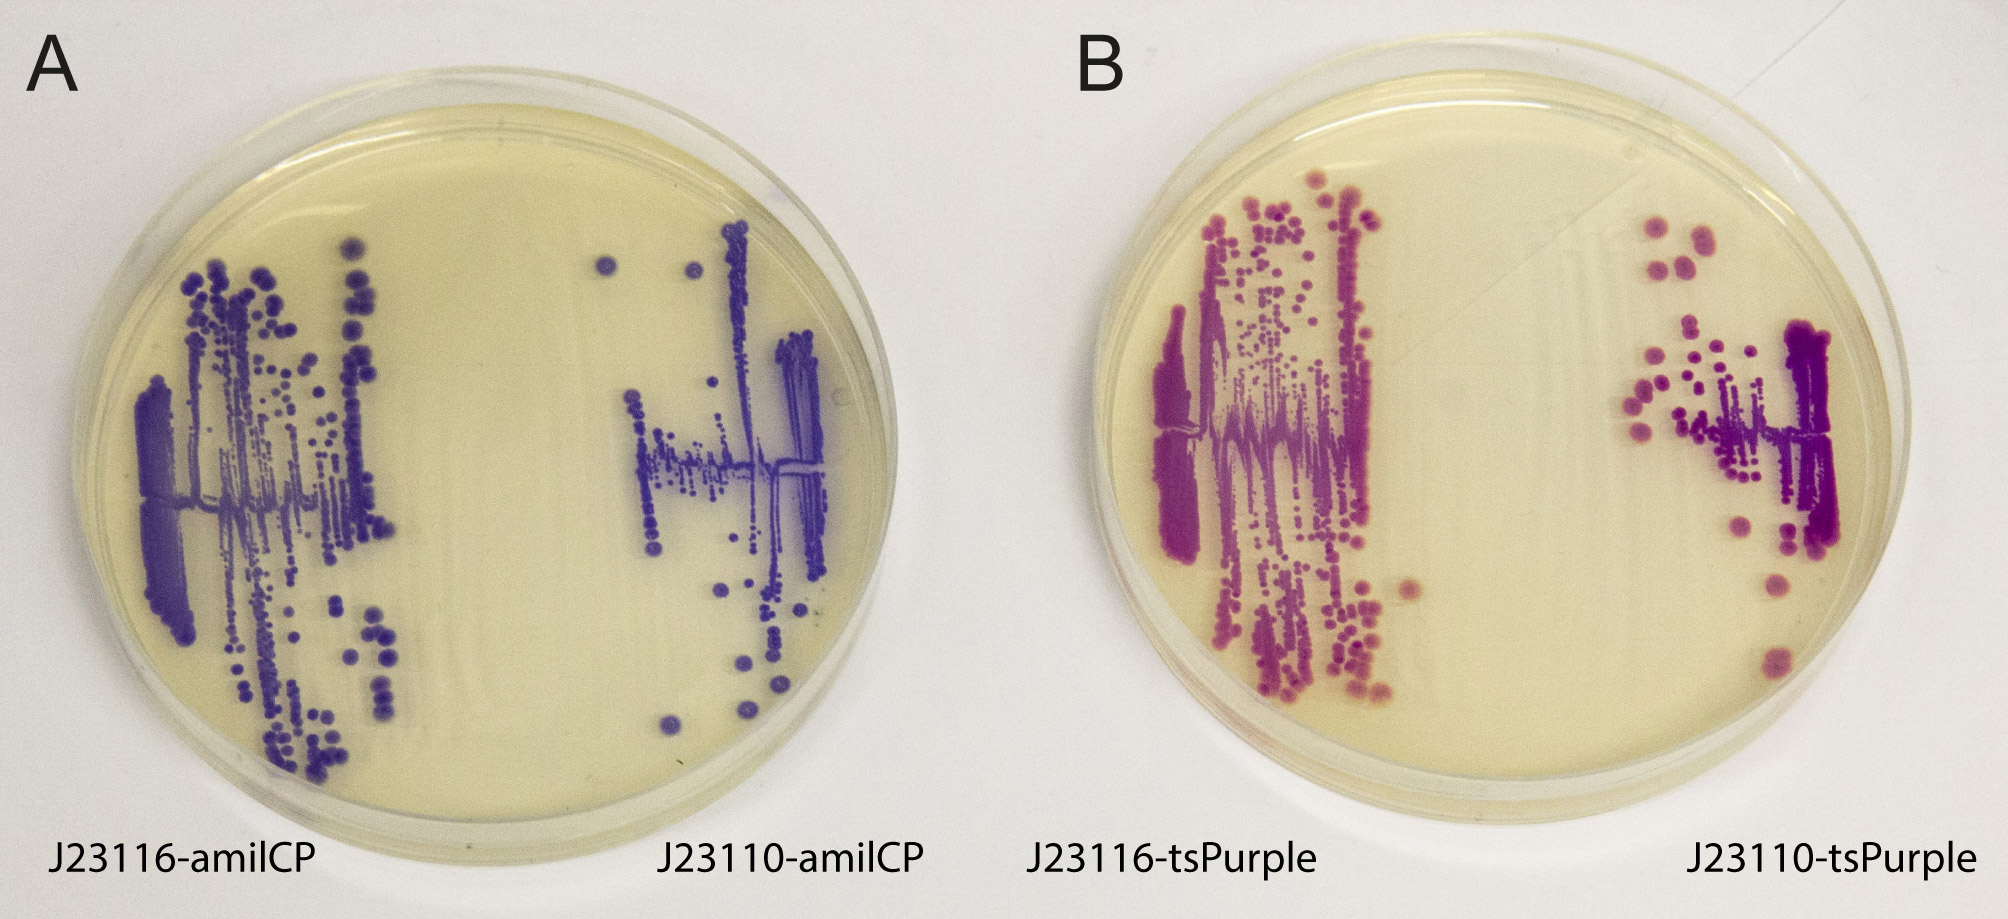
iGEM2013 Uppsala: The images above show E coli constitutively expressing the chromoproteins amilCP BBa_K592009 and tsPurple BBa_K1033906 from the high copy plasmid pSB1C3 from the promoters J23116 and J23110.
Sequence and Features
- 10COMPATIBLE WITH RFC[10]
- 12COMPATIBLE WITH RFC[12]
- 21COMPATIBLE WITH RFC[21]
- 23COMPATIBLE WITH RFC[23]
- 25COMPATIBLE WITH RFC[25]
- 1000COMPATIBLE WITH RFC[1000]
Contribution
Group: iGEM19_Uppsala_Universitet
Author: Qian Shi
Summary: We characterized tsPurple's absorption and emission spectra.
We expressed tsPurple with a his-tag in E. coli DH5α cells using the high copy pSB1C3 vector with the BBa_J23110 promoter. We selected and cultured two different tsPurple expressing colonies, lysed them, and used
affinity chromatography with Ni-NTA-agarose to purify two separate samples of his-tsPurple.
Purification results and Mw determination:
After purification, the protein is seen as a band at a size of approximately 28 kDa on 10 % SDS-PAGE gels of both samples (Figure 1.). Considering that the his-tag adds roughly 2.5 kDa [1] to the total weight of the protein, we can conclude that tsPurple’s molecular weight is around 25.5 kDa, this result is consistent with SVCE_Chennai iGEM-2016 team’s computational data.
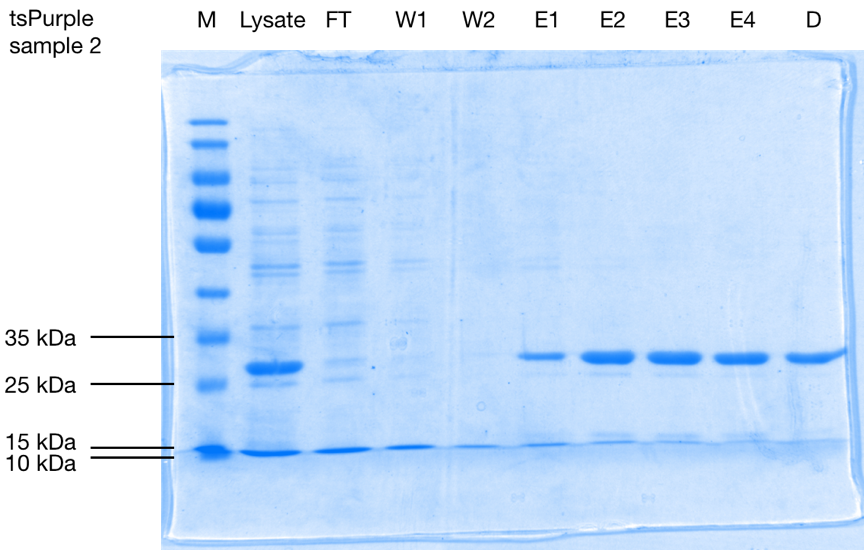
SDS-PAGE analysis of affinity purification steps of the his-tagged protein from E. coli cell lysate, flow-through (F), wash 1 (W1), wash 2 (W2), elutions 1-4 (E1-E4), and elute 3 after dialysis for buffer exchange (D) on 10 % SDS-PAGE stained with Coomassie Blue. Purified tsPurple is seen as a band at a size of approximately 28 kDa.
We used Bradford assay to determine protein concentration in both samples and measured their fluorescence spectra. For absorption spectrum, we concentrated the protein samples 10x with Amicon Ultra-0.5 mL Centrifugal Filters (3K) to get better absorption peaks.
Excitation is equivalent to absorption as it brings a molecule to its excited state Sn. Thus when there is no interference from impurities in the solution, the excitation and the absorption spectra of a fluorophore should be identical [2]. Our results showed, indeed, that both are at 588 nm. While the emission peak was at 624 nm (when excited at 540 nm) (Figure 2a, 2b, 2c).
We chose a LacI fused cy3 fluorophore as our positive control for fluorescence measurement. Cy3 has an excitation peak at 550 nm and an emission peak at 570 nm [3], the closest to tsPurple’s peaks among all the fluorophores that we had in hand. Through absorbance measurements at 540 nm, we normalized LacI-cy3 and tsPurple’s concentrations to the same value: Abs540 = 0.03. As can be seen from the comparison in Figure 2d, tsPurple is a non-fluorescent protein.
Absorbance, excitation and emission spectra:
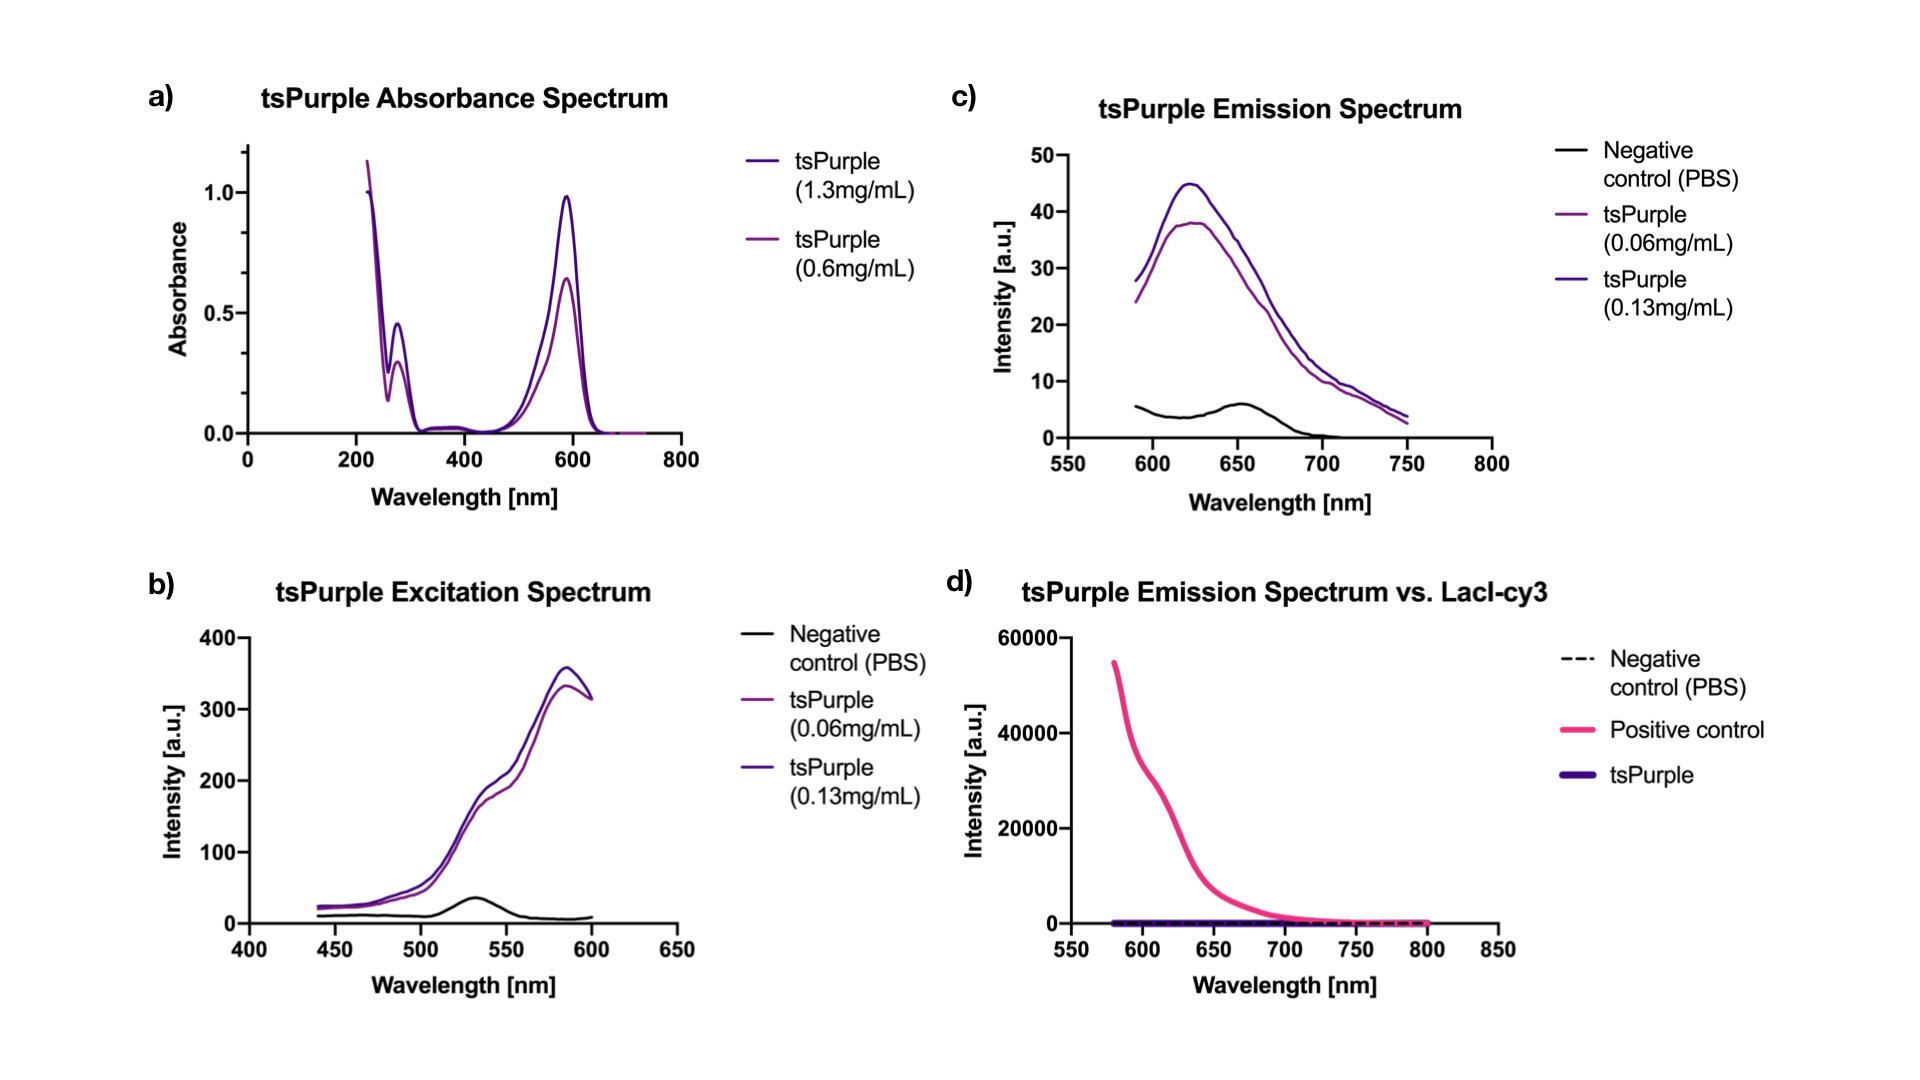
Fluorescence measurements were done using the microplate reader model Tecan Spark 10M in a flat black 384, low volume plate with non-binding surface. The measurements were made in a range of 440-750 nm. Absorbance measurements were done using Nanodrop 2000 (UV-vis), blanked against PBS buffer, in a range of 200-750 nm.
* His-tsPurple was first made and published by Josefine L. et al. from Anthony Foster's group at Uppsala University, Sweden [4]. We would like to thank Josefine and Anthony for kindly providing us with the his-tsPurple plasmid.
[1] Booth, William T., et al. “Impact of an N-Terminal Polyhistidine Tag on Protein Thermal Stability.” ACS Omega, vol. 3, no. 1, Jan. 2018, pp. 760–68, doi:10.1021/acsomega.7b01598.
[2] Albani, J. R. “Chapter 2 - Fluorescence: Principles and Observables.” Structure and Dynamics of Macromolecules: Absorption and Fluorescence Studies, edited by J.R. Albani, Elsevier Science, 2004, pp. 55–98, doi:10.1016/B978-044451449-3/50002-2.
[3] Abcam®, “A Guide to Fluorochromes”. Online, accessed on 2019-08-19. <link>
[4] Liljeruhm, Josefine et al. “Engineering a palette of eukaryotic chromoproteins for bacterial synthetic biology.” Journal of biological engineering vol. 12 8. 10 May. 2018, doi:10.1186/s13036-018-0100-0.
Structure and SWISS MODEL Homology Modelling Report
(The following information has been contributed by SVCE_Chennai iGEM-2016)
The following sections give a detailed information on this chromoprotein done by its in silico analysis.
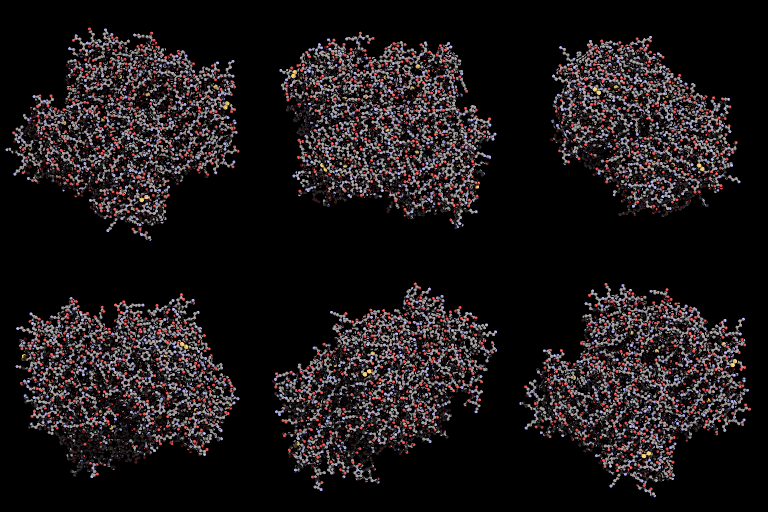
3D Structure
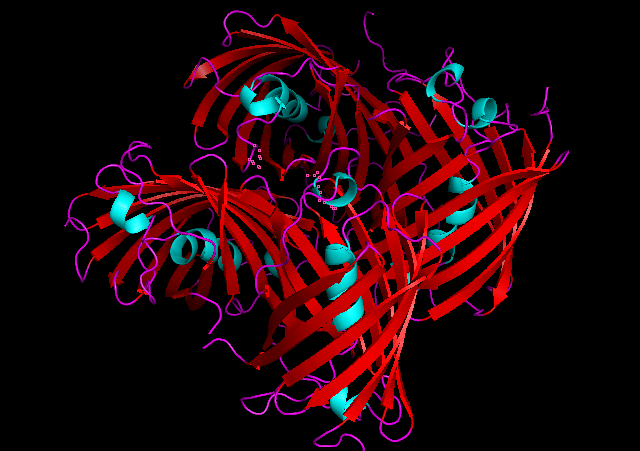
Cartoon representation of tsPurple.
The best match during structure prediction.
| Template | Seq. Identity | Oligo-state | Found by | Method | Resolution | Seq Similarity | Range | Coverage | Description |
|---|---|---|---|---|---|---|---|---|---|
| 4ohs.1.A | 86.61 | homotetramer | HHblits | X-Ray | 2.19Å | 0.58 | 2 - 222 | 0.98 | FAR-RED FLUORESCENT PROTEIN AQ143 |
What about Ligands?
| Ligand | Added to Model | Description |
|---|---|---|
| CL | ✕ - Not biologically relevant. | CHLORIDE ION |
| CL | ✕ - Not biologically relevant. | CHLORIDE ION |
| CL | ✕ - Not biologically relevant. | CHLORIDE ION |
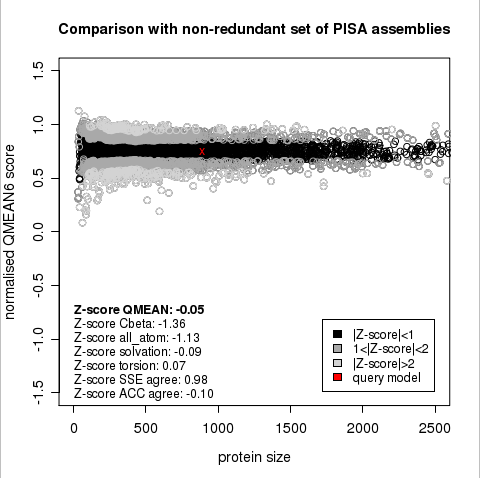
Plot 1
Plot 2
Plot 3
Plot 1
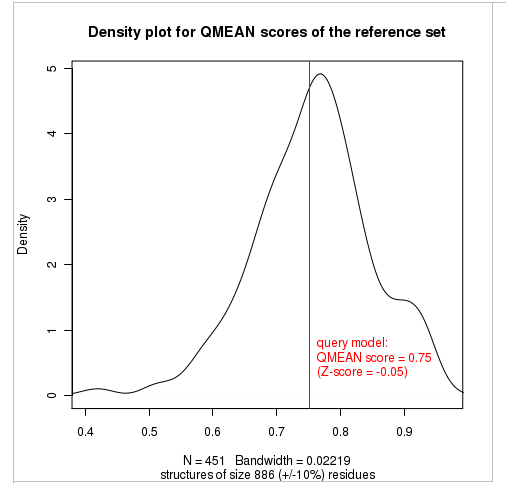
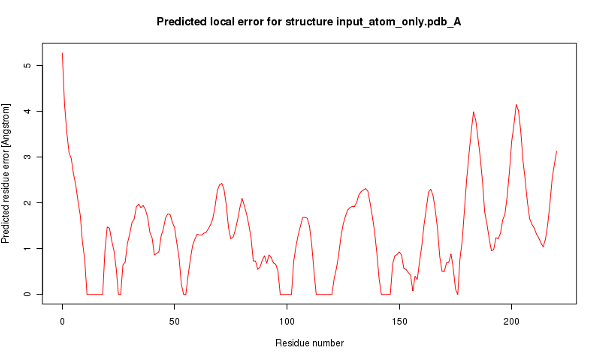
The area built by the circles colored in different shades of grey in the plot on the left hand side represent the QMEAN scores of the reference structures from the PDB. The model's QMEAN score is compared to the scores obtain for experimental structures of similar size (model size +/- 10%) and a Z-score is calculated. A Z-score (or standard score) is a score which is normalised to mean 0 and standard deviation 1. Thus the QMEAN Z-score directly indicates how many standard deviations the model's QMEAN score differs from expected values for experimental structures. In analogy, Z-scores are calculated for all four statistical potential terms as well as the agreement terms being part of the QMEAN score.
Plot 2
The plot in the middle shows the density plot (based on the QMEAN score) of all reference models used in the Z-score calculation. The location of the query model with respect to the background distribution is marked in red. This plot basically is a "projection" of the first plot for the given protein size. The number of reference models used in the calculation is shown at the bottom of the plot.
Plot 3
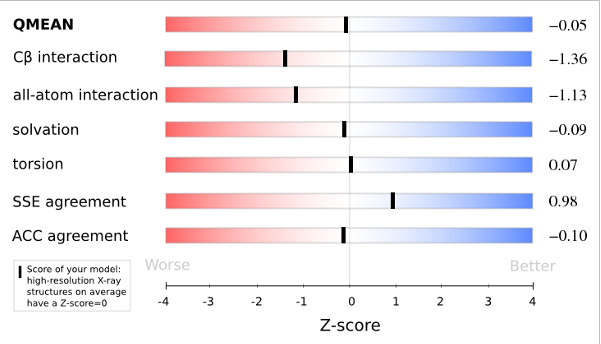
The analysis of these Z-scores of the individual terms can help identifying the geometrical features responsible for an observed large negative QMEAN Z-score. Models of low quality are expected to have strongly negative Z-scores for QMEAN but also for most of the contributing terms. Large negative values correspond to red regions in the color gradient. "Good structures" are expected to have all sliders in the light red to blue region.”
The QMEAN6 score is a composite score consisting of a linear combination of 6 terms (estimated model reliability between 0-1). The pseudo-energies of the contributing terms are given below together with their Z-scores with respect to scores obtained for high-resolution experimental structures of similar size solved by X-ray crystallography:
| Scoring Function Term | Raw Score | Z Score |
|---|---|---|
| Cβ Interaction Energy | -31.74 | -1.36 |
| All Atom Pairwise Energy | -17397.90 | -1.13 |
| Solvation Energy | -87.05 | -0.09 |
| Torsion Angle Energy | -244.66 | 0.07 |
| Secondary Structure Agreement | 86.8% | 0.98 |
| Solvent Accessibility Agreement | 79.6% | -0.10 |
| QMEAN6 score | 0.751 | -0.05 |
Ramachandran Plot- SWISS MODEL Workspace
(The following information has been contributed by SVCE_Chennai iGEM-2016)
A score of 93.3% in the most favoured regions as seen in the Ramachandran plot shows that the above predicted model of Tinsel Purple chromoprotein is a very good prediction.
ProtParam Results
(The following information has been contributed by SVCE_Chennai 2016)
Number of amino acids: 228
Molecular weight: 25546.26
Theoretical pI: 6.65
Total number of negatively charged residues (Asp + Glu): 27
Total number of positively charged residues (Arg + Lys): 26
Atomic composition:
Carbon (C) - 1134
Hydrogen (H) - 1747
Nitrogen (N) - 303
Oxygen (O) - 334
Sulfur (S) - 18
Formula: C1134H1747N303O334S18
Total number of atoms: 3536
Extinction coefficients:
Extinction coefficients are in units of M-1 cm-1, at 280 nm measured in water.
Ext. coefficient : 24910
Abs 0.1% (=1 g/l): 0.975, assuming all pairs of Cys residues form cystines
Ext. coefficient : 24410
Abs 0.1% (=1 g/l): 0.956, assuming all Cys residues are reduced
Estimated half-life:
The N-terminal of the sequence considered is M (Met).
The estimated half-life is: 30 hours (mammalian reticulocytes, in vitro).
>20 hours (yeast, in vivo).
>10 hours (Escherichia coli, in vivo).
Instability index:
The instability index (II) is computed to be 31.19
This classifies the protein as stable.
Aliphatic index: 61.97
Grand average of hydropathicity (GRAVY): -0.395
ExPASy Peptide Cutter Results
(The following information has been contributed by SVCE_Chennai iGEM-2016)
The following enzymes cleave the chromoprotein.
| Name of enzyme | No. of cleavages | Positions of cleavage sites |
|---|---|---|
| Arg-C proteinase | 9 | 42 44 92 150 175 179 181 198 219 |
| Asp-N endopeptidase | 9 | 7 55 77 97 106 150 165 195 221 |
| Asp-N endopeptidase + N-terminal Glu | 27 | 7 15 28 30 35 46 55 77 81 85 90 96 97 106 110 140 144 150 165 190 195 199 204 210 213 221 224 |
| BNPS-Skatole | 2 | 90 140 |
| CNBr | 10 | 1 9 13 15 41 63 133 146 160 189 |
| Chymotrypsin-high specificity (C-term to [FYW], not before P) | 21 | 22 24 35 53 55 64 69 79 80 88 90 96 117 140 178 192 194 209 210 213 220 |
| Chymotrypsin-low specificity (C-term to [FYWML], not before P) | 49 | 1 4 9 13 15 22 23 24 35 41 53 55 58 64 69 72 79 80 88 90 96 102 105 110 115 117 122 133 140 146 147 154 159 160 162 169 170 173 174 178 192 193 194 197 202 209 210 213 220 |
| Clostripain | 9 | 42 44 92 150 175 179 181 198 219 |
| Formic acid | 9 | 8 56 78 98 107 151 166 196 222 |
| Glutamyl endopeptidase | 18 | 16 29 31 36 47 82 86 91 97 111 141 145 191 200 205 211 214 225 |
| Hydroxylamine | 2 | 20 129 |
| Iodosobenzoic acid | 2 | 90 140 |
| LysC | 17 | 6 7 12 25 33 67 71 81 118 120 135 136 163 182 203 208 226 |
| LysN | 17 | 5 6 11 24 32 66 70 80 117 119 134 135 162 181 202 207 225 |
| NTCB (2-nitro-5-thiocyanobenzoic acid) | 8 | 9 25 60 61 113 142 154 163 |
| Pepsin (pH1.3) | 43 | 3 4 23 24 34 52 54 55 57 68 79 80 84 87 88 95 96 101 102 109 110 114 115 121 126 146 153 154 158 159 161 162 169 170 173 174 192 193 194 201 202 208 209 |
| Pepsin (pH>2) | 57 | 3 4 21 22 23 24 34 52 54 55 57 63 64 68 79 80 84 87 88 89 90 95 96 101 102 109 110 114 115 116 117 121 126 139 146 148 153 154 158 159 161 162 169 170 173 174 178 192 193 194 201 202 208 209 212 213 220 |
| Proline-endopeptidase [*] | 2 | 34 183 |
| Proteinase K | 107 | 2 4 5 11 14 16 18 19 22 24 27 29 31 35 36 38 43 45 46 47 51 53 54 55 57 58 59 64 68 69 70 73 76 79 80 82 84 86 88 89 90 91 93 95 96 97 101 102 103 104 108 110 111 115 116 117 119 121 122 124 126 128 132 137 138 140 141 144 145 147 148 153 154 159 161 162 165 170 171 174 176 177 178 186 187 191 192 194 199 200 201 202 204 205 209 210 211 213 214 216 217 218 220 223 225 227 228 |
| Staphylococcal peptidase I | 18 | 16 29 31 36 47 82 86 91 97 111 141 145 191 200 205 211 214 225 |
| Thermolysin | 59 | 1 3 4 10 12 14 18 23 26 34 40 42 44 52 53 54 57 62 68 69 72 79 87 94 95 100 101 103 109 114 115 118 120 121 127 131 132 137 143 146 152 153 158 159 160 161 169 173 185 186 193 198 201 203 208 215 216 217 226 |
| Trypsin | 24 | 6 7 12 25 42 44 67 71 81 92 118 120 135 136 150 163 175 179 181 198 203 208 219 226 |
These enzymes do not cut the chromoprotein.
Caspase1
Caspase10
Caspase2
Caspase3
Caspase4
Caspase5
Caspase6
Caspase7
Caspase8
Caspase9
Enterokinase
Factor Xa
GranzymeB
Thrombin
Tobacco etch virus protease
References
1. Benkert, P., Schwede, T. and Tosatto, S.C.E. (2009). QMEANclust: Estimation of protein model quality by # combining a composite scoring function with structural density information. BMC Struct Biol. 2009 May 20;9:35. If you publish results using DSSP, please cite the following paper: Dictionary of protein secondary structure: Pattern recognition of hydrogen bonded and geometrical features, Biopolymers 22:2577-2637
2. Benkert P, Biasini M, Schwede T. (2011). "Toward the estimation of the absolute quality of individual protein structure models." Bioinformatics, 27(3):343-50.
3. Arnold K., Bordoli L., Kopp J., and Schwede T. (2006). The SWISS-MODEL Workspace: A web-based environment for protein structure homology modelling. Bioinformatics, 22,195-201.

