
Difference between revisions of "Part:BBa K3113302"
Theresakeil (Talk | contribs) |
Theresakeil (Talk | contribs) |
||
| (25 intermediate revisions by 2 users not shown) | |||
| Line 3: | Line 3: | ||
<partinfo>BBa_K3113302 short</partinfo> | <partinfo>BBa_K3113302 short</partinfo> | ||
| − | This plasmid codes for the coat protein | + | This plasmid codes for the Gag coat-protein fused to an RNA-binding protein with a split luciferase tag in between. This construct forms virus-like particles (VLPs), which can be detected via a split luciferase assay. Through the RNA binding protein, the vesicles can be loaded with RNA. |
<h2>Usage</h2> | <h2>Usage</h2> | ||
| − | pCAG_GAG-HiBit-L7Ae construct is a Composite part that has been designed to achieve VLP formation inside | + | pCAG_GAG-HiBit-L7Ae construct is a Composite part that has been designed to achieve VLP formation inside mammalian cells and enable the transport of chosen RNA information inside vesicles through L7Ae-C/D box interaction (<html>together with construct <a href="https://parts.igem.org/Part:BBa_K3113301">BBa_K3113301</a> and <a href="https://parts.igem.org/Part:BBa_K3113303">BBa_K3113303</a></html>). |
<h2>Biology</h2> | <h2>Biology</h2> | ||
| − | Gag-p24 is the group specific antigen from the lentivirus HIV. It assembles at the plasma membrane and leads to | + | Gag-p24 is the group-specific antigen from the lentivirus HIV. It assembles at the plasma membrane and leads to budding of vesicles.<ref>HIV-1 Gag: a Molecular Machine Driving Viral Particle Assembly and Release Heinrich G. Göttlinger Department of Cancer Immunology and AIDS, Dana-Farber Cancer Institute, and Department of Pathology, Harvard Medical School, Boston</ref> <br> |
| − | “The Nano-Glo® HiBiT | + | “The Nano-Glo® HiBiT Extracellular Detection System quantifies cellular protein in minutes with high sensitivity and a broad dynamic range using a simple add-mix-read assay format.”<ref>https://www.promega.de/products/protein-quantitation-and-detection/protein-quantitation/nano-glo-hibit-extracellular-detection-system/?catNum=N2420</ref> The HiBiT peptide is an 11 amino acid long tag that can be fused to a protein of interest. The tagged protein can be measured with the Nano-Glo® HiBiT Detection Reagent which contains the LgBiT. Together with the HiBiT, the LgBiT forms a functioning luminescent NanoBiT® enzyme.<br> |
The archaeal L7Ae and eukaryotic 15.5kD protein homologs are members of the L7Ae/15.5kD protein family that characteristically recognize K-turn motifs found in both archaeal and eukaryotic RNAs. In Archaea, the L7Ae protein uniquely binds the K-loop motif found in box C/D.<ref>Gagnon, Keith T et al. “Signature amino acids enable the archaeal L7Ae box C/D RNP core protein to recognize and bind the K-loop RNA motif.” RNA (New York, N.Y.) vol. 16,1 (2010): 79-90. doi:10.1261/rna.1692310</ref> | The archaeal L7Ae and eukaryotic 15.5kD protein homologs are members of the L7Ae/15.5kD protein family that characteristically recognize K-turn motifs found in both archaeal and eukaryotic RNAs. In Archaea, the L7Ae protein uniquely binds the K-loop motif found in box C/D.<ref>Gagnon, Keith T et al. “Signature amino acids enable the archaeal L7Ae box C/D RNP core protein to recognize and bind the K-loop RNA motif.” RNA (New York, N.Y.) vol. 16,1 (2010): 79-90. doi:10.1261/rna.1692310</ref> | ||
| − | The | + | The K-turn is a ubiquitous structural motif in RNA, forming a very tight kink in the axis of helical RNA that plays an important role in many aspects of RNA function. L7Ae is a member of a superfamily of proteins that bind K-turns in RNA, stabilizing the tightly kinked conformation. They are extremely widespread and are important in the assembly of RNA–protein complexes central to translation, splicing and site-specific RNA modification. <ref>Lilley, D. M. J. (2019). "The L7Ae proteins mediate a widespread and highly functional protein–RNA interaction." The Biochemist 41(2): 40-44.</ref> |
| Line 21: | Line 21: | ||
<h3>Transmission Electron Microscopy (TEM)</h3> | <h3>Transmission Electron Microscopy (TEM)</h3> | ||
| + | To validate that our vesicles are intact and properly shaped, we prepared purified VLPs and exosomes for transmission electron microscopy (TEM). This microscopy technique is based on a high-energy beam of electrons shining through a very thin sample fixed on a grid and allows high-resolution imaging. | ||
| − | + | <html> | |
| − | + | <figure class="figure"> | |
| + | <img src="https://2019.igem.org/wiki/images/a/a4/T--Munich--TEM_VLP_HEK_loaded_vs_unlaoded.png" width="400" height="360" class="figure-img img-fluid rounded" alt="Size distribution frequency of VLPs in HEK293T"> | ||
| + | <figcaption class="figure-caption"><b> | ||
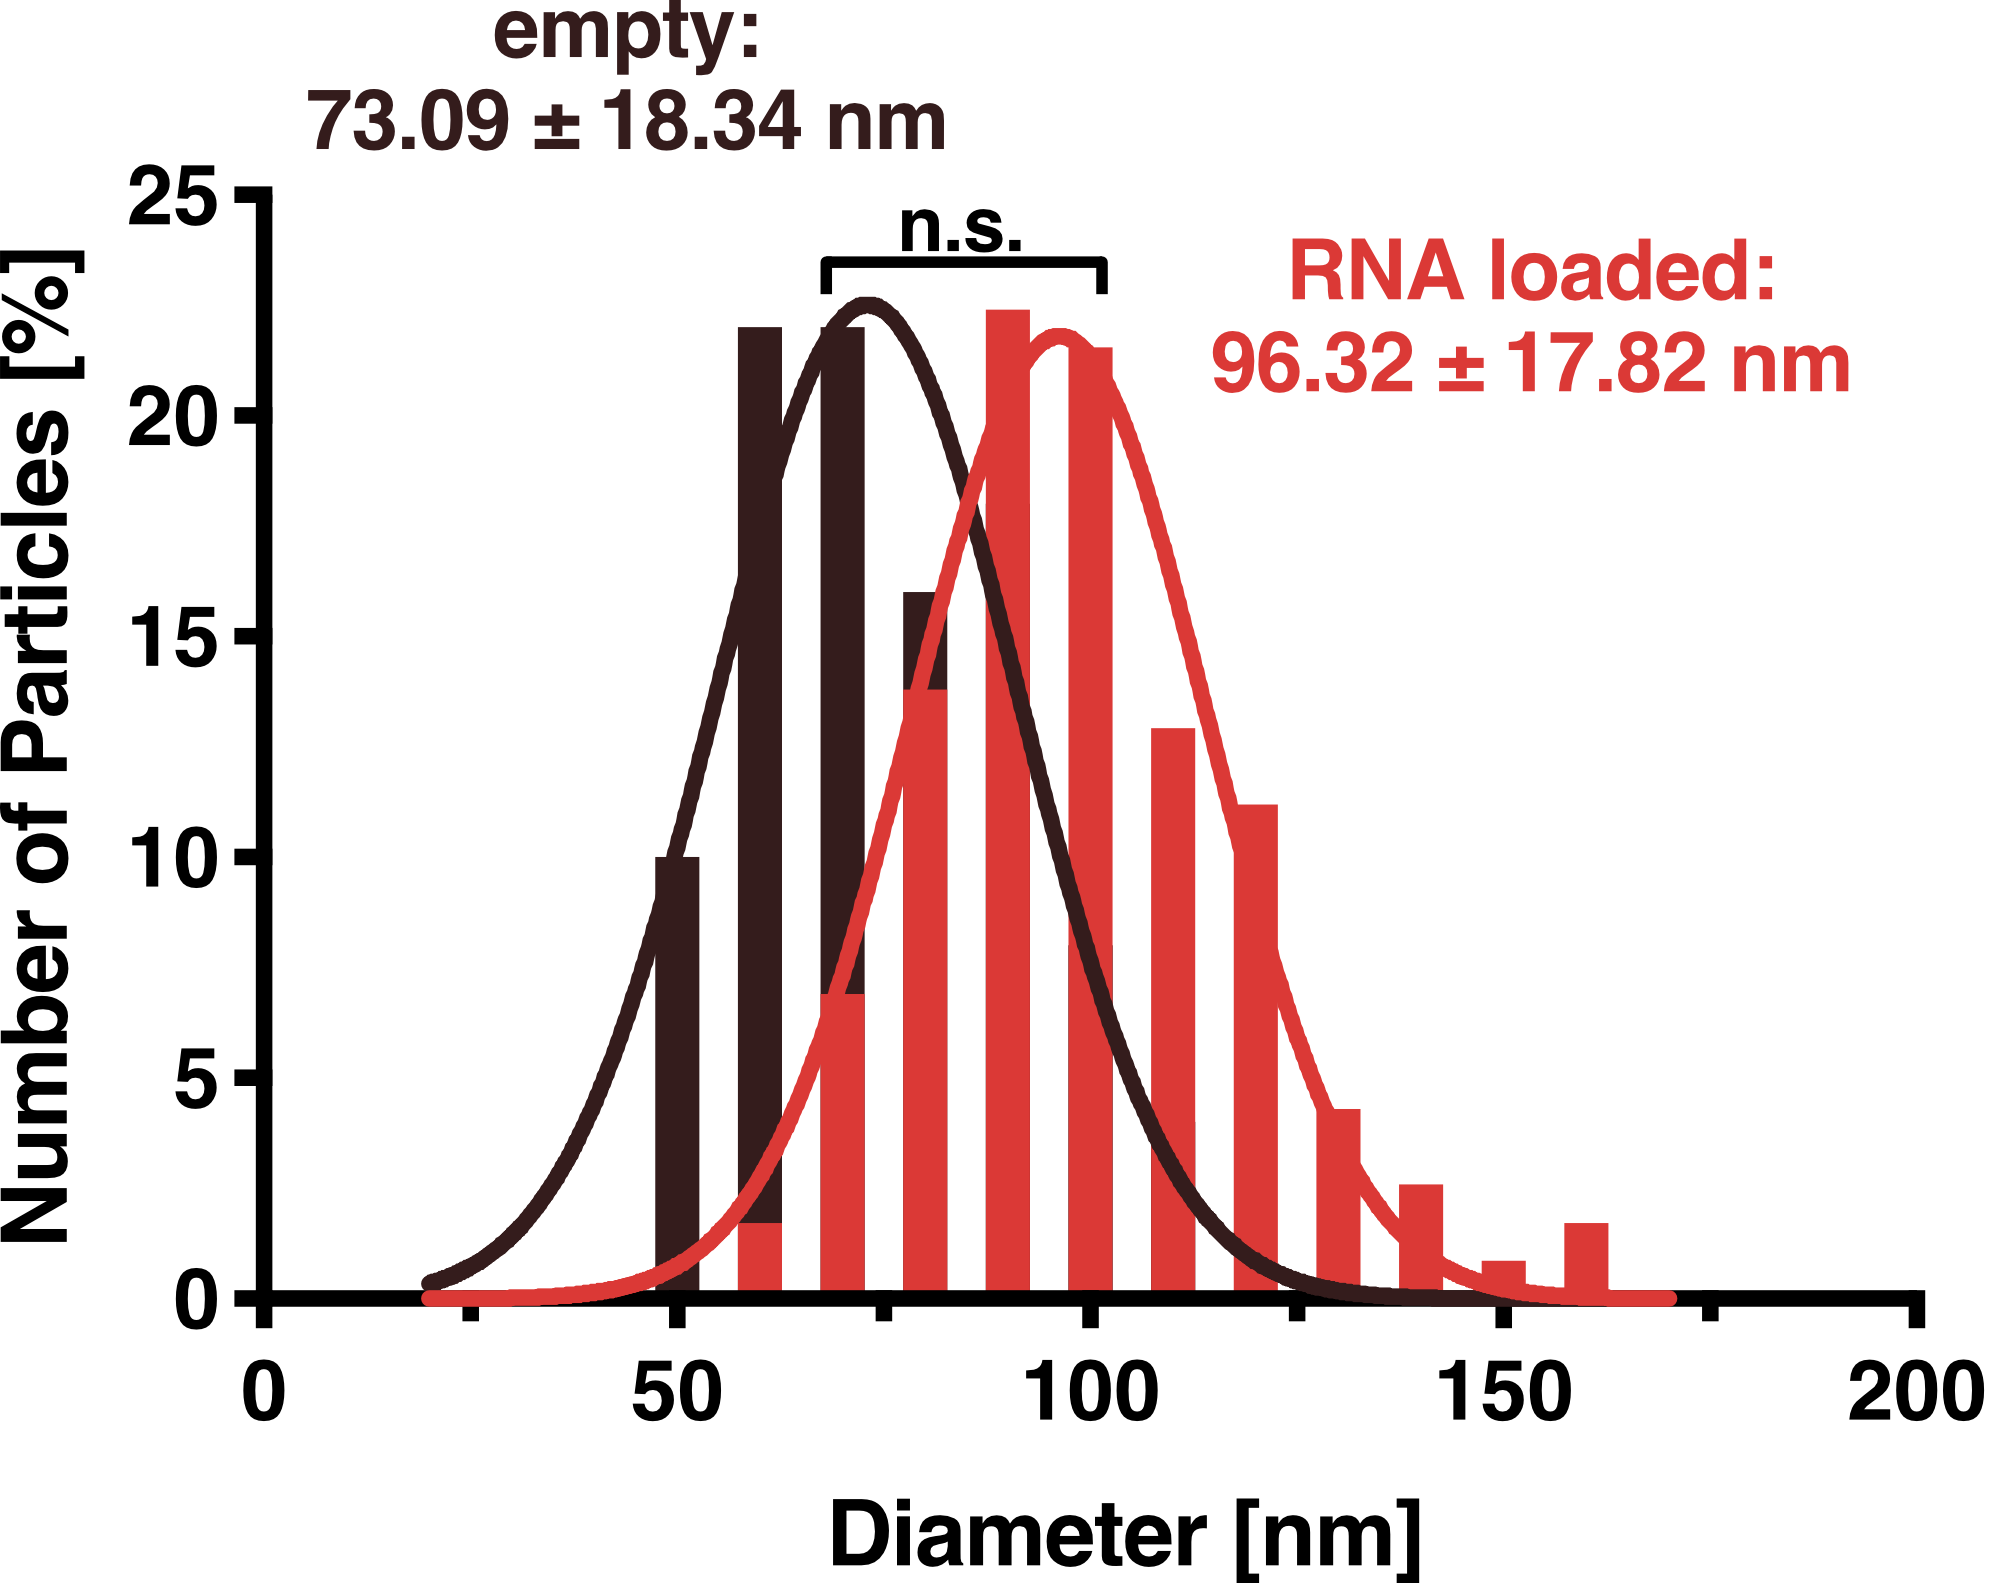
| + | Figure 1: Analysis of particle diameter distribution for VLPs secreted from HEK293T cells.</b> Results have been calculated from 50 (unloaded, red) and 116 (loaded, blue) particles, respectively. The inset shows exemplary particles as seen in TEM highlighted with dashed lines (scalebar 100 nm). A Gaussian fit was performed on the data and the average diameter was calculated as 72 nm and 96 nm for unloaded and loaded VLPs, respectively. | ||
| + | </figcaption> | ||
| + | </figure> | ||
| + | </html> | ||
<h3>Dynamic Light Scattering (DLS)</h3> | <h3>Dynamic Light Scattering (DLS)</h3> | ||
| − | To | + | To further characterize our vesicles and determine the size distribution and sample homogeneity, we performed Dynamic Light Scattering (DLS) to determine the size and shape of our vesicles.<br> |
| + | DLS measurements of Virus-like particles showed a narrow Gaussian size distribution indicating that the samples are very homogenous. Interestingly, a shift of about 30 nm is seen between cargo-loaded and unloaded VLPs; cargo-loaded particles have a mean diameter of 104 ± 14 nm, whereas unloaded vesicles showed a mean diameter of 71 ± 11 nm. | ||
| + | <html> | ||
| + | <figure class="figure"> | ||
| + | <img src="https://2019.igem.org/wiki/images/1/1e/T--Munich--VLP_DLS_HEK_empty_vs_loaded.png" width="400" height="360" class="figure-img img-fluid rounded" alt="Size distribution frequency of VLPs in HEK293T"> | ||
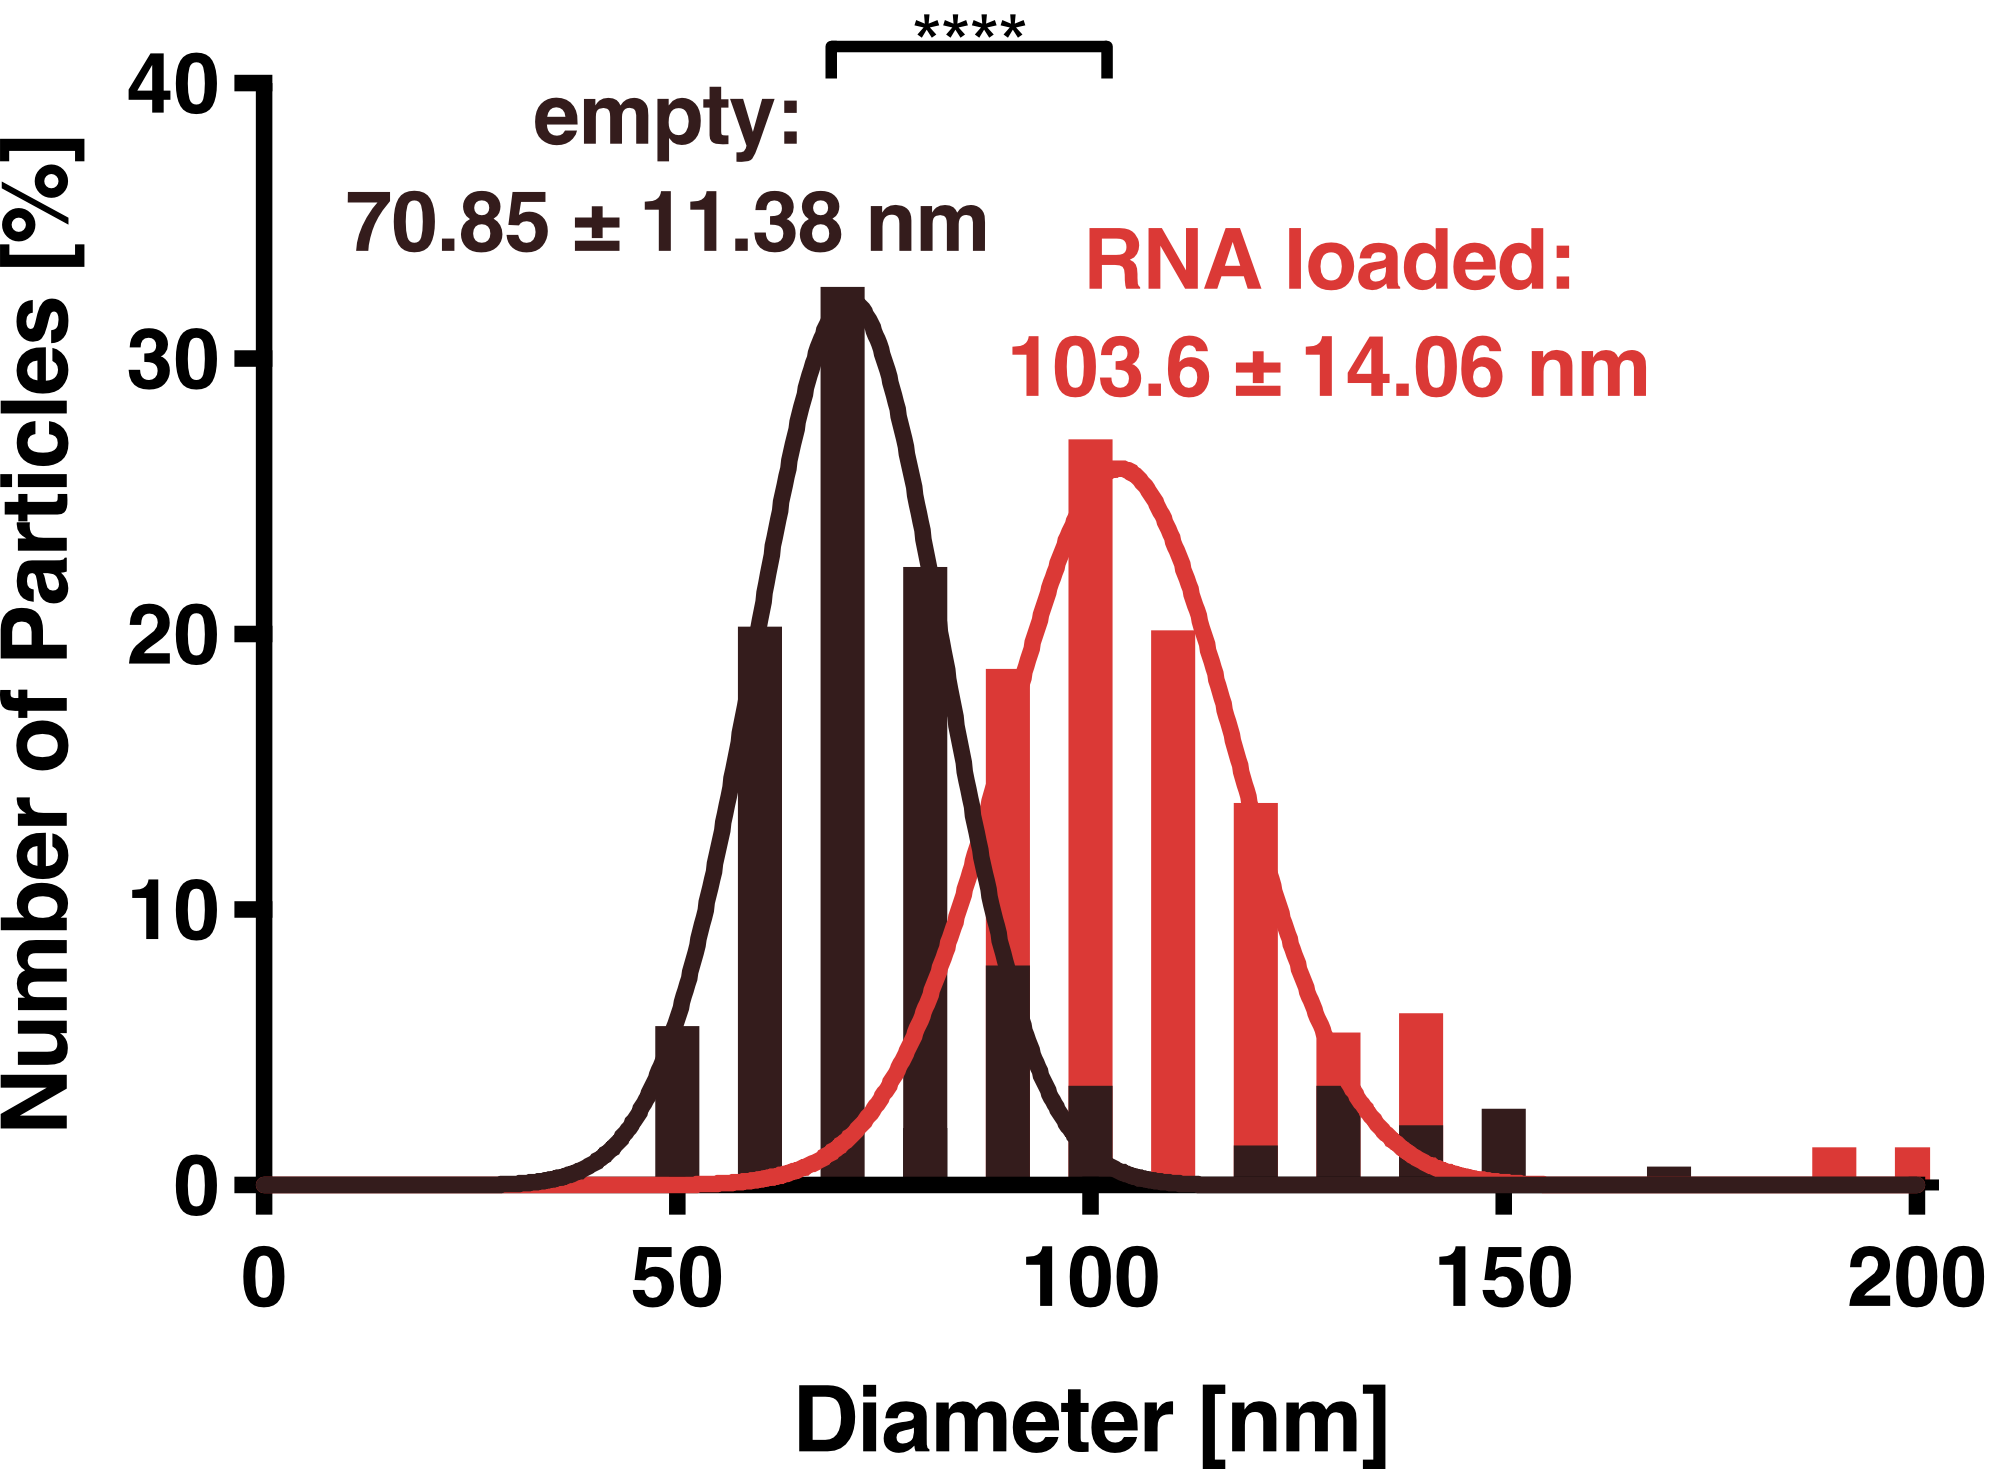
| + | <figcaption class="figure-caption"><b>Figure 2: Dynamic light scattering (DLS) measurement of VLPs.</b> Purified VLPs either with or without the adapter protein L7Ae, were measured. Unloaded and loaded vesicles showed a narrow size distribution with mean diameters of 71 and 104 nm, respectively. | ||
| + | |||
| + | </figcaption> | ||
| + | </figure> | ||
| + | </html> | ||
| + | |||
<h3>Split-luciferase bioluminescent assay: The HiBiT Assay</h3> | <h3>Split-luciferase bioluminescent assay: The HiBiT Assay</h3> | ||
| − | To prove that the BioBrick Part we designed works as expected, we performed a HiBit split-luciferase assay, which shows luminescent signal detected in fully formed VLPs. On the graph below the data shows that engineered Gag protein has been expressed in HEK293T | + | To prove that the BioBrick Part we designed works as expected, we performed a HiBit split-luciferase assay, which shows luminescent signal detected in fully formed VLPs. On the graph below, the data shows that engineered Gag protein has been expressed in HEK293T cells. Further on, based on this data, we have calculated the export to be in approx. 50% for transfection with as well as without adapter construct. Conclusivelly, we report Gag has successfully assembled into VLPs. |
<html> | <html> | ||
<figure class="figure"> | <figure class="figure"> | ||
| − | <img src="https://2019.igem.org/wiki/images/ | + | <img src="https://2019.igem.org/wiki/images/e/ec/T--Munich--Secretionefficiency_2.png" width="auto" height="360" class="figure-img img-fluid rounded" alt="A generic square placeholder image with rounded corners in a figure."> |
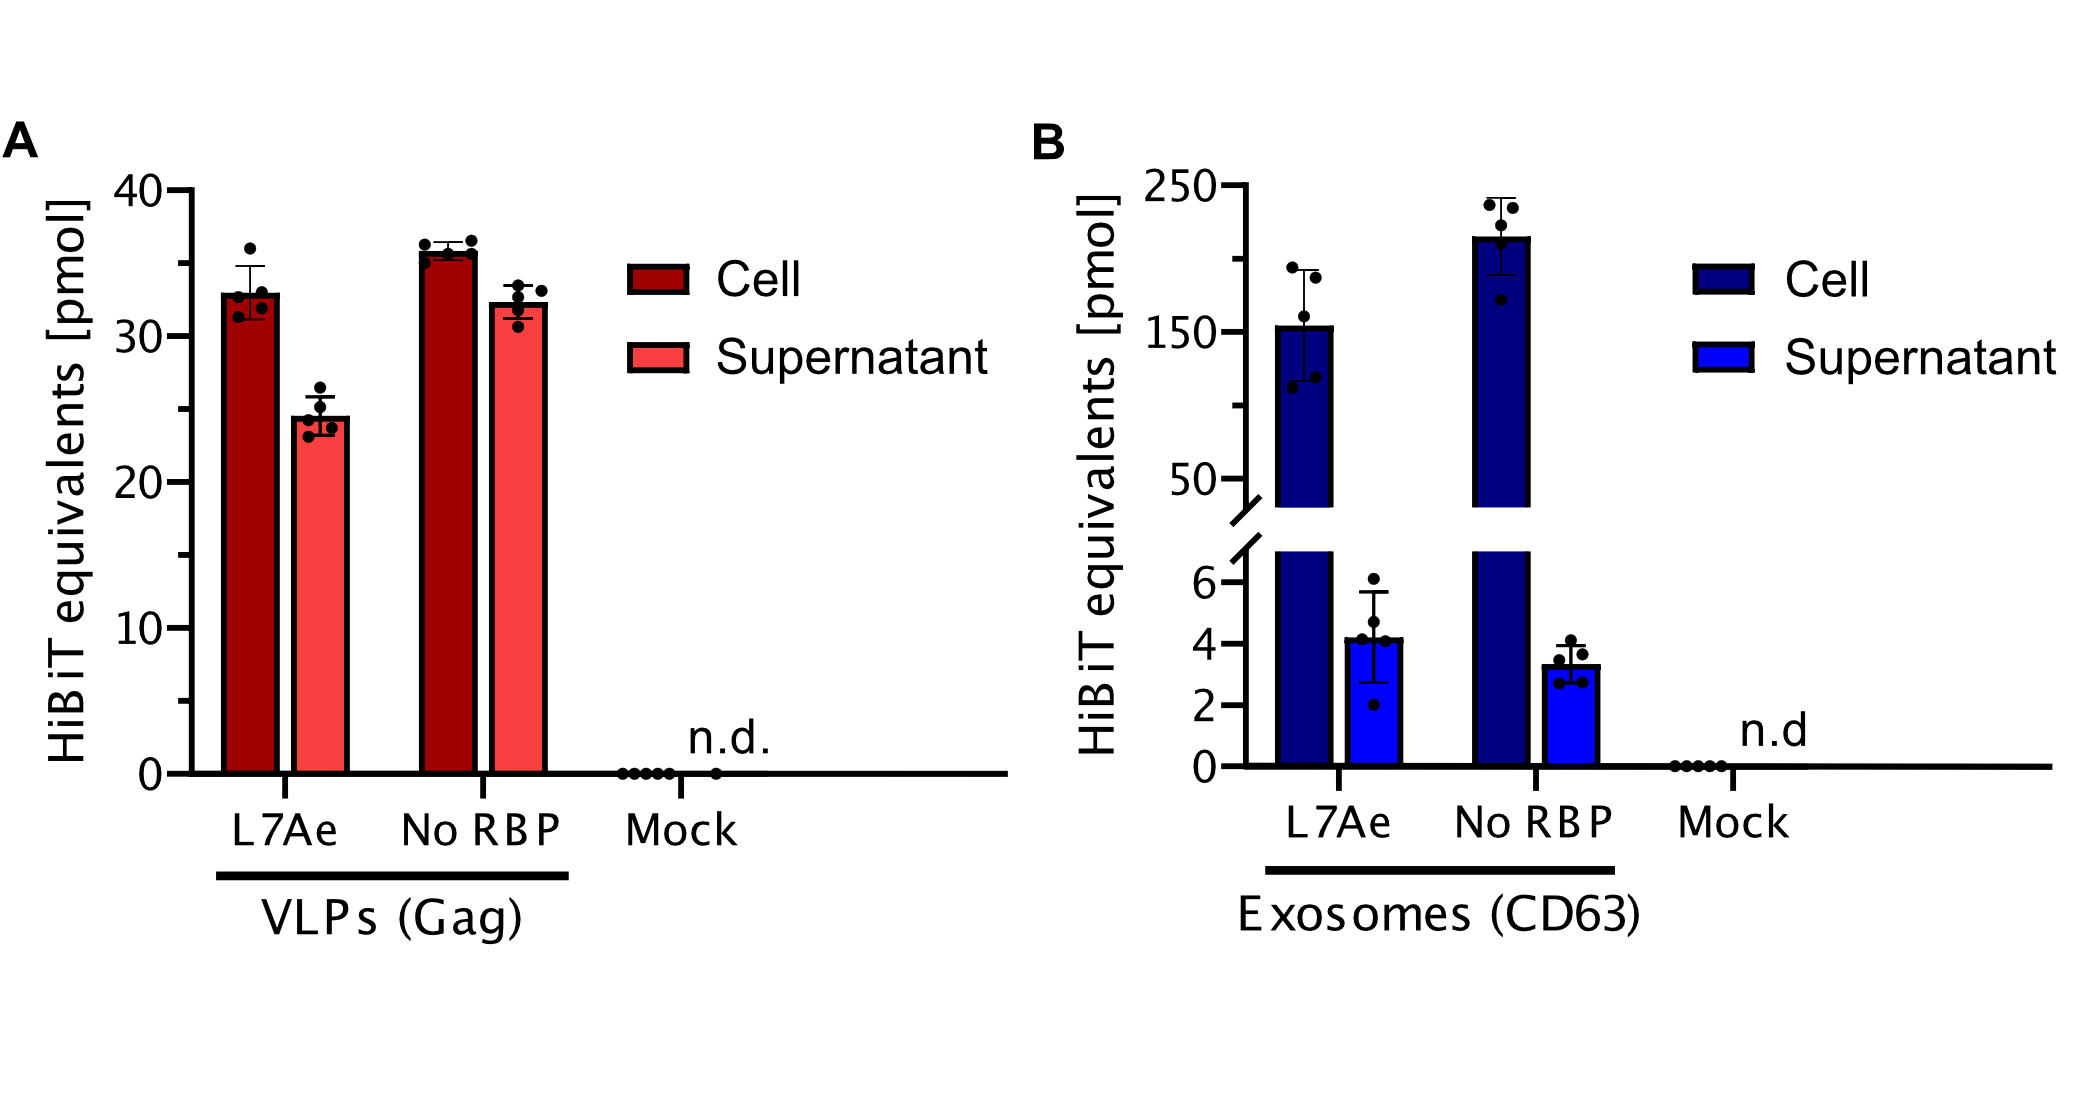
| − | <figcaption class="figure-caption"><b>Figure 3:Secretion efficiency of Gag vesicles calculated from HiBiT-measurements.</b> Vesicles containing the adapter L7Ae as well as empty vesicles lacking the RNA binding protein (RBP) were secreted from HEK293T cells with comparable efficiency. In contrast, control samples transfected with mock DNA did not show any secretion. Measurements were performed for n = 6 biological replicates in a 96-well format. | + | <figcaption class="figure-caption"><b>Figure 3: Secretion efficiency of Gag vesicles calculated from HiBiT-measurements.</b> Vesicles containing the adapter L7Ae as well as empty vesicles lacking the RNA binding protein (RBP) were secreted from HEK293T cells with comparable efficiency. In contrast, control samples transfected with mock DNA did not show any secretion. Cell signal shown in absolute values corresponds to extrapolated cellular content data. Absolute supernatant values are calculated by subtracting extrapolated values from unlysed supernatant from corresponding lysed supernatant values. Measurements were performed for n = 6 biological replicates in a 96-well format. |
</figcaption> | </figcaption> | ||
| Line 50: | Line 67: | ||
| − | We have established Heparin affinity chromatography as our method of choice for VLP purification. Figure 4 shows an exemplary chromatogram of a purification run with an increasing NaCl gradient for elution. Fractions of 1 ml were collected for each NaCl concentration up to 2 M and analyzed with an HiBiT assay to determine the absolute amount of Gag. After elution, we collected another 10 fractions with 2 M NaCl. As can be seen, these fractions showed almost no HiBiT signal, indicating that all vesicles were eluted from the column. In total, approximately 4 % of the HiBiT signal was detected in the flow-through, 5% in the wash and 55% in the elution fraction. | + | We have established Heparin affinity chromatography as our method of choice for VLP purification. Figure 4 shows an exemplary chromatogram of a purification run with an increasing NaCl gradient for elution. Fractions of 1 ml were collected for each NaCl concentration up to 2 M and analyzed with an HiBiT assay to determine the absolute amount of Gag. After elution, we collected another 10 fractions with 2 M NaCl. As it can be seen, these fractions showed almost no HiBiT signal, indicating that all vesicles were eluted from the column. In total, approximately 4 % of the HiBiT signal was detected in the flow-through, 5% in the wash and 55% in the elution fraction. |
<html> | <html> | ||
<figure class="figure"> | <figure class="figure"> | ||
| − | <img src="https://2019.igem.org/wiki/images/ | + | <img src="https://2019.igem.org/wiki/images/0/0d/T--Munich--VLP_L7Ae_Fusion.png" width="75%" class="figure-img img-fluid rounded" alt="A generic square placeholder image with rounded corners in a figure."> |
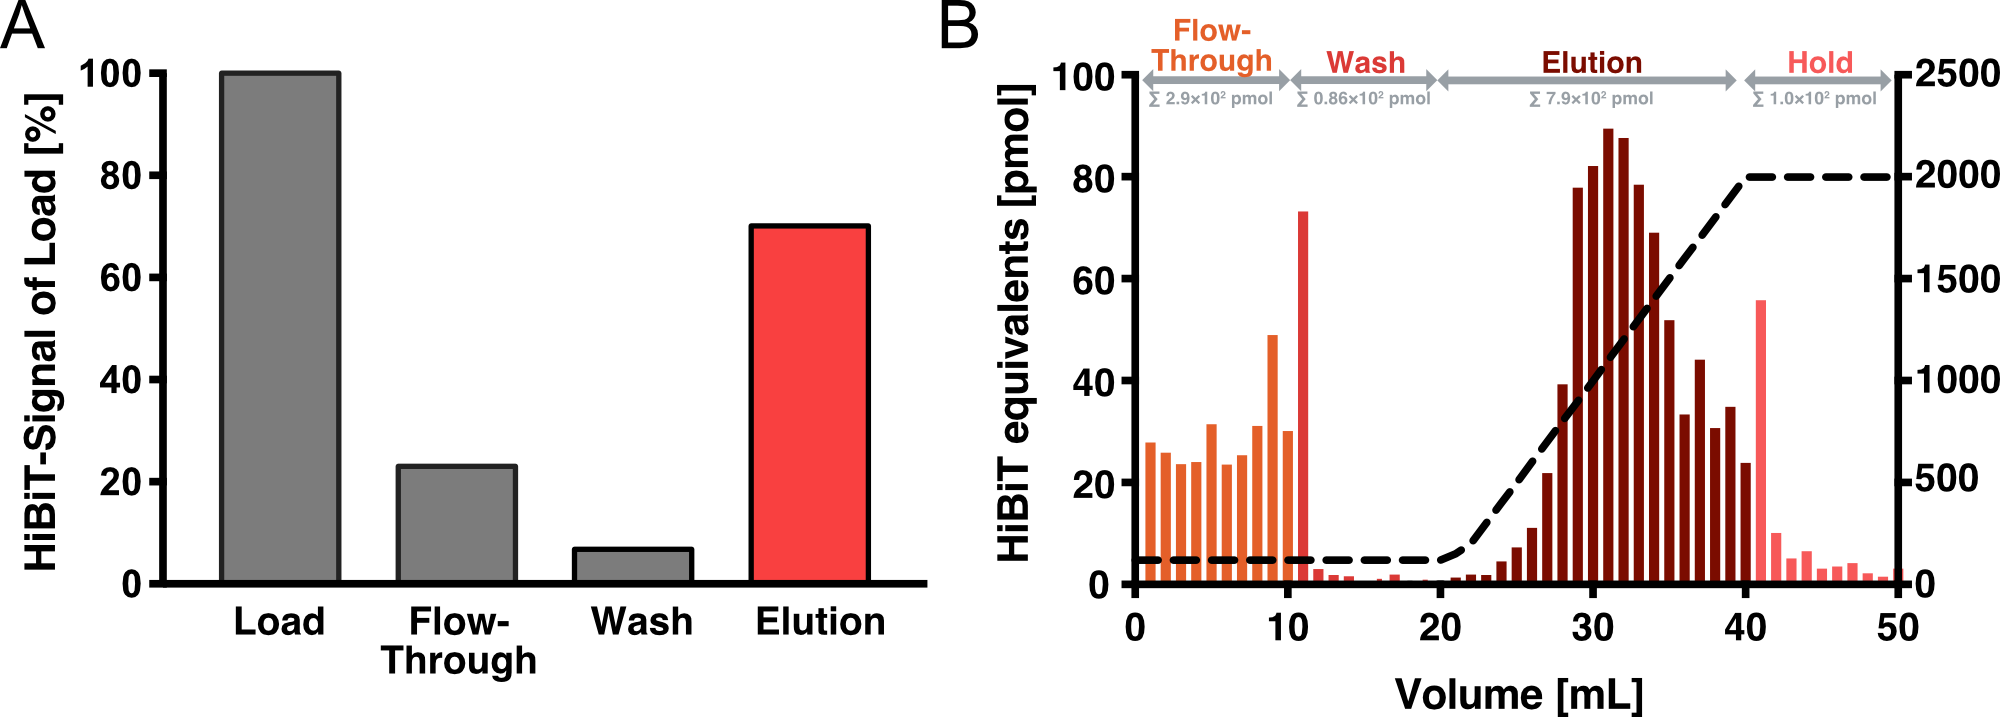
| − | <figcaption class="figure-caption"><b>Figure 4: | + | <figcaption class="figure-caption"><b>Figure 4:Heparin affinity purification of Virus-Like-Particles (VLPs).</b> We analysed the individual fractions using the HiBiT assay. Approximately 40 % of the HiBiT signal was detected in the flow-through, 5 % in the wash and 55 % in the elution fraction. |
| + | |||
| Line 62: | Line 80: | ||
</figure> | </figure> | ||
</html> | </html> | ||
| − | |||
| − | |||
| − | |||
<h3>qPCR Analysis</h3> | <h3>qPCR Analysis</h3> | ||
| − | Finally, the BioBrick Part we designed works as expected since | + | Finally, the BioBrick Part we designed works as expected since FLuc mRNA is successfully transported into VLPs through L7Ae-C/D box interaction. This has been proven through qPCR analysis of VLP content. FLuc mRNA cellular content is calculated with delta Ct analysis, where GAPDH housekeeping gene is used for normalization. Alternatively, this can also be calculated with a standard curve method. Also taking cell confluency (70-80%) into account, we can calculate the accurate amount of Fluc RNA content/cell. On the graph below you can observe a 100-fold increase in FLuc signal/cell with our validated VLP BioBrick Part, compared to control. Furthermore, this part performs 20-fold better than a parallel construct used for exosomes. |
| Line 74: | Line 89: | ||
<figure class="figure"> | <figure class="figure"> | ||
<img src="https://2019.igem.org/wiki/images/5/54/T--Munich--qPCR_HEK_CC.png" width="420" height="360" class="figure-img img-fluid rounded" alt="A generic square placeholder image with rounded corners in a figure."> | <img src="https://2019.igem.org/wiki/images/5/54/T--Munich--qPCR_HEK_CC.png" width="420" height="360" class="figure-img img-fluid rounded" alt="A generic square placeholder image with rounded corners in a figure."> | ||
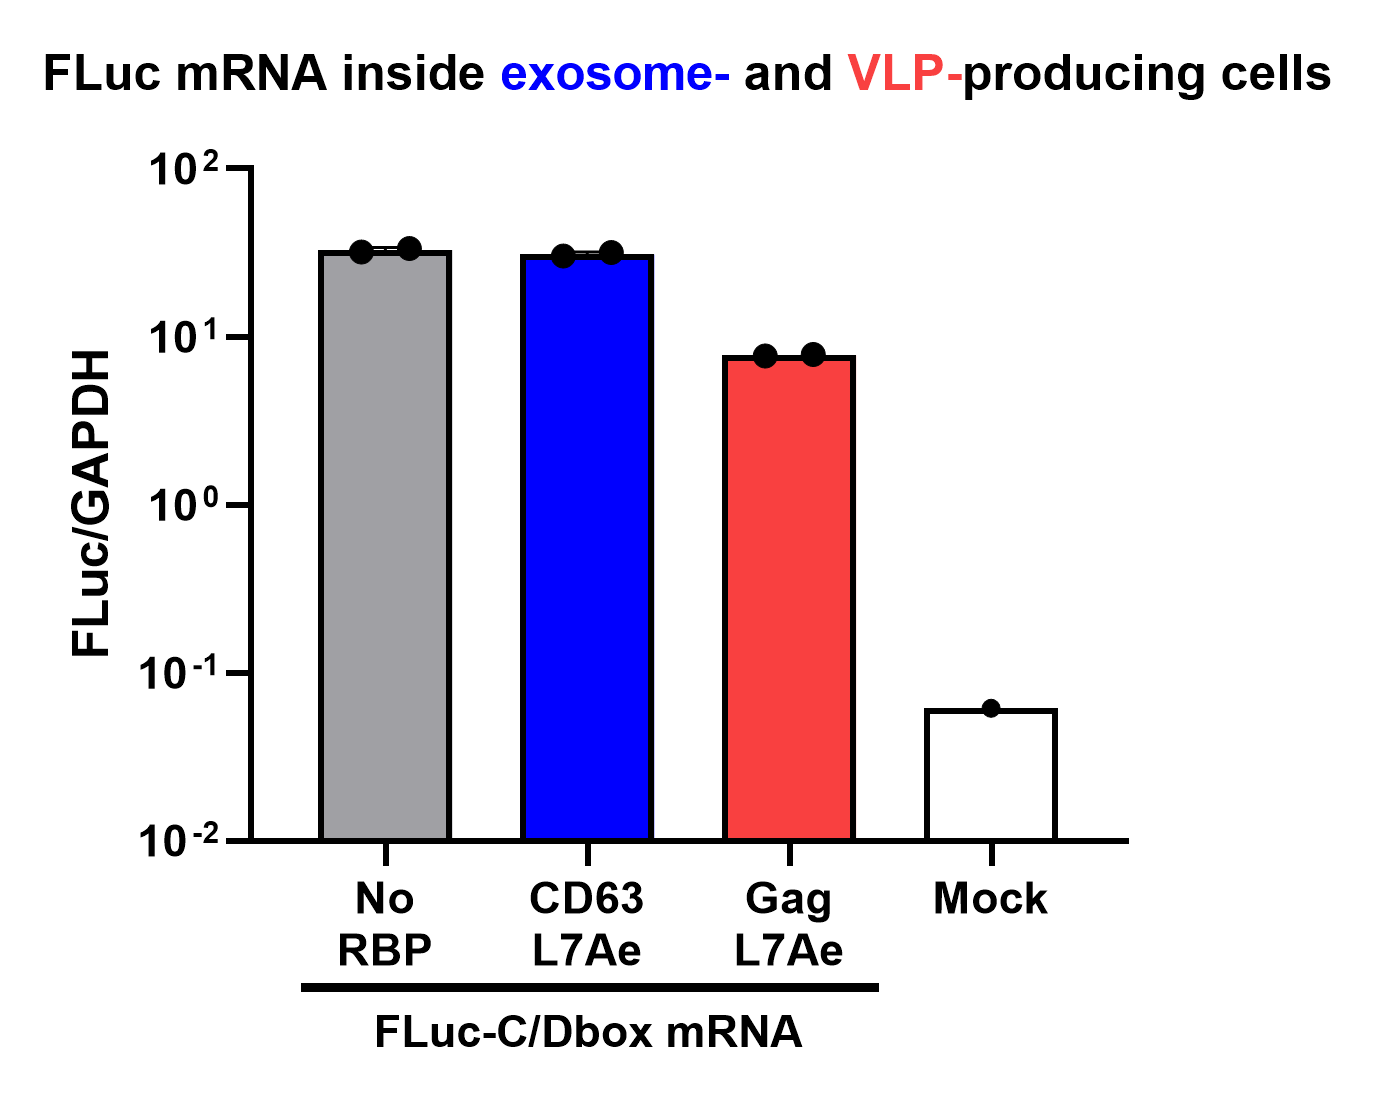
| − | <figcaption class="figure-caption"><b>Figure 6: FLuc mRNA detection in cells producing exosomes (blue) and VLPs (red).</b> All cells transfected with FLuc mRNA show detectable expression levels inside cells, which was significantly higher than for untransfected mock controls. Measurements were performed in technical duplicates (n = 2) with EEJ | + | <figcaption class="figure-caption"><b>Figure 6: FLuc mRNA detection in cells producing exosomes (blue) and VLPs (red).</b> All cells transfected with FLuc mRNA show detectable expression levels inside cells, which was significantly higher than for untransfected mock controls. Measurements were performed in technical duplicates (n = 2) with EEJ primers. Quantification was done via ͍delta Ct method. |
</figcaption> | </figcaption> | ||
</figure> | </figure> | ||
<figure class="figure"> | <figure class="figure"> | ||
| − | <img src="https://2019.igem.org/wiki/images/ | + | <img src="https://2019.igem.org/wiki/images/3/35/T--Munich--RNA_Loading_qPCR.png" width="600" height="340" class="figure-img img-fluid rounded" alt="Figure 7: Cargo mRNA export in exosomes and VLPs quantified via qPCR."> |
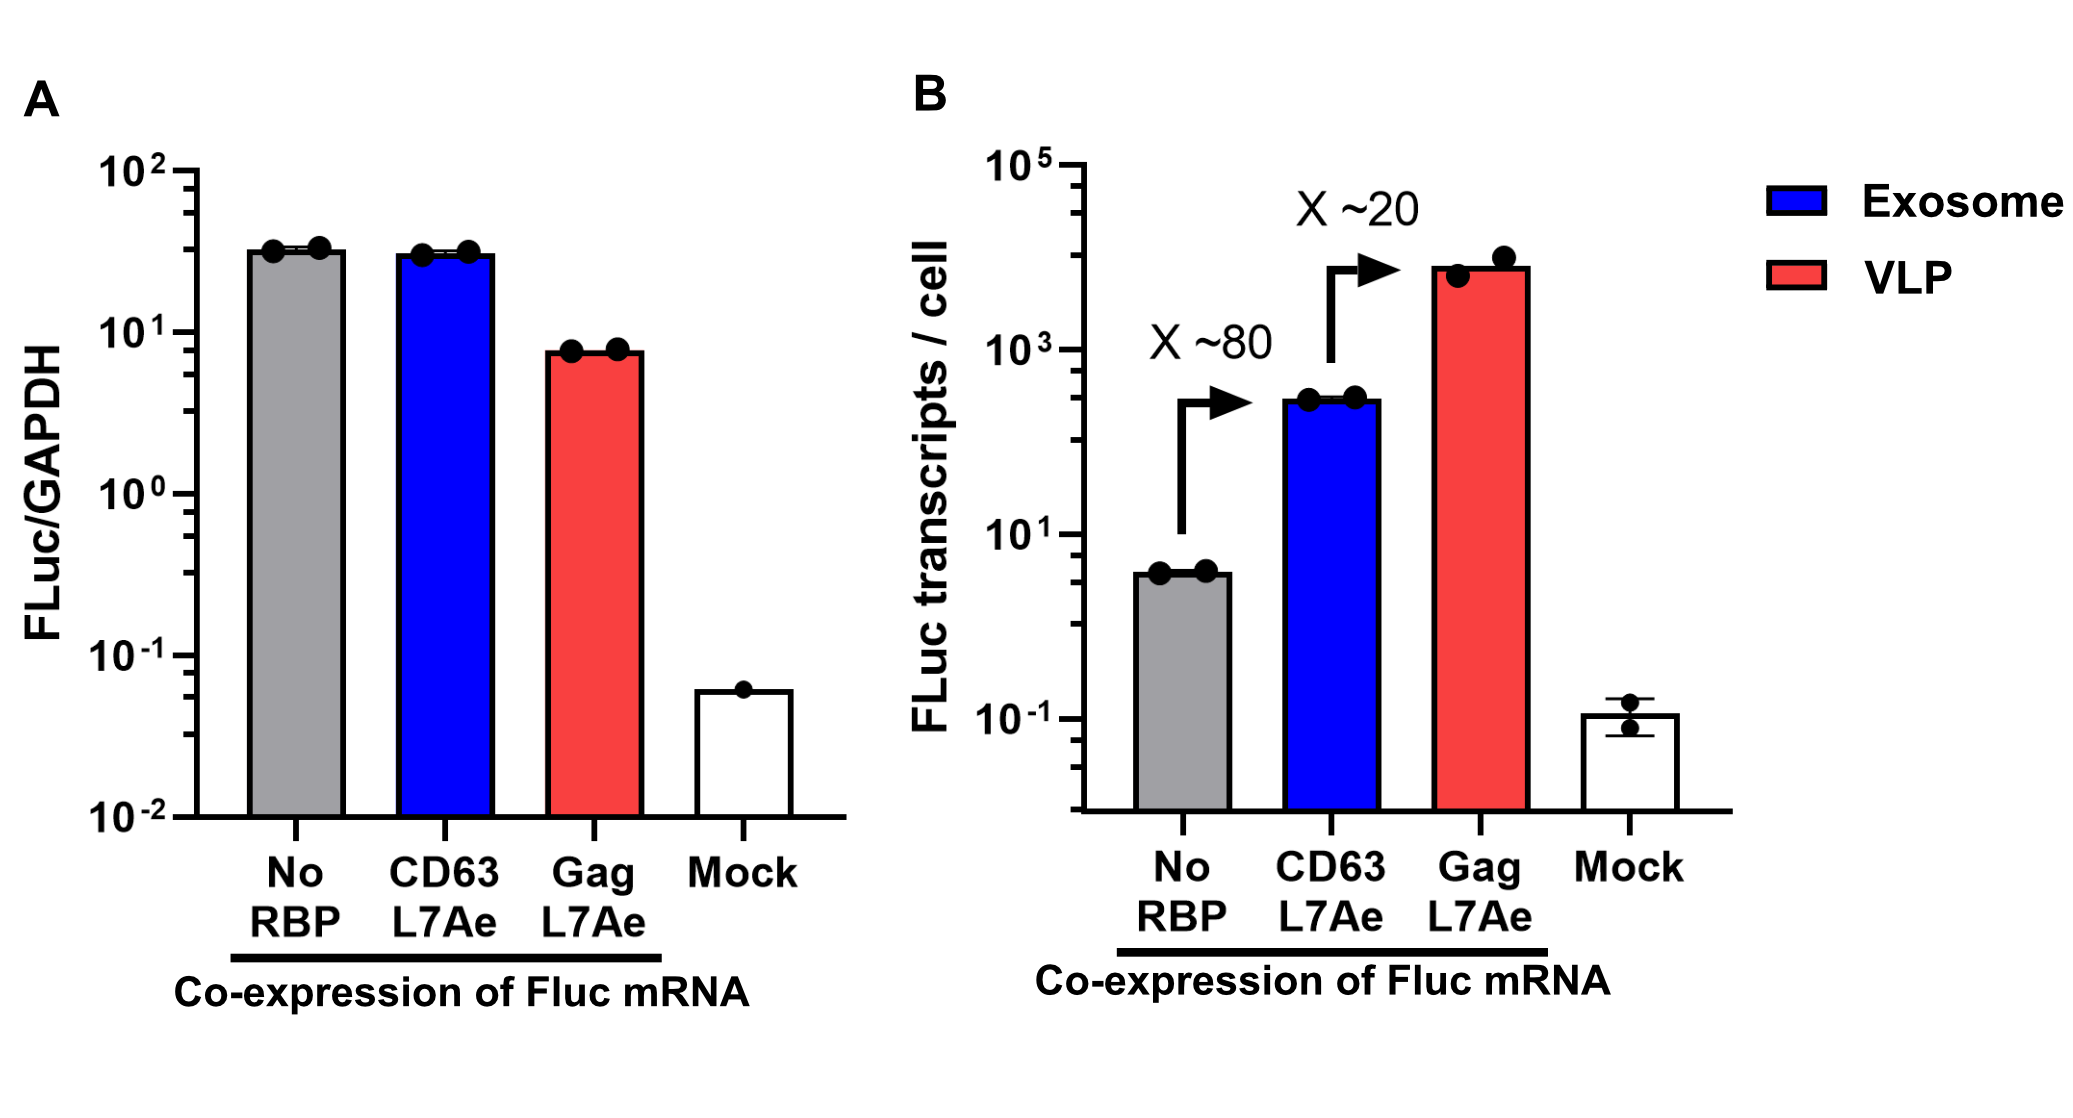
<figcaption class="figure-caption"><b>Figure 7: Cargo mRNA export in exosomes and VLPs quantified via qPCR.</b> Both exosomes (blue) and VLPs (red) containing the RNA adapter L7Ae were capable of exporting FLuc mRNA whereas control cells lacking the RNA binding protein (RBP) showed no significant export. Measurements were performed in technical duplicates (n = 2) with EEJ primers. Quantification was done via standard curve measurements and assuming a confluent well with 350.000 HEK293T cells/cm2 at the time of harvesting. | <figcaption class="figure-caption"><b>Figure 7: Cargo mRNA export in exosomes and VLPs quantified via qPCR.</b> Both exosomes (blue) and VLPs (red) containing the RNA adapter L7Ae were capable of exporting FLuc mRNA whereas control cells lacking the RNA binding protein (RBP) showed no significant export. Measurements were performed in technical duplicates (n = 2) with EEJ primers. Quantification was done via standard curve measurements and assuming a confluent well with 350.000 HEK293T cells/cm2 at the time of harvesting. | ||
Latest revision as of 01:28, 22 October 2019
pCAG_Gag-HiBiT-L7Ae
This plasmid codes for the Gag coat-protein fused to an RNA-binding protein with a split luciferase tag in between. This construct forms virus-like particles (VLPs), which can be detected via a split luciferase assay. Through the RNA binding protein, the vesicles can be loaded with RNA.
Usage
pCAG_GAG-HiBit-L7Ae construct is a Composite part that has been designed to achieve VLP formation inside mammalian cells and enable the transport of chosen RNA information inside vesicles through L7Ae-C/D box interaction (together with construct BBa_K3113301 and BBa_K3113303).
Biology
Gag-p24 is the group-specific antigen from the lentivirus HIV. It assembles at the plasma membrane and leads to budding of vesicles.[1]
“The Nano-Glo® HiBiT Extracellular Detection System quantifies cellular protein in minutes with high sensitivity and a broad dynamic range using a simple add-mix-read assay format.”[2] The HiBiT peptide is an 11 amino acid long tag that can be fused to a protein of interest. The tagged protein can be measured with the Nano-Glo® HiBiT Detection Reagent which contains the LgBiT. Together with the HiBiT, the LgBiT forms a functioning luminescent NanoBiT® enzyme.
The archaeal L7Ae and eukaryotic 15.5kD protein homologs are members of the L7Ae/15.5kD protein family that characteristically recognize K-turn motifs found in both archaeal and eukaryotic RNAs. In Archaea, the L7Ae protein uniquely binds the K-loop motif found in box C/D.[3]
The K-turn is a ubiquitous structural motif in RNA, forming a very tight kink in the axis of helical RNA that plays an important role in many aspects of RNA function. L7Ae is a member of a superfamily of proteins that bind K-turns in RNA, stabilizing the tightly kinked conformation. They are extremely widespread and are important in the assembly of RNA–protein complexes central to translation, splicing and site-specific RNA modification. [4]
Characterization
Transmission Electron Microscopy (TEM)
To validate that our vesicles are intact and properly shaped, we prepared purified VLPs and exosomes for transmission electron microscopy (TEM). This microscopy technique is based on a high-energy beam of electrons shining through a very thin sample fixed on a grid and allows high-resolution imaging.
Dynamic Light Scattering (DLS)
To further characterize our vesicles and determine the size distribution and sample homogeneity, we performed Dynamic Light Scattering (DLS) to determine the size and shape of our vesicles.
DLS measurements of Virus-like particles showed a narrow Gaussian size distribution indicating that the samples are very homogenous. Interestingly, a shift of about 30 nm is seen between cargo-loaded and unloaded VLPs; cargo-loaded particles have a mean diameter of 104 ± 14 nm, whereas unloaded vesicles showed a mean diameter of 71 ± 11 nm.
Split-luciferase bioluminescent assay: The HiBiT Assay
To prove that the BioBrick Part we designed works as expected, we performed a HiBit split-luciferase assay, which shows luminescent signal detected in fully formed VLPs. On the graph below, the data shows that engineered Gag protein has been expressed in HEK293T cells. Further on, based on this data, we have calculated the export to be in approx. 50% for transfection with as well as without adapter construct. Conclusivelly, we report Gag has successfully assembled into VLPs.
Affinity Purification
We have established Heparin affinity chromatography as our method of choice for VLP purification. Figure 4 shows an exemplary chromatogram of a purification run with an increasing NaCl gradient for elution. Fractions of 1 ml were collected for each NaCl concentration up to 2 M and analyzed with an HiBiT assay to determine the absolute amount of Gag. After elution, we collected another 10 fractions with 2 M NaCl. As it can be seen, these fractions showed almost no HiBiT signal, indicating that all vesicles were eluted from the column. In total, approximately 4 % of the HiBiT signal was detected in the flow-through, 5% in the wash and 55% in the elution fraction.
qPCR Analysis
Finally, the BioBrick Part we designed works as expected since FLuc mRNA is successfully transported into VLPs through L7Ae-C/D box interaction. This has been proven through qPCR analysis of VLP content. FLuc mRNA cellular content is calculated with delta Ct analysis, where GAPDH housekeeping gene is used for normalization. Alternatively, this can also be calculated with a standard curve method. Also taking cell confluency (70-80%) into account, we can calculate the accurate amount of Fluc RNA content/cell. On the graph below you can observe a 100-fold increase in FLuc signal/cell with our validated VLP BioBrick Part, compared to control. Furthermore, this part performs 20-fold better than a parallel construct used for exosomes.
Sequence and Features
- 10COMPATIBLE WITH RFC[10]
- 12COMPATIBLE WITH RFC[12]
- 21INCOMPATIBLE WITH RFC[21]Illegal BglII site found at 3019
- 23COMPATIBLE WITH RFC[23]
- 25COMPATIBLE WITH RFC[25]
- 1000INCOMPATIBLE WITH RFC[1000]Illegal BsaI.rc site found at 2319
References
- ↑ HIV-1 Gag: a Molecular Machine Driving Viral Particle Assembly and Release Heinrich G. Göttlinger Department of Cancer Immunology and AIDS, Dana-Farber Cancer Institute, and Department of Pathology, Harvard Medical School, Boston
- ↑ https://www.promega.de/products/protein-quantitation-and-detection/protein-quantitation/nano-glo-hibit-extracellular-detection-system/?catNum=N2420
- ↑ Gagnon, Keith T et al. “Signature amino acids enable the archaeal L7Ae box C/D RNP core protein to recognize and bind the K-loop RNA motif.” RNA (New York, N.Y.) vol. 16,1 (2010): 79-90. doi:10.1261/rna.1692310
- ↑ Lilley, D. M. J. (2019). "The L7Ae proteins mediate a widespread and highly functional protein–RNA interaction." The Biochemist 41(2): 40-44.