Difference between revisions of "Part:BBa K741002"
(→Color mixing model) |
|||
| (35 intermediate revisions by 5 users not shown) | |||
| Line 370: | Line 370: | ||
<br/> | <br/> | ||
First, we compared the inducing effect on the two GFP generators, using different concentration of IPTG. We set 4 groups: 2 experimental groups including old GFP generator (BBa_K741002) and new GFP generator (BBa_K3209006), one negative control without GFP expression and one positive control with constantly GFP expression. At 0h, all groups’ OD600 approximately reaches to 0.8, then certain concentration of IPTG was added to the culture medium, incubated cells at 22℃ overnight. Measure the fluorometric value at 510 nm and OD600 value for each group every 1h, using an automatic microplate reader. | First, we compared the inducing effect on the two GFP generators, using different concentration of IPTG. We set 4 groups: 2 experimental groups including old GFP generator (BBa_K741002) and new GFP generator (BBa_K3209006), one negative control without GFP expression and one positive control with constantly GFP expression. At 0h, all groups’ OD600 approximately reaches to 0.8, then certain concentration of IPTG was added to the culture medium, incubated cells at 22℃ overnight. Measure the fluorometric value at 510 nm and OD600 value for each group every 1h, using an automatic microplate reader. | ||
| − | |||
<br/> | <br/> | ||
[[File:K3209006-1-4.jpg|center]] | [[File:K3209006-1-4.jpg|center]] | ||
Figure 1. The inducing effect of IPTG on the two GFP generators. Relative fluorescent intensity is fluorescence per OD600 standardized with fluorescence per OD600 value of each test group at time = 0, IPTG=0. The figure indicated that both BBa_K741002 and BBa_K3209006 expressed GFP induced by IPTG, and different concentration of IPTG had same inducing trend. | Figure 1. The inducing effect of IPTG on the two GFP generators. Relative fluorescent intensity is fluorescence per OD600 standardized with fluorescence per OD600 value of each test group at time = 0, IPTG=0. The figure indicated that both BBa_K741002 and BBa_K3209006 expressed GFP induced by IPTG, and different concentration of IPTG had same inducing trend. | ||
<br/> | <br/> | ||
| − | + | Then we detected the GFP expression under the IPTG existance or absence, using BBa_K741002 and BBa_K3209006, respectively. The results showed that BBa_K741002 expressed a mountain of GFP whether the IPTG present or not, which means that BBa_K741002 had a high leakage expression and lower sensitivity to the IPTG induction. However, BBa_K3209006 expressed a high level GFP only under IPTG existance. The leakage expression is very low, and it is sensitive to the IPTG induction. | |
| − | Then we detected the GFP expression under the IPTG existance or absence, using BBa_K741002 and BBa_K3209006, respectively. The results showed that BBa_K741002 expressed a mountain of GFP whether the IPTG present or not, which means that BBa_K741002 had a high leakage expression and lower sensitivity to the IPTG | + | |
<br/> | <br/> | ||
[[File:K3209006-2.jpg|center]] | [[File:K3209006-2.jpg|center]] | ||
| − | Figure 2. The comparison of GFP expression using BBa_K741002 with and without IPTG induction. Relative fluorescent intensity is fluorescence per OD600 standardized with fluorescence per OD600 value of each test group at time = 0, IPTG=0. This figure indicated that the GFP generator (BBa_K741002) | + | Figure 2. The comparison of GFP expression using BBa_K741002 with and without IPTG induction. Relative fluorescent intensity is fluorescence per OD600 standardized with fluorescence per OD600 value of each test group at time = 0, IPTG=0. This figure indicated that the GFP generator (BBa_K741002) had a high keakage expression, and low sensitivity to the IPTG induction. |
| − | + | ||
| − | + | ||
<br/> | <br/> | ||
[[File:K3209006-3.jpg|center]] | [[File:K3209006-3.jpg|center]] | ||
| Line 406: | Line 403: | ||
We characterized this part using fluorescence at different concentrations of IPTG to determine the level of IPTG we would need to use to induce genes in the system we were testing. The plasmid was transformed into two cell types: NEB 10-beta and a cell strain containing lacIQ. Cell cultures were grown up overnight in 5 mL of LB with chloramphenicol at 37 C. The following day, 990 uL of LB, 10 uL of cell culture, and 1 uL of chloramphenicol were added to 1.5 mL Eppendorf tubes. The tubes were incubated for 4 hours at 37 C. After 4 hours, IPTG of varying concentrations was added to the tubes. Five different conditions were tested, with each condition tested with 4 replicates. The tubes were then incubated at 37 C for 16 hours. 200 uL aliquots were then taken from each tube and spun down for 3 minutes. The cells were resuspended in 200 uL of PBS buffer. 100 uL of resuspended cells were plated on a clear 96 well plate and fluorescence and OD600 were measured. The fluorescence settings were excitation set 485 nm, emission cutoff at 495 nm, and emission at 525 nm. | We characterized this part using fluorescence at different concentrations of IPTG to determine the level of IPTG we would need to use to induce genes in the system we were testing. The plasmid was transformed into two cell types: NEB 10-beta and a cell strain containing lacIQ. Cell cultures were grown up overnight in 5 mL of LB with chloramphenicol at 37 C. The following day, 990 uL of LB, 10 uL of cell culture, and 1 uL of chloramphenicol were added to 1.5 mL Eppendorf tubes. The tubes were incubated for 4 hours at 37 C. After 4 hours, IPTG of varying concentrations was added to the tubes. Five different conditions were tested, with each condition tested with 4 replicates. The tubes were then incubated at 37 C for 16 hours. 200 uL aliquots were then taken from each tube and spun down for 3 minutes. The cells were resuspended in 200 uL of PBS buffer. 100 uL of resuspended cells were plated on a clear 96 well plate and fluorescence and OD600 were measured. The fluorescence settings were excitation set 485 nm, emission cutoff at 495 nm, and emission at 525 nm. | ||
<br/> | <br/> | ||
| + | [[File:T--UIUC Illinois--plac fluor data3.png|center]] | ||
<br/> | <br/> | ||
This graph shows the normalized fluorescence of both tested cell types for all concentrations of IPTG tested. In regular NEB 10-Beta, the expression of GFP is very leaky as expression is high even in samples where no IPTG was added. The lacIQ+ cell line shows overall much lower levels of expression, but is more responsive to the addition of IPTG, with 0.1 mM IPTG providing the greatest increase in expression. These results indicate that pLac-regulated expression is highly leaky in cells that don’t have a lacIQ inhibitor. | This graph shows the normalized fluorescence of both tested cell types for all concentrations of IPTG tested. In regular NEB 10-Beta, the expression of GFP is very leaky as expression is high even in samples where no IPTG was added. The lacIQ+ cell line shows overall much lower levels of expression, but is more responsive to the addition of IPTG, with 0.1 mM IPTG providing the greatest increase in expression. These results indicate that pLac-regulated expression is highly leaky in cells that don’t have a lacIQ inhibitor. | ||
| + | |||
| + | |||
| + | |||
| + | |||
| + | <br/> | ||
| + | <br/> | ||
| + | <br/> | ||
| + | =Sriwijaya 2019 Characterization= | ||
| + | ==Introduction:== | ||
| + | LacI or glucose can repress and inhibit the expression of GFP meanwhile lactose and IPTG can activate it. The lac promoter with GFP gene downstream can simply be characterized by induction and addition of glucose and IPTG to activate or deactivate the GFP system. | ||
| + | ==Characterization Design:== | ||
| + | We prefer to characterize the Part: BBa_K741002 because of the accessibility of the materials. We aim to demonstrate the effect of glucose or IPTG addition to GFP expression. The strains used in this characterization is TOP10, BL21, and DH5alpha E. coli strains. | ||
| + | <br/> | ||
| + | 1. Competent cell preparation. | ||
| + | <br/> | ||
| + | 2. Transformation of the Part:BBa_K741002 into DH5a, BL21, and TOP10 strain. | ||
| + | <br/> | ||
| + | 3. Transfer of a single colony to 2 ml tryptic soy broth medium with 50 µg/ml of chloramphenicol. Incubation at 37℃ for 60 minutes. | ||
| + | <br/> | ||
| + | 4. Addition of 0, 500, 800, 1000 mM of glucose and 1000 mM of IPTG. | ||
| + | <br/> | ||
| + | 5. Transfer of 100 µL from each group to each well. Each sample is transferred to 2 wells. | ||
| + | <br/> | ||
| + | [[Image:T--Sriwijaya--characterization-sample.png|center|920px|thumb|center|Figure 1. Sample Groups]] | ||
| + | After the induction of glucose and IPTG, the optical density (OD) and GFP fluorescence is measured using plate reader. | ||
| + | <br> | ||
| + | 6. Measurement of optical density using plate reader (wavelength= 490 nm). | ||
| + | <br/> | ||
| + | 7. Incubation at 37℃ for 15 minutes. | ||
| + | <br/> | ||
| + | 8. Measurement of optical density using plate reader (wavelength= 490 nm). | ||
| + | <br/> | ||
| + | 9. Incubation at 37℃ for 15 minutes. | ||
| + | <br/> | ||
| + | 10. Measurement of optical density using plate reader (wavelength= 490 nm). | ||
| + | <br/> | ||
| + | 11. Incubation at 37℃ for 15 minutes. | ||
| + | <br/> | ||
| + | 12. Measurement of optical density using plate reader (wavelength= 490 nm). | ||
| + | <br/> | ||
| + | Furthermore, the inducted bacteria are harvested and put into lysis mode via alkaline solution until denaturation occurred. The addition of neutralizing buffer began the process of precipitation and left the bacterial DNA plasmids in the solution. The plasmids in the solution is precipitated and spun in order to purify and separate the nucleic acid from the solution. The plasmid is isolated and ran through gel electrophoresis to analyse the remaining genetic fragments. | ||
| + | <br/> | ||
| + | <br/> | ||
| + | |||
| + | ==Results:== | ||
| + | CALLIBRATION | ||
| + | <br/> | ||
| + | We follow the protocol and make sure that our fluorescence standard curve are in line with the protocol using the iGEM measurement kit. With the curves shown below. | ||
| + | [[Image:T--Sriwijaya--FSCtable.png|center|920px|thumb|center|Figure 2. Fluorescein Standard Curve.]] | ||
| + | <br/> | ||
| + | <br/> | ||
| + | |||
| + | MEASUREMENT | ||
| + | <br/> | ||
| + | [[Image:T--Sriwijaya--characterization-RFP.png|center|460px|thumb|center|Figure 3. (a) single colony successfully expressing GFP, (b) PSB1C3 expressing RFP (negative control).]] | ||
| + | |||
| + | Three groups are set throughout this experiment with group A containing DH5a strain with glucose and IPTG induction with varying concentrations spread out through 5 subgroups, group B containing TOP10 strain, group C containing BL21 strain. Well A1-2, B1-2, C1-2 are set as negative control without the addition of any glucose (0 mM glucose). Well A11-12, B11-12, C11-12 are blanks. See figure 1. | ||
| + | <br/> | ||
| + | <br/> | ||
| + | [[Image:T--Sriwijaya--characterization-TSB.png|center|460px|thumb|center|Figure 4. TSB medium with 3 different concentration of glucose: 500 mM, 800 mM, 1000 mM; 1000 mM IPTG, and TSB medium without glucose nor IPTG as negative control.]] | ||
| + | <br/> | ||
| + | <br/> | ||
| + | Each well contains 100 µL of solution. The optical density of each well is measured using plate reader under 490 nm wavelength. Results of each group are shown in bars and tables below. Optical Density is repeatly measured after 15 minutes, 30 minutes, and 45 minutes of incubation (37°C) and ran through the plate reader again consecutively for the until the 4th time. | ||
| + | <br/> | ||
| + | <br/> | ||
| + | [[Image:T--Sriwijaya--DH5agraph.png|center|460px|thumb|center|Figure 5. µM Fluorescein/OD at 0 min, 15 min, 30 min, and 45 min of incubation of cell cultures originated from DH5a colony.]] | ||
| + | |||
| + | |||
| + | <br/> | ||
| + | <br/> | ||
| + | |||
| + | |||
| + | [[Image:T--Sriwijaya--BL21graph.png|center|460px|thumb|center|Figure 6. µM Fluorescein/OD at 0 min, 15 min, 30 min, and 45 min of incubation of cell cultures originated from BL21 colony.]] | ||
| + | |||
| + | <br/> | ||
| + | <br/> | ||
| + | |||
| + | [[Image:T--Sriwijaya--top10graph.png|center|460px|thumb|center|Figure 7. µM Fluorescein/OD at 0 min, 15 min, 30 min, and 45 min of incubation of cell cultures originated from TOP10 colony.]] | ||
| + | |||
| + | <br/> | ||
| + | <br/> | ||
| + | [[Image:T--Sriwijaya--characterization-electrophoresis.png|460px|thumb|center|Figure 8. Electrophoresis result on a 2% TAE agarose gel.]] | ||
| + | <br/> | ||
| + | <br/> | ||
| + | |||
| + | ==Discussion:== | ||
| + | A control mechanism of plac in response to glucose increases the production of β-galactosidase in the absence of glucose. Cyclic adenosine monophosphate (cAMP) is inversely proportional to that of glucose. It binds to the CAP, which in turn allows the CAP to bind to the CAP binding site, which assists the RNAP in binding to the DNA. In the absence of glucose, the cAMP concentration is high and binding of CAP-cAMP to the DNA significantly increases the production of β-galactosidase, enabling the cell to hydrolyse lactose, release galactose and glucose, and activates the GFP system. Meanwhile in response to presence of glucose, the production of β-galactosidase decreases and in the following chain of events blocks the binding of CAP-cAMP to the DNA and therefore lactose hydrolysis doesn’t occur and the GFP system is deactivated. On the other hand, IPTG works almost analogously to galactocydes therefore the induction of IPTG represses the lactose hydrolysis thus the GFP system is activated. | ||
| + | <br/> | ||
| + | <br/> | ||
| + | In accordance with the theory, the additon of glucose deactivated the GFP system in dose-dependent manner. The Part: BBa_K741002 designer stated that the leak expression of plac is quite high. E. coli can not express enough lacI to repress the expression of plac. Even without the existence of IPTG, GFP is expressed. This is why the control group (0 mM glucose) produced the highest value of Fluorescein/OD in our experiment. | ||
| + | <br/> | ||
| + | <br/> | ||
| + | On the other hand, our results suggest that the addition of 1000mM IPTG doesn’t activate the GFP system. On the contrary, the Fluorescein/OD produced is even lower than 0 mM glucose and 1000 mM glucose group. This might be because of the limitation of our research such as the scarcity of the materials needed for this experiment and also limited funds, so that we have to use our lab's IPTG which might have been damaged due to improper and/or prolonged storage. | ||
| + | <br/> | ||
| + | <br/> | ||
| + | In order to confirm that the Part:BBa_K741002 is indeed transformed to each strain, we isolated the plasmid and ran it on 2% TAE agarose gel electrophoresis along with 100 bp DNA ladder and PSB1C3 plasmid as positive control for 1 hour. The DNA band is not parallel to any of the marker. That’s the only DNA ladder we have in our lab (due to our lack of fund) with 1517 bp as the highest molecular weight. Whereas, the pSB1C3 is 2070 bp and the pSB1C3-BBa_K741002 is 3153 bp. We concluded that all three of our bacteria strains contain the Part:BBa_K741002. The BL21 and TOP10 band is slightly darker. We have considered the possibility that the plasmid concentration in both strains might be lower. Hence, the isolated DNA is less or there may be another mechanism we haven’t figured out. | ||
| + | <br/> | ||
| + | <br/> | ||
| + | |||
| + | ==References== | ||
| + | Ramey, W.D. 2002. Experiment A4a – Effect of glucose, lactose and sucrose on the induction β-galactosidase. pp. 1-6. In W.D. Ramey (ed.), Microbiology 421 manual of experimental microbiology, The University of British Columbia, 2002. | ||
| + | <br/> | ||
| + | <br/> | ||
| + | Marbach, A., & Bettenbrock, K. 2012. lac operon induction in Escherichia coli: Systematic comparisonof IPTG and TMG induction and influence of the transacetylase LacA. Journal Of Biotechnology, 157(1), 82-88. | ||
| + | <br/> | ||
| + | ==Contribution: NYCU_Formosa 2022== | ||
| + | ===Color mixing model=== | ||
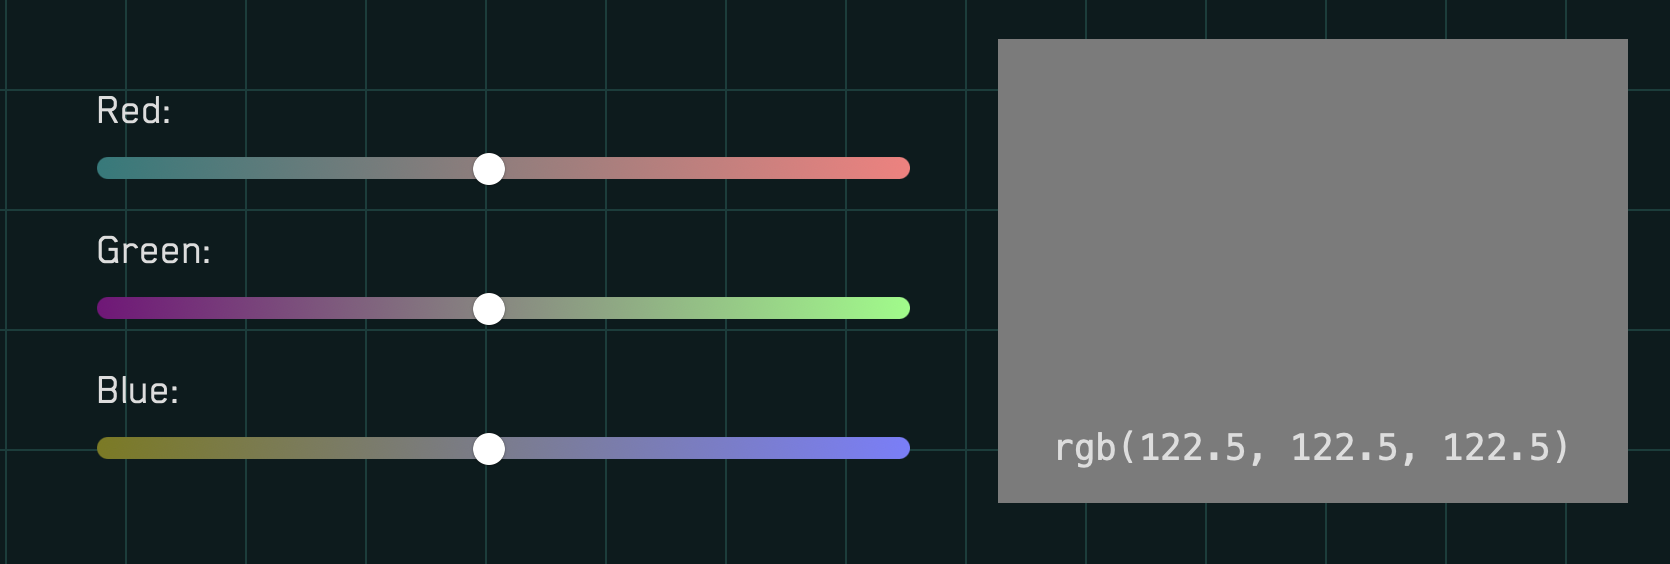
| + | To establish our color mixing model, we measured the fluorescent intensity to time relationship of Part: BBa_J04450(rfp) and Part: BBa_K741002(gfp). With these parameters, we created a model for future teams to deduce the ratio of red and green for their desired color. This simulation shows that different RGB values lead to different color results. What’s more important is that the changing degree of red and green values is based on our protein expression experiments. Thus, according to their desired color, future teams are able to speculate the specific incubation time for ''E.coli'' transformed with RFP and GFP genes. | ||
| + | |||
| + | With experimental verification, we have mixed different concentrations of RFP and GFP in fixed value of 200μL, which includes ratio 1:1, 5:3, 2:1, 3:1, 4:1, 9:1, 1:9, 4:1, 3:1, 2:1. | ||
| + | |||
| + | [[File:Nycu Formosa GFP.jpg | center]] | ||
| + | |||
| + | <p style="text-align: center!important;"><b>Figure 1. RFP : Flourscecnce Intensity of RFP over time</b></p> | ||
| + | |||
| + | [[File:Nycu Formosa RFP.jpg | center]] | ||
| + | |||
| + | <p style="text-align: center!important;"><b>Figure 2. GFP : Flourscecnce Intensity of GFP over time</b></p> | ||
| + | |||
| + | [[File:NYCU Formosa Fig1.jpg | center]] | ||
| + | |||
| + | <p style="text-align: center!important;"><b>Figure 3. Different combinations of RFP and GFP</b></p> | ||
| + | |||
| + | [[File:NYCU Formosa fig2.jpg | center]] | ||
| + | |||
| + | <p style="text-align: center!important;"><b>Figure 4. Combinations of RFP and GFP of 1:9 and 9:1.</b></p> | ||
| + | |||
| + | [[File:Nycu formosa fig3.jpg | center]] | ||
| + | |||
| + | <p style="text-align: center!important;"><b>Figure 5. Combinations of RFP and GFP of 1:5 and 5:1.</b></p> | ||
| + | |||
| + | [[File:Nycu formosa fig4.jpg | center]] | ||
| + | |||
| + | <p style="text-align: center!important;"><b>Figure 6. Combinations of RFP and GFP of 1:4 and 4:1.</b></p> | ||
| + | |||
| + | [[File:Nycu formosa fig5.jpg | center]] | ||
| + | |||
| + | <p style="text-align: center!important;"><b>Figure 7. Combinations of RFP and GFP of 1:3 and 3:1.</b></p> | ||
| + | |||
| + | [[File:Nycu formosa fig6.jpg | center]] | ||
| + | |||
| + | <p style="text-align: center!important;"><b>Figure 8. Combinations of RFP and GFP of 1:2 and 2:1.</b></p> | ||
| + | |||
| + | [[File:Nycuformosa1111.png | center | 700px]] | ||
| + | |||
| + | <p style="text-align: center!important;"><b>Figure 9. Color Mixing Model 1.</b></p> | ||
| + | |||
| + | [[File:Nycuformosa3333.png | center | 700px]] | ||
| + | |||
| + | <p style="text-align: center!important;"><b>Figure 10. Color Mixing Model 2.</b></p> | ||
Latest revision as of 03:58, 14 October 2022
plac-RBS-GFP-T
Lac promoter with GFP gene downstream. LacI or glucose can repress the expression of GFP while lactose and IPTG can activates it.
Sequence and Features
- 10COMPATIBLE WITH RFC[10]
- 12COMPATIBLE WITH RFC[12]
- 21COMPATIBLE WITH RFC[21]
- 23COMPATIBLE WITH RFC[23]
- 25COMPATIBLE WITH RFC[25]
- 1000INCOMPATIBLE WITH RFC[1000]Illegal BsaI.rc site found at 870
Initially, we use IPTG to activate the promoter plac. However, we find that the leak expression of plac is quite high. Even without the existence of IPTG, GFP expresses. This is because there are no lacI genes on the plasmid bones PSB1C3. And K12 strains can not express enough lacI to repress the expression of plac. We look into some documents and find that glucose can repress the expression of plac(see the character of the plac in the lactose operon).Therefore, we set four experimental groups, adding glucose with concentration of 500mM, 800mM, 1000mM, 1000mM of IPTG and a blank group with nothing added.
From figure 1, we can see the unit fluorescence intensity of experimental groups with glucose added is lower than the blank group, because glucose represses the expression of plac, which reduces the expression of GFP.
At the beginning, we can’t observe the activating effect of IPTG on plac, which we ascribe to the unstability of the promoter plac. About 90 minutes later, the unit fluorescence intensity of experimental groups with IPTG added is higher than the blank group, which indicates IPTG’s activation on plac.
The difference of the unit fluorescence intensity between the experimental groups with different concentrations of glucose added is not strictly related to the increasing amount of glucose, because glucose affects the growth and metabolism of E.coli, which brings uncertainty to our experiments.
About 3 hours later, the difference of the unit fluorescence intensity between the groups abates, because of the consumption of glucose.
Data
| Fluorescence intensity | ||||||||||||||||
| plac-RBS-GFP-T | ||||||||||||||||
| t/min | M9 medium | 0 | 500mM glucose | 800mM glucose | 1000mM glucose | 1000mM IPTG | ||||||||||
| Parallel | 1 | 1 | 2 | 3 | 1 | 2 | 3 | 1 | 2 | 3 | 1 | 2 | 3 | 1 | 2 | 3 |
| 0 | 11.801 | 197.047 | 198.876 | 190.953 | 202.614 | 203.782 | 202.702 | 200.39 | 202.035 | 204.525 | 206.516 | 206.355 | 206.741 | 179.988 | 210.315 | 205.464 |
| 45 | 13.386 | 214.145 | 213.602 | 219.416 | 223.437 | 241.267 | 224.909 | 244.257 | 235.427 | 243.904 | 224.783 | 235.979 | 239.014 | 209.009 | 214.669 | 224.21 |
| 90 | 11.541 | 273.664 | 245.629 | 250.211 | 305.733 | 317.547 | 313.495 | 299.869 | 324.396 | 328.157 | 331.194 | 309.167 | 305.24 | 261.801 | 267.369 | 281.328 |
| 135 | 11.894 | 344.987 | 319.854 | 325.421 | 370.167 | 398.352 | 369.309 | 372.487 | 407.478 | 385.073 | 333.989 | 355.2 | 351.929 | 314.246 | 332.2 | 351.364 |
| 180 | 11.066 | 424.182 | 425.564 | 389.785 | 415.844 | 463.184 | 378.606 | 447.508 | 456.27 | 449.414 | 311.226 | 441.902 | 456.969 | 338.101 | 304.146 | 349.339 |
| OD | ||||||||||||||||
| plac-RBS-GFP-T | ||||||||||||||||
| t/min | M9 medium | 0 | 500mM glucose | 800mM glucose | 1000mM glucose | 1000mM IPTG | ||||||||||
| 0 | 0.045 | 0.0726 | 0.0719 | 0.0733 | 0.084 | 0.0829 | 0.0754 | 0.0747 | 0.0807 | 0.0741 | 0.0785 | 0.0883 | 0.0863 | 0.075 | 0.073 | 0.0781 |
| 45 | 0.0436 | 0.0793 | 0.0792 | 0.0798 | 0.0932 | 0.0743 | 0.0861 | 0.0834 | 0.0909 | 0.086 | 0.0873 | 0.1011 | 0.098 | 0.0835 | 0.0813 | 0.0875 |
| 90 | 0.0435 | 0.0973 | 0.0978 | 0.1004 | 0.1231 | 0.1222 | 0.1165 | 0.1165 | 0.1172 | 0.1166 | 0.1147 | 0.131 | 0.1255 | 0.0978 | 0.0974 | 0.104 |
| 135 | 0.0447 | 0.1403 | 0.1367 | 0.135 | 0.1611 | 0.1551 | 0.1625 | 0.1601 | 0.1668 | 0.1609 | 0.1852 | 0.1787 | 0.1755 | 0.1463 | 0.1349 | 0.1218 |
| 180 | 0.0446 | 0.1995 | 0.2064 | 0.2297 | 0.2414 | 0.2346 | 0.2161 | 0.239 | 0.2405 | 0.2209 | 0.1884 | 0.2627 | 0.23 | 0.1832 | 0.2 | 0.1967 |
Improvement by JNFLS2019
Overview:
Plac is one of the most common promoter in life science research field. It is mainly composed of Lac operon containing LacO site. LacI repressor, encoded by LacI gene, can bind with LacO site to inhibit the binding of RNA pol to the promoter, so the genes downstream expression are blocked. Serving as inducer, IPTG can bind with LacI inhibitor, making the latter’s conformation changes, so LacI is detached from LacO site, which enables the transcription of downstream genes. BBa_K741002 is a GFP generator driven by Plac promoter, however there is no LacI gene in it. Although the E.coli could express some LacI, it is not enough for inhibition GFP expression. So this GFP generator has some leakage expression, like the designer stated, even some GFP express without IPTG inducer presence.
We constructed a new GFP generator (BBa_K3209006) also driven by Plac promoter. It contains LacI gene, which can lower significantly the leakage expression. Both LacI and EGFP are linked to the downstream of Plac, which is regulated by LacI inhibitor and IPTG inducer. Using EGFP as a reporter, its fluorescence intensity appears a lower leakage expression. This new GFP generator could be self-regulated because LacI protein can inhibit its self expression, so that no excessive LacI expression which is considered as waste of resources. We detected the response of this generator to different concentration of IPTG, indicating that it could be inhibited by LacI, and induced well by IPTG.
Results:
First, we compared the inducing effect on the two GFP generators, using different concentration of IPTG. We set 4 groups: 2 experimental groups including old GFP generator (BBa_K741002) and new GFP generator (BBa_K3209006), one negative control without GFP expression and one positive control with constantly GFP expression. At 0h, all groups’ OD600 approximately reaches to 0.8, then certain concentration of IPTG was added to the culture medium, incubated cells at 22℃ overnight. Measure the fluorometric value at 510 nm and OD600 value for each group every 1h, using an automatic microplate reader.
Figure 1. The inducing effect of IPTG on the two GFP generators. Relative fluorescent intensity is fluorescence per OD600 standardized with fluorescence per OD600 value of each test group at time = 0, IPTG=0. The figure indicated that both BBa_K741002 and BBa_K3209006 expressed GFP induced by IPTG, and different concentration of IPTG had same inducing trend.
Then we detected the GFP expression under the IPTG existance or absence, using BBa_K741002 and BBa_K3209006, respectively. The results showed that BBa_K741002 expressed a mountain of GFP whether the IPTG present or not, which means that BBa_K741002 had a high leakage expression and lower sensitivity to the IPTG induction. However, BBa_K3209006 expressed a high level GFP only under IPTG existance. The leakage expression is very low, and it is sensitive to the IPTG induction.
Figure 2. The comparison of GFP expression using BBa_K741002 with and without IPTG induction. Relative fluorescent intensity is fluorescence per OD600 standardized with fluorescence per OD600 value of each test group at time = 0, IPTG=0. This figure indicated that the GFP generator (BBa_K741002) had a high keakage expression, and low sensitivity to the IPTG induction.
Figure 3. The comparison of GFP expression using BBa_K3209006 with and without IPTG induction. Relative fluorescent intensity is fluorescence per OD600 standardized with fluorescence per OD600 value of each test group at time = 0, IPTG=0. This figure indicated that the new GFP generator (BBa_K3209006) is very sensitive to the IPTG induction, and the GFP leakage expression is very low.
Protocol:
- Transform the plasmids into BL21 strain.
- Pick up a single colony by a sterile tip from each of the plates for all the experimental and control groups. And put the colony into 5ml M9 medium with 100 µg/ml ampicillin. Incubate at 37℃ in a shaker for 6-8h.
- Detect OD600value of the culture medium with spectrophotometer, and dilute the culture medium to OD600= 0.8.
- Add 100 µl bacteria culture medium into a sterile 96-well plate. IPTG is added to final concentrations of 1, 2, 5, 10mM. M9 medium is the blank control. Constantly expressing EGFP colony is the positive control and colony without EGFP expression is the negative control.
- Incubate at 22℃ overnight, and measure the fluorometric value at 510 nm and OD600value for each well every 1h, using an automatic microplate reader.
- The experiment should be repeated at least 3 times.
References:
- Szabolcs Semsey, Sandeep Krishna.The effect of LacI autoregulation on the performance of the lactose utilization system in Escherichia col, Nucleic Acids Res 2013 Jul; 41(13): 6381–6390.
- Adam J. Meyer, Thomas H. Segall-Shapiro, Emerson Glassey, Jing Zhang & Christopher A. Voigt. Escherichia coli “Marionette” strains with 12 highly optimized small-molecule sensors. Nature Chemical Biology, 2019, 15: 196–204.
UIUC_Illinois 2019 Characterization
Overview:
We characterized this part using fluorescence at different concentrations of IPTG to determine the level of IPTG we would need to use to induce genes in the system we were testing. The plasmid was transformed into two cell types: NEB 10-beta and a cell strain containing lacIQ. Cell cultures were grown up overnight in 5 mL of LB with chloramphenicol at 37 C. The following day, 990 uL of LB, 10 uL of cell culture, and 1 uL of chloramphenicol were added to 1.5 mL Eppendorf tubes. The tubes were incubated for 4 hours at 37 C. After 4 hours, IPTG of varying concentrations was added to the tubes. Five different conditions were tested, with each condition tested with 4 replicates. The tubes were then incubated at 37 C for 16 hours. 200 uL aliquots were then taken from each tube and spun down for 3 minutes. The cells were resuspended in 200 uL of PBS buffer. 100 uL of resuspended cells were plated on a clear 96 well plate and fluorescence and OD600 were measured. The fluorescence settings were excitation set 485 nm, emission cutoff at 495 nm, and emission at 525 nm.
This graph shows the normalized fluorescence of both tested cell types for all concentrations of IPTG tested. In regular NEB 10-Beta, the expression of GFP is very leaky as expression is high even in samples where no IPTG was added. The lacIQ+ cell line shows overall much lower levels of expression, but is more responsive to the addition of IPTG, with 0.1 mM IPTG providing the greatest increase in expression. These results indicate that pLac-regulated expression is highly leaky in cells that don’t have a lacIQ inhibitor.
Sriwijaya 2019 Characterization
Introduction:
LacI or glucose can repress and inhibit the expression of GFP meanwhile lactose and IPTG can activate it. The lac promoter with GFP gene downstream can simply be characterized by induction and addition of glucose and IPTG to activate or deactivate the GFP system.
Characterization Design:
We prefer to characterize the Part: BBa_K741002 because of the accessibility of the materials. We aim to demonstrate the effect of glucose or IPTG addition to GFP expression. The strains used in this characterization is TOP10, BL21, and DH5alpha E. coli strains.
1. Competent cell preparation.
2. Transformation of the Part:BBa_K741002 into DH5a, BL21, and TOP10 strain.
3. Transfer of a single colony to 2 ml tryptic soy broth medium with 50 µg/ml of chloramphenicol. Incubation at 37℃ for 60 minutes.
4. Addition of 0, 500, 800, 1000 mM of glucose and 1000 mM of IPTG.
5. Transfer of 100 µL from each group to each well. Each sample is transferred to 2 wells.
After the induction of glucose and IPTG, the optical density (OD) and GFP fluorescence is measured using plate reader.
6. Measurement of optical density using plate reader (wavelength= 490 nm).
7. Incubation at 37℃ for 15 minutes.
8. Measurement of optical density using plate reader (wavelength= 490 nm).
9. Incubation at 37℃ for 15 minutes.
10. Measurement of optical density using plate reader (wavelength= 490 nm).
11. Incubation at 37℃ for 15 minutes.
12. Measurement of optical density using plate reader (wavelength= 490 nm).
Furthermore, the inducted bacteria are harvested and put into lysis mode via alkaline solution until denaturation occurred. The addition of neutralizing buffer began the process of precipitation and left the bacterial DNA plasmids in the solution. The plasmids in the solution is precipitated and spun in order to purify and separate the nucleic acid from the solution. The plasmid is isolated and ran through gel electrophoresis to analyse the remaining genetic fragments.
Results:
CALLIBRATION
We follow the protocol and make sure that our fluorescence standard curve are in line with the protocol using the iGEM measurement kit. With the curves shown below.
MEASUREMENT
Three groups are set throughout this experiment with group A containing DH5a strain with glucose and IPTG induction with varying concentrations spread out through 5 subgroups, group B containing TOP10 strain, group C containing BL21 strain. Well A1-2, B1-2, C1-2 are set as negative control without the addition of any glucose (0 mM glucose). Well A11-12, B11-12, C11-12 are blanks. See figure 1.
Each well contains 100 µL of solution. The optical density of each well is measured using plate reader under 490 nm wavelength. Results of each group are shown in bars and tables below. Optical Density is repeatly measured after 15 minutes, 30 minutes, and 45 minutes of incubation (37°C) and ran through the plate reader again consecutively for the until the 4th time.
Discussion:
A control mechanism of plac in response to glucose increases the production of β-galactosidase in the absence of glucose. Cyclic adenosine monophosphate (cAMP) is inversely proportional to that of glucose. It binds to the CAP, which in turn allows the CAP to bind to the CAP binding site, which assists the RNAP in binding to the DNA. In the absence of glucose, the cAMP concentration is high and binding of CAP-cAMP to the DNA significantly increases the production of β-galactosidase, enabling the cell to hydrolyse lactose, release galactose and glucose, and activates the GFP system. Meanwhile in response to presence of glucose, the production of β-galactosidase decreases and in the following chain of events blocks the binding of CAP-cAMP to the DNA and therefore lactose hydrolysis doesn’t occur and the GFP system is deactivated. On the other hand, IPTG works almost analogously to galactocydes therefore the induction of IPTG represses the lactose hydrolysis thus the GFP system is activated.
In accordance with the theory, the additon of glucose deactivated the GFP system in dose-dependent manner. The Part: BBa_K741002 designer stated that the leak expression of plac is quite high. E. coli can not express enough lacI to repress the expression of plac. Even without the existence of IPTG, GFP is expressed. This is why the control group (0 mM glucose) produced the highest value of Fluorescein/OD in our experiment.
On the other hand, our results suggest that the addition of 1000mM IPTG doesn’t activate the GFP system. On the contrary, the Fluorescein/OD produced is even lower than 0 mM glucose and 1000 mM glucose group. This might be because of the limitation of our research such as the scarcity of the materials needed for this experiment and also limited funds, so that we have to use our lab's IPTG which might have been damaged due to improper and/or prolonged storage.
In order to confirm that the Part:BBa_K741002 is indeed transformed to each strain, we isolated the plasmid and ran it on 2% TAE agarose gel electrophoresis along with 100 bp DNA ladder and PSB1C3 plasmid as positive control for 1 hour. The DNA band is not parallel to any of the marker. That’s the only DNA ladder we have in our lab (due to our lack of fund) with 1517 bp as the highest molecular weight. Whereas, the pSB1C3 is 2070 bp and the pSB1C3-BBa_K741002 is 3153 bp. We concluded that all three of our bacteria strains contain the Part:BBa_K741002. The BL21 and TOP10 band is slightly darker. We have considered the possibility that the plasmid concentration in both strains might be lower. Hence, the isolated DNA is less or there may be another mechanism we haven’t figured out.
References
Ramey, W.D. 2002. Experiment A4a – Effect of glucose, lactose and sucrose on the induction β-galactosidase. pp. 1-6. In W.D. Ramey (ed.), Microbiology 421 manual of experimental microbiology, The University of British Columbia, 2002.
Marbach, A., & Bettenbrock, K. 2012. lac operon induction in Escherichia coli: Systematic comparisonof IPTG and TMG induction and influence of the transacetylase LacA. Journal Of Biotechnology, 157(1), 82-88.
Contribution: NYCU_Formosa 2022
Color mixing model
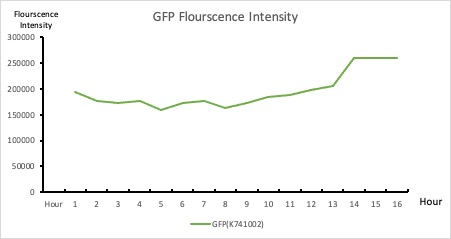
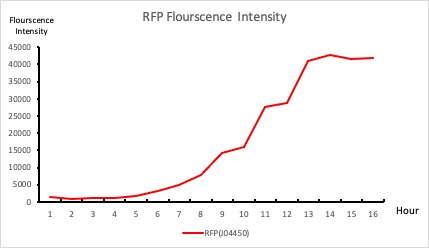
To establish our color mixing model, we measured the fluorescent intensity to time relationship of Part: BBa_J04450(rfp) and Part: BBa_K741002(gfp). With these parameters, we created a model for future teams to deduce the ratio of red and green for their desired color. This simulation shows that different RGB values lead to different color results. What’s more important is that the changing degree of red and green values is based on our protein expression experiments. Thus, according to their desired color, future teams are able to speculate the specific incubation time for E.coli transformed with RFP and GFP genes.
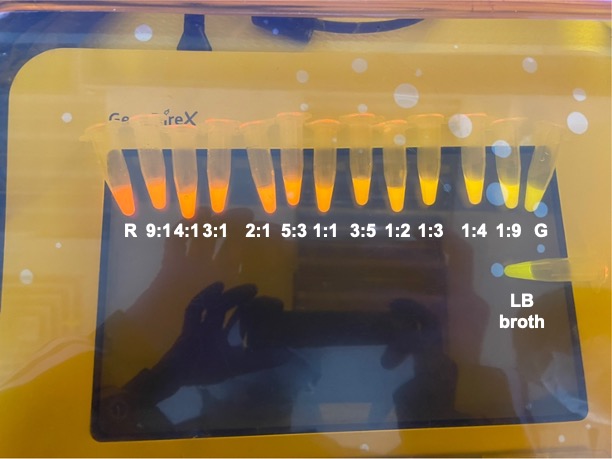
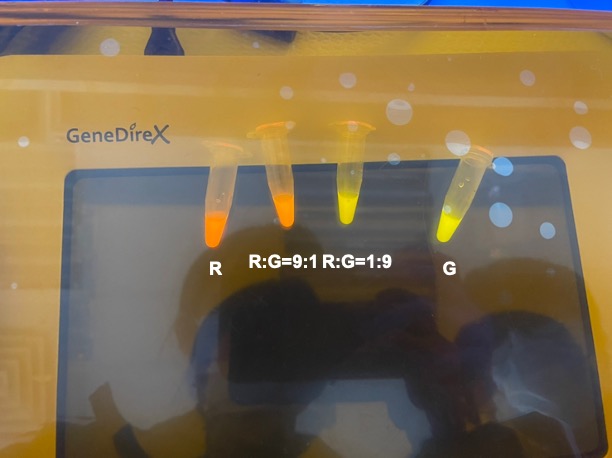
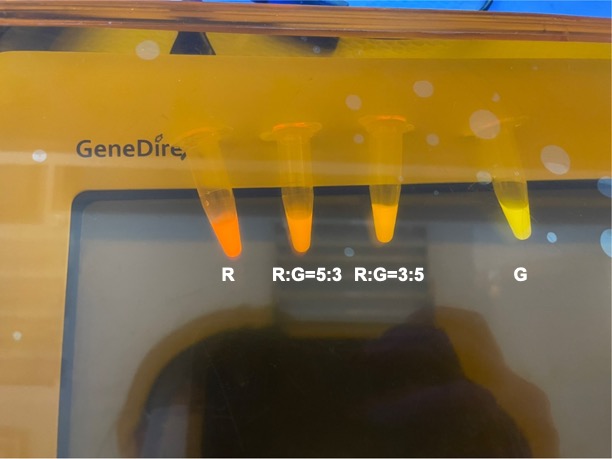
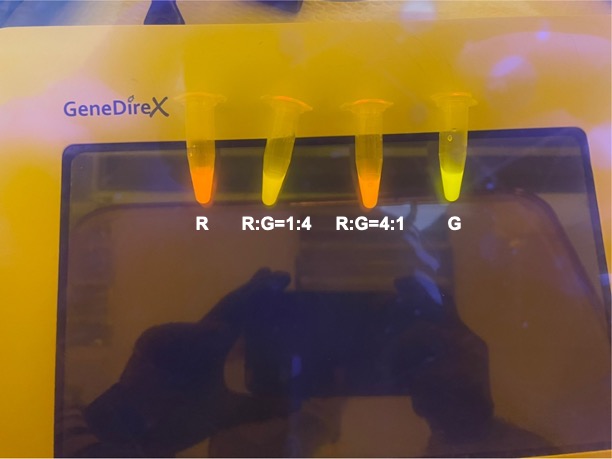
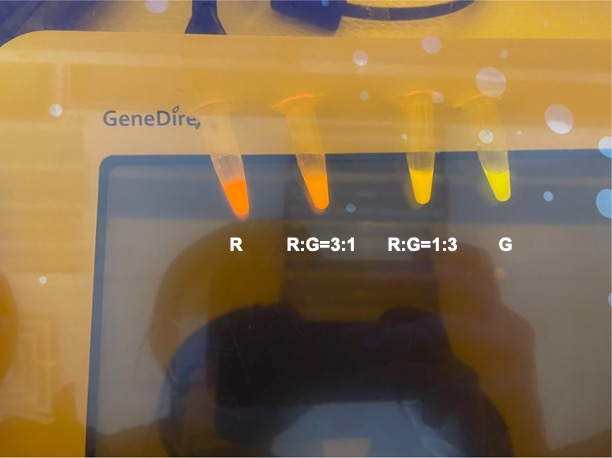
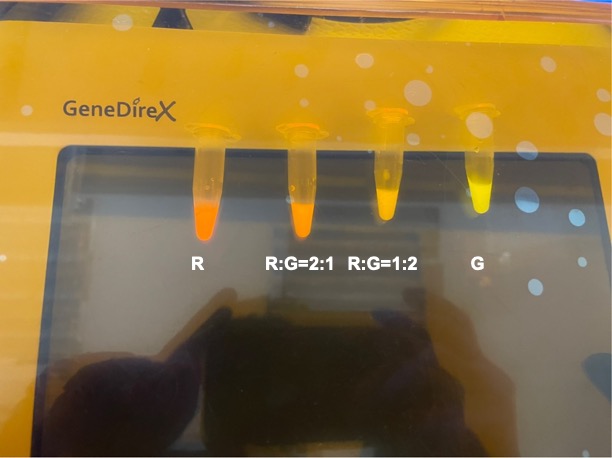
With experimental verification, we have mixed different concentrations of RFP and GFP in fixed value of 200μL, which includes ratio 1:1, 5:3, 2:1, 3:1, 4:1, 9:1, 1:9, 4:1, 3:1, 2:1.
Figure 1. RFP : Flourscecnce Intensity of RFP over time
Figure 2. GFP : Flourscecnce Intensity of GFP over time
Figure 3. Different combinations of RFP and GFP
Figure 4. Combinations of RFP and GFP of 1:9 and 9:1.
Figure 5. Combinations of RFP and GFP of 1:5 and 5:1.
Figure 6. Combinations of RFP and GFP of 1:4 and 4:1.
Figure 7. Combinations of RFP and GFP of 1:3 and 3:1.
Figure 8. Combinations of RFP and GFP of 1:2 and 2:1.
Figure 9. Color Mixing Model 1.
Figure 10. Color Mixing Model 2.


