Difference between revisions of "Part:BBa K3017011"
| (7 intermediate revisions by the same user not shown) | |||
| Line 13: | Line 13: | ||
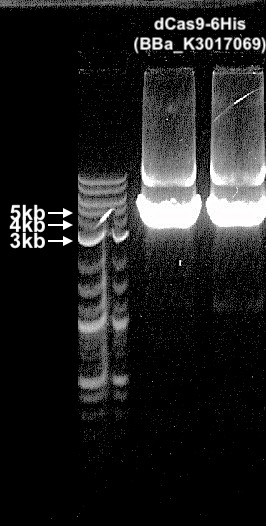
| + | [[File:T--Hong_Kong_HKUST--dCas9_1.jpeg|180px|thumb|<p><b>Figure1. PCR verification of dCas9 transformed cells</b></P><p>Two chloramphenicol selected colonies were picked and inoculated in 5ml of LB and incubated in 37℃ for overnight. The cultures were then extracted with plasmid and checked by PCR with VRII and VR primers. A band appeared in between 4 to 5 Kb showed success in transformation. The expected DNA size was 4.6 Kb</p>]] | ||
<h2>Transformation and expression of dCas9 in DH5-α <i>E.coli</i></h2> | <h2>Transformation and expression of dCas9 in DH5-α <i>E.coli</i></h2> | ||
<p>The resulting plasmid was then transformed into DH5α <i>E. coli</i> using heat shock, and cells were selected by chloramphenicol followed by Miniprep plasmid extraction and PCR verification (Figure. 1).</p> | <p>The resulting plasmid was then transformed into DH5α <i>E. coli</i> using heat shock, and cells were selected by chloramphenicol followed by Miniprep plasmid extraction and PCR verification (Figure. 1).</p> | ||
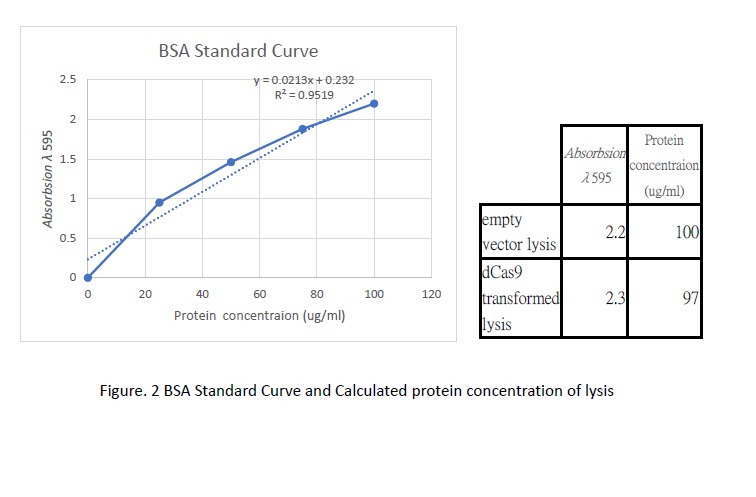
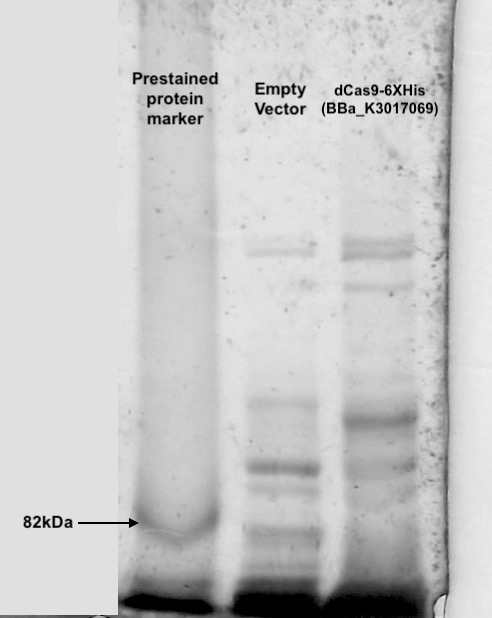
| − | <p>Following transformation, we further went on checking the expression of dCas9. Cell lysis was prepared by sonication in NP-40 lysis buffer. The protein concentration of the lysis was checked by Bradford Assay against the BSA standard curve (Figure. 2). 10ul of cell lysis was used to run through the SDS-PAGE (5% stacking, 6% resolving). After the electrophoresis, the gel was stained with Coomassie Blue to visualize the protein (Figure. 3). As shown in the gel, there is an extra band much larger than 82kDa exist only in the dCas9 transformed cells but not appear in the cells transformed with an empty vector.</p> | + | [[File:T--Hong_Kong_HKUST--dCas9_2.jpeg|450px|thumb|center]] |
| + | |||
| + | <p>Following transformation, we further went on checking the expression of dCas9. Cell lysis was prepared by sonication in NP-40 lysis buffer. The protein concentration of the lysis was checked by Bradford Assay against the BSA standard curve (Figure. 2). 10ul of cell lysis was used to run through the SDS-PAGE (5% stacking, 6% resolving). After the electrophoresis, the gel was stained with Coomassie Blue to visualize the protein (Figure. 3). As shown in the gel, there is an extra band much larger than 82kDa exist only in the dCas9 transformed cells but not appear in the cells transformed with an empty vector. This result showed the first clue of the expression of dCas9 whose molecular weight is expected to be 160kDa (Anti-CRISPR-Cas9 antibody [7A9-3A3] (ab191468) | Abcam).</p> | ||
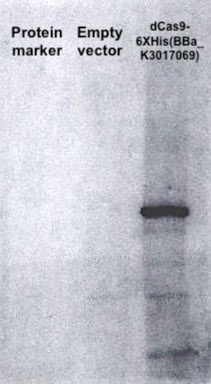
<p>To further verify if that extra band is really the dCas9, we repeated the experiment again with all the condition remain the same except that instead of visualizing by Coomassie Blue, we changed to use western blot targeting the 6XHis tag at the C-terminal of dCas9. The western blotting was done using a His-probe Antibody (1:2000, Rabbit) and a secondary HRP-goat anti-rabbit antibody (1:2000). 500ul of ECL detection reagents (Amersham) was then added and the band can subsequently be visualized using light-sensitive X-ray films. As shown in the figure, a clear band only appeared in the dCas9 transformed cells verifying the extra band shown in figure 2 is indeed the dCas9.</p> | <p>To further verify if that extra band is really the dCas9, we repeated the experiment again with all the condition remain the same except that instead of visualizing by Coomassie Blue, we changed to use western blot targeting the 6XHis tag at the C-terminal of dCas9. The western blotting was done using a His-probe Antibody (1:2000, Rabbit) and a secondary HRP-goat anti-rabbit antibody (1:2000). 500ul of ECL detection reagents (Amersham) was then added and the band can subsequently be visualized using light-sensitive X-ray films. As shown in the figure, a clear band only appeared in the dCas9 transformed cells verifying the extra band shown in figure 2 is indeed the dCas9.</p> | ||
| − | <table style="width: | + | <table style="width:70%"> |
<tr> | <tr> | ||
| − | |||
<th> [[File:T--Hong_Kong_HKUST--dCas9_3.jpeg|200px|thumb|<p><b>Figure 3. dCas9 expression check with SDS-PAGE and Coomassie Blue staining</b></p><p>Cell lysis were prepared by overnight growing in 5ml LB under 37℃ followed sonication in NP-40 lysis buffer. 10ul of cell lysis was mixed with 10ul of loading buffer and run through an SDS-PAGE(5% stacking and 6% resolving). Coomassie blue was then used to visualize the bands. An extra band larger than 82kDa can be seen only in the dCas9 transformed cells.</p>]]</th> | <th> [[File:T--Hong_Kong_HKUST--dCas9_3.jpeg|200px|thumb|<p><b>Figure 3. dCas9 expression check with SDS-PAGE and Coomassie Blue staining</b></p><p>Cell lysis were prepared by overnight growing in 5ml LB under 37℃ followed sonication in NP-40 lysis buffer. 10ul of cell lysis was mixed with 10ul of loading buffer and run through an SDS-PAGE(5% stacking and 6% resolving). Coomassie blue was then used to visualize the bands. An extra band larger than 82kDa can be seen only in the dCas9 transformed cells.</p>]]</th> | ||
<th>[[File:T--Hong_Kong_HKUST--dCas9_4.jpeg|180px|thumb|<p><b>Figure 4. dCas9 expression check with SDS-PAGE and Western Blot</b></p><p>Experiment as stated in Figure. 2 was repeated with a different visualizing method. Protein in the SDS-PAGE was transferred to a nitrocellulose membrane and blotted with primary anti-His antibody (1:2000, Rabbit) after blocking of the membrane. After that, the secondary HRP-anti-rabbit antibody was applied. After incubation, ECL detection reagents were added and visualize using light-sensitive X-ray film. A clear band only exist in the dCas9 transformed cells confirmed the expression of dCas9.</p>]]</th> | <th>[[File:T--Hong_Kong_HKUST--dCas9_4.jpeg|180px|thumb|<p><b>Figure 4. dCas9 expression check with SDS-PAGE and Western Blot</b></p><p>Experiment as stated in Figure. 2 was repeated with a different visualizing method. Protein in the SDS-PAGE was transferred to a nitrocellulose membrane and blotted with primary anti-His antibody (1:2000, Rabbit) after blocking of the membrane. After that, the secondary HRP-anti-rabbit antibody was applied. After incubation, ECL detection reagents were added and visualize using light-sensitive X-ray film. A clear band only exist in the dCas9 transformed cells confirmed the expression of dCas9.</p>]]</th> | ||
| Line 31: | Line 33: | ||
| − | |||
| − | |||
| − | |||
| − | |||
| − | |||
Latest revision as of 03:25, 21 October 2019
dCas9-6XHis
The CRISPR associated protein, in our case, dCas9, is a non-specific deactivated endonuclease. dCas9 is catalytically dead with mutations D10A and H840A. It binds to the target protein, when coupled with single-guide RNA, but does not induce any DNA breakage as in Cas9 enzyme.
In our project, Combined CRISPRi and antisense RNA Toggle Switch, dCas9 plays a central role in CRISPR interference. dCas9 acts as an agent of steric hindrance to block mRNA polymerization to repress expression levels of target genes.
Cloning
As one of the most important components of our circuit, dCas9 needed to be cloned and expressed in the cells. The Streptococcus pyogenes dCas9 sequence used was kindly given by Dr. Hi Yi Mak, an associate professor of life science in HKUST who also have worked with dCas9. However, the sequence of that dCas9 was noticed to have 5 PstI cut sites within the coding sequence meaning that the standard assembly method using EcoRI, XbaI, SpeI and PstI would not be compatible. We thus have added a SalI cut site after PstI to replace PstI by PCR. The other basic parts (BBa_J23110, BBa_B0032 and BBa_B0015) that is used in subcloning were also added with the SalI cut site. The three parts were then constructed in a BBa_PSB1C3 vector to form a dCas9 expressing vector.

Figure1. PCR verification of dCas9 transformed cells
Two chloramphenicol selected colonies were picked and inoculated in 5ml of LB and incubated in 37℃ for overnight. The cultures were then extracted with plasmid and checked by PCR with VRII and VR primers. A band appeared in between 4 to 5 Kb showed success in transformation. The expected DNA size was 4.6 Kb
Transformation and expression of dCas9 in DH5-α E.coli
The resulting plasmid was then transformed into DH5α E. coli using heat shock, and cells were selected by chloramphenicol followed by Miniprep plasmid extraction and PCR verification (Figure. 1).
Following transformation, we further went on checking the expression of dCas9. Cell lysis was prepared by sonication in NP-40 lysis buffer. The protein concentration of the lysis was checked by Bradford Assay against the BSA standard curve (Figure. 2). 10ul of cell lysis was used to run through the SDS-PAGE (5% stacking, 6% resolving). After the electrophoresis, the gel was stained with Coomassie Blue to visualize the protein (Figure. 3). As shown in the gel, there is an extra band much larger than 82kDa exist only in the dCas9 transformed cells but not appear in the cells transformed with an empty vector. This result showed the first clue of the expression of dCas9 whose molecular weight is expected to be 160kDa (Anti-CRISPR-Cas9 antibody [7A9-3A3] (ab191468) | Abcam).
To further verify if that extra band is really the dCas9, we repeated the experiment again with all the condition remain the same except that instead of visualizing by Coomassie Blue, we changed to use western blot targeting the 6XHis tag at the C-terminal of dCas9. The western blotting was done using a His-probe Antibody (1:2000, Rabbit) and a secondary HRP-goat anti-rabbit antibody (1:2000). 500ul of ECL detection reagents (Amersham) was then added and the band can subsequently be visualized using light-sensitive X-ray films. As shown in the figure, a clear band only appeared in the dCas9 transformed cells verifying the extra band shown in figure 2 is indeed the dCas9.
Sequence and Features
- 10INCOMPATIBLE WITH RFC[10]Illegal PstI site found at 790
Illegal PstI site found at 2212
Illegal PstI site found at 2416
Illegal PstI site found at 2446
Illegal PstI site found at 3658 - 12INCOMPATIBLE WITH RFC[12]Illegal PstI site found at 790
Illegal PstI site found at 2212
Illegal PstI site found at 2416
Illegal PstI site found at 2446
Illegal PstI site found at 3658 - 21INCOMPATIBLE WITH RFC[21]Illegal BglII site found at 251
- 23INCOMPATIBLE WITH RFC[23]Illegal PstI site found at 790
Illegal PstI site found at 2212
Illegal PstI site found at 2416
Illegal PstI site found at 2446
Illegal PstI site found at 3658 - 25INCOMPATIBLE WITH RFC[25]Illegal PstI site found at 790
Illegal PstI site found at 2212
Illegal PstI site found at 2416
Illegal PstI site found at 2446
Illegal PstI site found at 3658
Illegal NgoMIV site found at 1078
Illegal NgoMIV site found at 2182
Illegal NgoMIV site found at 2255
Illegal NgoMIV site found at 2740
Illegal NgoMIV site found at 3649 - 1000COMPATIBLE WITH RFC[1000]


