Difference between revisions of "Part:BBa K141000"
Qiuxinyuan12 (Talk | contribs) (→Contribution: NUDT_CHINA 2023) |
|||
| (23 intermediate revisions by 3 users not shown) | |||
| Line 1: | Line 1: | ||
__NOTOC__ | __NOTOC__ | ||
<partinfo>BBa_K141000 short</partinfo> | <partinfo>BBa_K141000 short</partinfo> | ||
| + | |||
| + | |||
Ucp1 is a gene which encodes for UCP1 protein. | Ucp1 is a gene which encodes for UCP1 protein. | ||
| Line 7: | Line 9: | ||
UCP1 uncouples the respiratory chain of ATP production, converting the metabolic energy in heat. | UCP1 uncouples the respiratory chain of ATP production, converting the metabolic energy in heat. | ||
| + | <center> | ||
| + | {| | ||
| + | |[[Image:function.jpg|400px]] | ||
| + | |} | ||
| + | </center> | ||
| − | |||
UCP1 is a 33kd protein which is exclusively located in the brown adipocites. | UCP1 is a 33kd protein which is exclusively located in the brown adipocites. | ||
| Line 15: | Line 21: | ||
The protein has a tripartite structure. The structure displays an around 100 residues region which is three times repeated. Each part encodes for two transmembrane segments and one long hydrophilic loop.The functional carrier unit is an homodimer. | The protein has a tripartite structure. The structure displays an around 100 residues region which is three times repeated. Each part encodes for two transmembrane segments and one long hydrophilic loop.The functional carrier unit is an homodimer. | ||
| + | <center> | ||
| + | {| | ||
| + | |[[Image:Structure.jpg|450px]] | ||
| + | |} | ||
| + | </center> | ||
| − | |||
The main difference between UCP1 and most of the proteins with a nuclear codification is the lack of the importation targeting to the mitochondria in UCP+ proteins. | The main difference between UCP1 and most of the proteins with a nuclear codification is the lack of the importation targeting to the mitochondria in UCP+ proteins. | ||
| Line 23: | Line 33: | ||
The second loop of the matrix is essential for the insertion of the protein in the inner mitochondrial matrix. | The second loop of the matrix is essential for the insertion of the protein in the inner mitochondrial matrix. | ||
Purine nucleotides act as inhibitors of protein activity and esterificated fatty acids act as inductors. | Purine nucleotides act as inhibitors of protein activity and esterificated fatty acids act as inductors. | ||
| + | |||
| + | |||
| + | |||
| + | Apart from monitoring temperature evolution, we also characterized O.D. variations of each of our strains. We took O.D. measures every one a half hours for nine hours. We carried out this experiment both in Erlenmeyer flasks in the 30ºC shaking stove and in our LCCs. | ||
| + | This measurements were useful in order to determine some parameters for our Black Box Model. Besides, we were able to prove that the UCP was indeed being produced even though we could not see the temperature increase. Since our mutant strains Gly175Δ and Gly76Δ do not have the same growing rate as UCP+ when they are expressing the protein, the difference between the results in the strains showed that the reason for our lack of temperature increase was that we had not found the optimum conditions yet. This results made us keep on working until we obtained successful results. | ||
| + | |||
| + | Strains growth equations: | ||
| + | |||
| + | {| | ||
| + | |[[Image:growthucp-lastone.jpg|left|450px]] | ||
| + | |[[Image:growthucp+lastone.jpg|right|450px]] | ||
| + | |- | ||
| + | |[[Image:growthucp76lastone.jpg|left|450px]] | ||
| + | |[[Image:growthucp175lastone.jpg|right|450px]] | ||
| + | |} | ||
| + | |||
| + | |||
| + | '''Model caonstants and parameters:''' | ||
| + | |||
| + | |||
| + | The black box model simulates the temperature evolution of the system as a function of the growth rate, galactose concentration and thermogenin expresion. We assume that our system can be reproduced by the following system of equations: | ||
| + | |||
| + | [[Image:equationsmodelconstantpikachu.jpg]] | ||
| + | |||
| + | where: | ||
| + | |||
| + | * first equation: Growth of the culture: logistic growth of the different mutants used in our experiments. | ||
| + | * second equation: Galactose evolution: Galactose is the metabolite which induces the thermogenin expresion. | ||
| + | * third equation: Thermogenin concentration level. | ||
| + | * Fourth equation: Temperature evolution. the first term of the equation represents the losses to the ambient of the calorimeter and the second one the temperature increase as a consequence of the thermogenin expresion. | ||
| + | |||
| + | From a sample of 10 experiments in which the evolution of the temperature of the four strain was measured we perform a fit using the software simulink. | ||
| + | |||
| + | |||
| + | '''Common parameters values:''' | ||
| + | |||
| + | |||
| + | |||
| + | [[Image:commonparametershar.jpg|450px]] | ||
| + | |||
| + | |||
| + | |||
| + | '''Ucp- own parameters''' | ||
| + | |||
| + | |||
| + | [[Image:ucp-esunafiesta.jpg|800px]] | ||
| + | |||
| + | |||
| + | Galactose comsumption and heat effects. | ||
| Line 39: | Line 98: | ||
<partinfo>BBa_K141000 parameters</partinfo> | <partinfo>BBa_K141000 parameters</partinfo> | ||
<!-- --> | <!-- --> | ||
| + | |||
| + | ==Contribution: NUDT_CHINA 2023== | ||
| + | The uncoupling protein UCP1, the most well-studied mitochondrial uncoupler that regulates thermogenesis and cellular energy expenditure, has been used by the team iGEM08_Valencia in their project to control the temperature of the yeast culture. In their documentation of BBa_K141000, they mainly provided functional data on how the overexpression of UCP1 would affect the temperature and the growth kinetics of yeast. Building on this, we supplemented some useful data regarding where UCP1 is located and how it affects cell energy expenditure in HEK-293T cells, a commonly used mammalian cell line. | ||
| + | |||
| + | ===Methods=== | ||
| + | To visualize the subcellular location of UCP1, we fused an EGFP protein on the N-Terminus of UCP1 (EGFP-UCP1). HEK-293T cells were transfected with this EGFP-UCP1 expressing plasmid for 48 h before the localization of EGFP-UCP1 was observed via widefield fluorescent microscopy and live-cell confocal imaging. We also analyzed the glucose consumption of the transfected cells by measuring the glucose levels in the culture medium. This analysis represented the level of cellular energy expenditure. | ||
| + | ===Results=== | ||
| + | Both wide-field fluorescent imaging ('''Figure 1a''') and live-cell confocal imaging (Figure 1b) showed highly specific colocalization of EGFP-UCP1 signal with mitochondria markers (MTS-mcherry, '''Figure 1b'''). Moreover, cells transfected with pNC088 showed a significantly higher glucose consumption compared to the control cells transfected with pcDNA3.1(+) vector ('''Figure 1c'''), suggesting a significantly improved energy consumption in these cells. | ||
| + | |||
| + | <html> | ||
| + | |||
| + | <figure class="figure"> | ||
| + | <img src="https://static.igem.wiki/teams/4960/wiki/charactrization-of-ucp1-localization-and-function-in-hek-293t-cells.png" class="figure-img img-fluid rounded" height="250px"> | ||
| + | |||
| + | </figure> | ||
| + | |||
| + | </html> | ||
| + | '''Figure 1. Charactrization of UCP1 localization and function in HEK-293T cells. (a, b)''' Localization EGFP-UCP1 in HEK-293T cells. For wide-field microscopy in '''a''', cells were transfected with a EGFP-UCP1 expressing plasmid. For confocal images in '''b''', cells were co-transfected with MTS-mcherry and EGFP-UCP. Photos were taken 48 h post transfection, scale bar: 100μm for wide-field microscopy and 10 μm for confocal microscopy. Data are representative images of 3 independent experiments. '''(c)''' Charactrization of cellular metabolism in HEK-293T cells transfected with either EGFP-UCP1 or pcDNA3.1(+). Glucose concentration in the cell culture medium was measured 48 h after transfection; data shows mean±SD, n=3 independent experiments. | ||
| + | <br> | ||
Latest revision as of 05:27, 12 October 2023
Ucp1
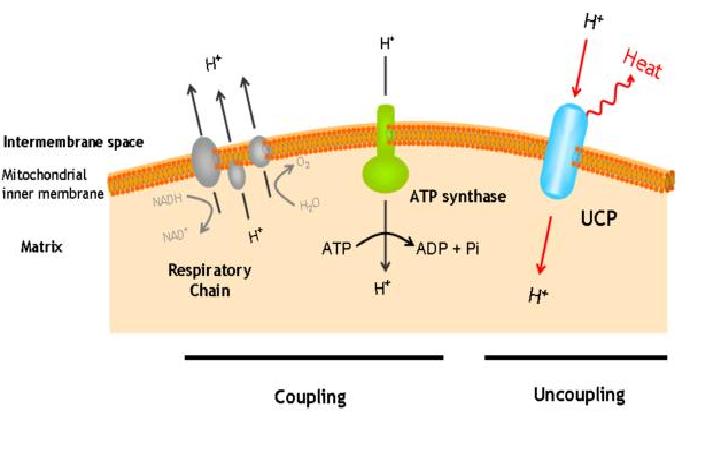
Ucp1 is a gene which encodes for UCP1 protein.
The uncoupling protein UCP1 is a proton carrier characteristic of brown adipose tissue. UCP1 uncouples the respiratory chain of ATP production, converting the metabolic energy in heat.
|
UCP1 is a 33kd protein which is exclusively located in the brown adipocites.
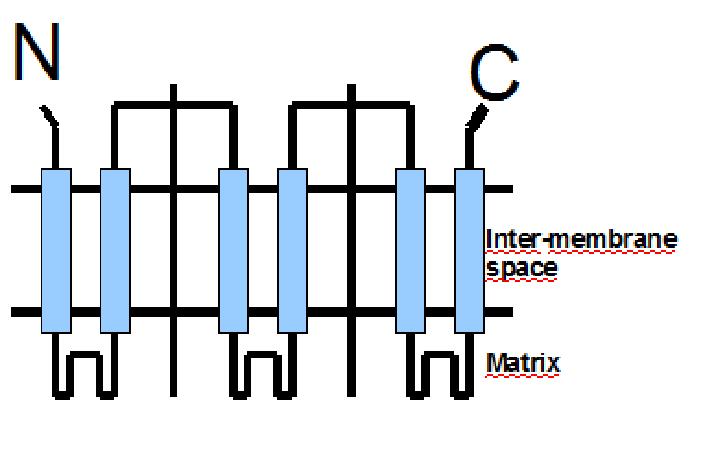
It is an integral protein present in inner mitocondrial membrane.
The protein has a tripartite structure. The structure displays an around 100 residues region which is three times repeated. Each part encodes for two transmembrane segments and one long hydrophilic loop.The functional carrier unit is an homodimer.
|
The main difference between UCP1 and most of the proteins with a nuclear codification is the lack of the importation targeting to the mitochondria in UCP+ proteins.
The condition that determines the mitochondria as the protein target lays in the first loop which protudes in the mitochondrial matrix.
The second loop of the matrix is essential for the insertion of the protein in the inner mitochondrial matrix. Purine nucleotides act as inhibitors of protein activity and esterificated fatty acids act as inductors.
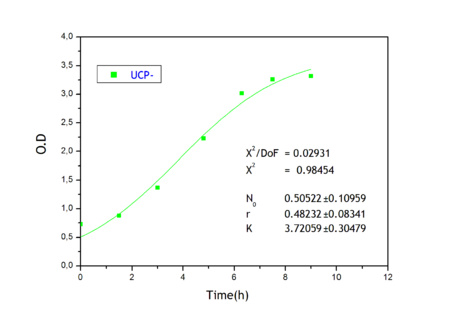
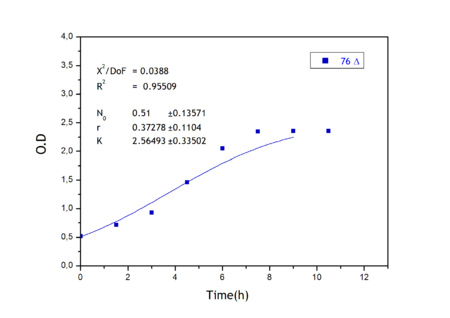
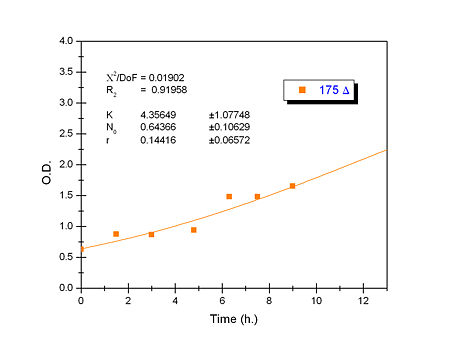
Apart from monitoring temperature evolution, we also characterized O.D. variations of each of our strains. We took O.D. measures every one a half hours for nine hours. We carried out this experiment both in Erlenmeyer flasks in the 30ºC shaking stove and in our LCCs. This measurements were useful in order to determine some parameters for our Black Box Model. Besides, we were able to prove that the UCP was indeed being produced even though we could not see the temperature increase. Since our mutant strains Gly175Δ and Gly76Δ do not have the same growing rate as UCP+ when they are expressing the protein, the difference between the results in the strains showed that the reason for our lack of temperature increase was that we had not found the optimum conditions yet. This results made us keep on working until we obtained successful results.
Strains growth equations:
Model caonstants and parameters:
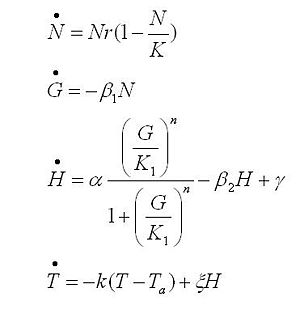
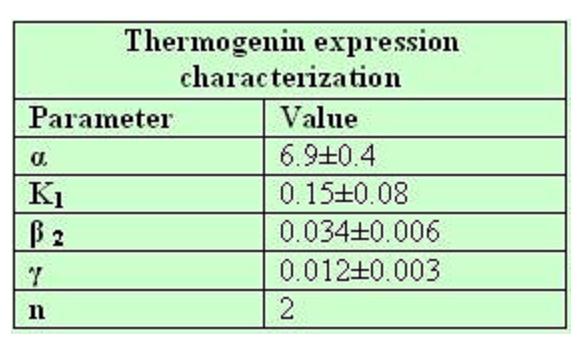
The black box model simulates the temperature evolution of the system as a function of the growth rate, galactose concentration and thermogenin expresion. We assume that our system can be reproduced by the following system of equations:
where:
- first equation: Growth of the culture: logistic growth of the different mutants used in our experiments.
- second equation: Galactose evolution: Galactose is the metabolite which induces the thermogenin expresion.
- third equation: Thermogenin concentration level.
- Fourth equation: Temperature evolution. the first term of the equation represents the losses to the ambient of the calorimeter and the second one the temperature increase as a consequence of the thermogenin expresion.
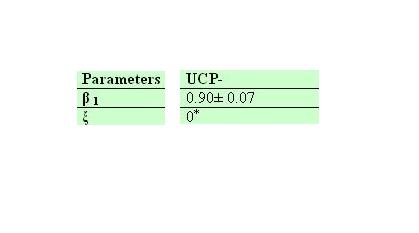
From a sample of 10 experiments in which the evolution of the temperature of the four strain was measured we perform a fit using the software simulink.
Common parameters values:
Ucp- own parameters
Galactose comsumption and heat effects.
Sequence and Features
- 10COMPATIBLE WITH RFC[10]
- 12COMPATIBLE WITH RFC[12]
- 21INCOMPATIBLE WITH RFC[21]Illegal BglII site found at 47
Illegal BglII site found at 347
Illegal BamHI site found at 835 - 23COMPATIBLE WITH RFC[23]
- 25INCOMPATIBLE WITH RFC[25]Illegal NgoMIV site found at 58
- 1000COMPATIBLE WITH RFC[1000]
Contribution: NUDT_CHINA 2023
The uncoupling protein UCP1, the most well-studied mitochondrial uncoupler that regulates thermogenesis and cellular energy expenditure, has been used by the team iGEM08_Valencia in their project to control the temperature of the yeast culture. In their documentation of BBa_K141000, they mainly provided functional data on how the overexpression of UCP1 would affect the temperature and the growth kinetics of yeast. Building on this, we supplemented some useful data regarding where UCP1 is located and how it affects cell energy expenditure in HEK-293T cells, a commonly used mammalian cell line.
Methods
To visualize the subcellular location of UCP1, we fused an EGFP protein on the N-Terminus of UCP1 (EGFP-UCP1). HEK-293T cells were transfected with this EGFP-UCP1 expressing plasmid for 48 h before the localization of EGFP-UCP1 was observed via widefield fluorescent microscopy and live-cell confocal imaging. We also analyzed the glucose consumption of the transfected cells by measuring the glucose levels in the culture medium. This analysis represented the level of cellular energy expenditure.
Results
Both wide-field fluorescent imaging (Figure 1a) and live-cell confocal imaging (Figure 1b) showed highly specific colocalization of EGFP-UCP1 signal with mitochondria markers (MTS-mcherry, Figure 1b). Moreover, cells transfected with pNC088 showed a significantly higher glucose consumption compared to the control cells transfected with pcDNA3.1(+) vector (Figure 1c), suggesting a significantly improved energy consumption in these cells.


