Difference between revisions of "Part:BBa J23107:Experience"
| (11 intermediate revisions by the same user not shown) | |||
| Line 58: | Line 58: | ||
| − | {|width=' | + | {|width='100%' style='border:1px solid gray' |
|- | |- | ||
|width='10%'| | |width='10%'| | ||
| Line 64: | Line 64: | ||
<I>University of Texas at Austin iGEM 2019</I> | <I>University of Texas at Austin iGEM 2019</I> | ||
|width='60%' valign='top'| | |width='60%' valign='top'| | ||
| − | |||
| + | <h3>UT Austin iGEM 2019: Characterization of metabolic burden of the Anderson Series</h3> | ||
| − | + | <h4>Description</h4> | |
| − | + | The 2019 UT Austin iGEM team transformed the Anderson Series promoters into our 'burden monitor' DH10B strain of E. coli, which contains a constitutive GFP cassette in the genome of the cell. GFP expression fluctuates depending on the number of ribosomes available. Using this strain, we characterized the relative burden (percent reduction in growth rate) of each Anderson Series part. Our results showed a range of growth rate reductions for each of these parts due to ribosomal reallocation from the genome of the host cell, towards the expression of RFP. Anderson Series parts with strong promoters are depicted with darker red colors and Anderson Series parts with weak promoters are depicted with lighter pink colors to show relative RFP expression. | |
| − | + | We saw a positive correlation between relative promoter strength and metabolic burden; parts with stronger promoters expressed less GFP and had a lower growth rate than parts with weaker promoters. The regression line for the graph below was constructed by measuring the burden of 5 parts that were created by the 2019 UT Austin iGEM team that each contained an Anderson Series promoter (<partinfo>J23104</partinfo> or <partinfo>J23110</partinfo>), an RBS of varying strength, and a BFP reporter. For more information on characterization of these parts through the burden monitor, visit our team’s wiki page: [https://https://2019.igem.org/Team:Austin_UTexas] | |
| + | |||
| + | <html> | ||
| + | <figure> | ||
| + | <div class = "left"> | ||
| + | <img src = "https://static.igem.org/mediawiki/parts/a/a0/AndersonCharacterization.jpg" style = "width:550px;height:500px"> | ||
| + | </div> | ||
| + | <figcaption><b>Fig.1:</b>Growth vs GFP Expression graph showing the relative burden positions of the Anderson Series promoters. The parts with strong promoters are depicted in dark red and are clustered near the bottom of the graph because they have lower growth rates and express lower levels of GFP as a result of high cellular burden. The parts with weaker promoter are depicted in light pink ad are clustered near the top of the graph because they have higher growth rates and express higher levels of GFP as a result of low cellular burden.</figcaption> | ||
| + | </figure> | ||
| + | </html> | ||
| + | <br><br> | ||
| + | <html> | ||
| + | <figure> | ||
| + | <div class = "left"> | ||
| + | <img src = "https://static.igem.org/mediawiki/parts/8/80/T--Austin_Utexas--andersontable.png" style = "width:545px;height:375px"> | ||
| + | </div> | ||
| + | <figcaption><b>Table.1:</b> Burden measurements for the Anderson Series promoters measured as percent reduction in growth rate ± 95% confidence interval. </figcaption> | ||
| + | </figure> | ||
| + | </html> | ||
| + | |||
| + | <h4>Importance of Characterizing Burden</h4> | ||
| + | <p> Although often we cannot avoid using a specific burdensome part, knowing in advance that it is burdensome, and that it has a high chance of mutating into a non-functional genetic device, can help with troubleshooting and coming up with alternatives. In the specific case of fluorescent protein-expressing devices, Fluorescence-activated cell sorting (FACS) can be used to filter out individual cells that meet a certain fluorescence threshold. This way, the cells expressing lower levels of the fluorescent protein are weeded out of the population.</p> | ||
Latest revision as of 20:13, 21 October 2019
This experience page is provided so that any user may enter their experience using this part.
Please enter
how you used this part and how it worked out.
Applications of BBa_J23107
Evaluation of Anderson promoter J23107 in B. subtilis by iGEM-Team LMU-Munich 2012
This Anderson promoter was evaluated without fused RFP with the lux operon as a reporter in B. subtilis. See the new BioBrick BBa_K823009 without RFP and have a look at the [http://2012.igem.org/Team:LMU-Munich/Data/Anderson Data] from the evaluation in B. subtilis.
User Reviews
UNIQ8c2a3aa45d4d258a-partinfo-00000000-QINU UNIQ8c2a3aa45d4d258a-partinfo-00000001-QINU
iGEM CINVESTAV_IPN_UNAM CHARACTERIZATION OF IGEM DISTRIBUTION BIOPARTS
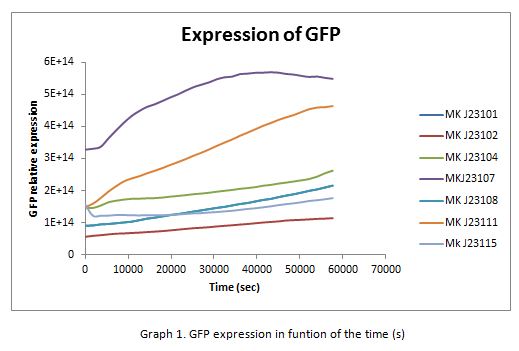
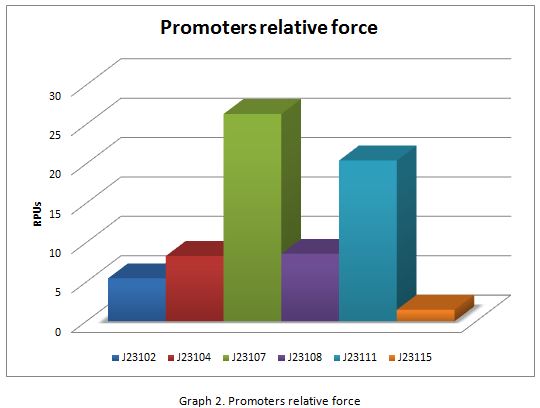
For contribute to the parts registry our team decided to make the characterization of constitutive promoters, in E. coli, belonging to the family isolated from a small combinatorial library (J23101 , J23102, J23104, J23107, J23108, J2311, and J23115) which were attached to GFP, in psB1C3, to determine promoter activity, using the equipment Victor X3 Multilabel Plate Reader.
Fig. 1 Construction of the promoter J23107 expressing GFP.
Methods
With the selected colonies, an overnight culture was made in M9 media(minimal media supplemented with 0.2% CAA). After 12 hours the culture was transferred to a 96 well plate at a 1:10 dilution (20 μl of culture and 180 μL of fresh M9 medium). OD and fluorescence measurements of the selected colonies were performed at intervals of 30 minutes for 16 h. From the results the PopS were calculated (polymerases per second).
Modeling
The ecuations used for calulated de promoter activity were based on (R. K. Jason et. al 2009).
Results
In the following graphs there is shown the GFP expression in function of th time and the realtive promotor intensity.
With the previous results of the characterization of the promoters there is concluded that the promoter J23107, is the strongest because it produces more RPUs”
|
•••••
University of Texas at Austin iGEM 2019 |
UT Austin iGEM 2019: Characterization of metabolic burden of the Anderson SeriesDescriptionThe 2019 UT Austin iGEM team transformed the Anderson Series promoters into our 'burden monitor' DH10B strain of E. coli, which contains a constitutive GFP cassette in the genome of the cell. GFP expression fluctuates depending on the number of ribosomes available. Using this strain, we characterized the relative burden (percent reduction in growth rate) of each Anderson Series part. Our results showed a range of growth rate reductions for each of these parts due to ribosomal reallocation from the genome of the host cell, towards the expression of RFP. Anderson Series parts with strong promoters are depicted with darker red colors and Anderson Series parts with weak promoters are depicted with lighter pink colors to show relative RFP expression. We saw a positive correlation between relative promoter strength and metabolic burden; parts with stronger promoters expressed less GFP and had a lower growth rate than parts with weaker promoters. The regression line for the graph below was constructed by measuring the burden of 5 parts that were created by the 2019 UT Austin iGEM team that each contained an Anderson Series promoter (BBa_J23104 or BBa_J23110), an RBS of varying strength, and a BFP reporter. For more information on characterization of these parts through the burden monitor, visit our team’s wiki page: [1]
Importance of Characterizing BurdenAlthough often we cannot avoid using a specific burdensome part, knowing in advance that it is burdensome, and that it has a high chance of mutating into a non-functional genetic device, can help with troubleshooting and coming up with alternatives. In the specific case of fluorescent protein-expressing devices, Fluorescence-activated cell sorting (FACS) can be used to filter out individual cells that meet a certain fluorescence threshold. This way, the cells expressing lower levels of the fluorescent protein are weeded out of the population. |


