
Difference between revisions of "Part:BBa J364000:Experience"
(→User Reviews) |
Kristiturton (Talk | contribs) (→2019 Lethbridge iGEM Team) |
||
| (10 intermediate revisions by 2 users not shown) | |||
| Line 24: | Line 24: | ||
'''''Experiment conditions:''''' | '''''Experiment conditions:''''' | ||
| − | <p>1. 37℃ incubator for | + | <p>1. 37℃ incubator for E.coli DH5α; </p> |
| − | <p>2.LB liquid medium.</p> | + | <p>2. LB liquid medium.</p> |
| − | '''''Results''''' | + | '''''Analyze & Results:''''' |
<p>We use this part [https://parts.igem.org/Part:BBa_J364000 BBa_J364000] as our original source of GFP proteins. As our expectation, this part can work normally under our experiment conditions.</p> | <p>We use this part [https://parts.igem.org/Part:BBa_J364000 BBa_J364000] as our original source of GFP proteins. As our expectation, this part can work normally under our experiment conditions.</p> | ||
<p>For the modification, we added a spacer sequence and NGG site just on the upstream of the promoter for repression of GFP expression. And this modification is very successful because the repression is obvious according to the Figure 1 below.</p> | <p>For the modification, we added a spacer sequence and NGG site just on the upstream of the promoter for repression of GFP expression. And this modification is very successful because the repression is obvious according to the Figure 1 below.</p> | ||
[[File:SCU_China-2018_dCas9_repression.png]] | [[File:SCU_China-2018_dCas9_repression.png]] | ||
| − | <p>As the picture shows, the part:BBa_J364000 and our part: | + | <p>As the picture shows, the part:BBa_J364000 and our part:[https://parts.igem.org/Part:BBa_K2611001 BBa_K2611001] can both function well. And for the <b>improvement:</b> this part's expression can be regulated under the control of dCas9 system.</p> |
=== 2017 Georgia State iGEM Team === | === 2017 Georgia State iGEM Team === | ||
| Line 39: | Line 39: | ||
[[File:T--Georgia State--BBa J364000 Georgia State 2017.png|600px|thumb|center|''Mean Fluorescence Intensity measured by flow cytometry of GFP expressed from 6-hour cultures of BBa_J364000 in multiple growth mediums.'' | [[File:T--Georgia State--BBa J364000 Georgia State 2017.png|600px|thumb|center|''Mean Fluorescence Intensity measured by flow cytometry of GFP expressed from 6-hour cultures of BBa_J364000 in multiple growth mediums.'' | ||
]] | ]] | ||
| + | |||
| + | === 2019 Lethbridge iGEM Team === | ||
| + | |||
| + | <B> LB and minimal growth study for BBa_J364000, BBa_J364001 and BBa_J364002.</B> | ||
| + | |||
| + | <p> In order to inform iGEM teams, we have compared these three parts in order to determine their growth and effectiveness in different conditions with the <i> E. coli </i> host. Each was test in LB and M9 minimal media to determine which part has the most resilience. Data was represented in colony forming units by using the microsphere calibration protocol from the 2018 measurement study. This will aid iGEM teams that will work in stress conditions for their projects. </p> | ||
| + | |||
| + | <p> Media Used: LB Media: 10g tryptone, 10g sodium chloride, 5g yeast extract, 1L volume; autoclaved and stored in fridge before use M9 Minimal media: 20mL of M9 salts, 2ml 20% glucose, 200uL 1M MgSO4, 10uL 1M CaCl2, 78mL H20. Filter sterilized and stored at room temperature. | ||
| + | |||
| + | Basic Protocol: 1. In order to convert OD600 absorbance values to colony forming units, a standard curve using microspheres from the measurement kit was used. For protocols, please refer to iGEM’s 2018 measurement study. | ||
| + | 2. Samples grown overnight in LB media + antibiotic were spun down and given fresh media. Samples were diluted in LB or minimal media to an OD600 of 0.1. using a multichannel pipette, they were loaded onto a 96 well plate in triplicate. Three biological replicates and three technical replicates were used. | ||
| + | 3. Samples, LB media control and minimal media control were run with a Spectramax i3X. Samples were read for 16 hours at run at a temperature of 37˚C. Pathlength correction was turned of and absorbance was read at 600nm. Samples were shaken in between reads. | ||
| + | 4. Data analysis was done to account for LB absorbance (from the control) then the technical and biological replicate values were averaged. Values were then converted into colony forming units. Standard deviation was also determined, and the graphs were created as seen below. </p><br> | ||
| + | |||
| + | https://2019.igem.org/wiki/images/8/80/T--Lethbridge--Characterization_Figure1.png | ||
| + | Figure 1: Standard curve of the microsphere calibration protocol. R2 value was determined to be a value of 0.9997. | ||
| + | |||
| + | https://2019.igem.org/wiki/images/f/f9/T--Lethbridge--Characterization_Figure2.png | ||
| + | Figure 2: E.coli DH5α populations with measurement plasmids in LB as compared to DH5α cells without plasmid over time at 37˚C. | ||
| + | https://2019.igem.org/wiki/images/1/1e/T--Lethbridge--Characterization_Figure3.png | ||
| + | Figure 3: E. coli DH5α populations with measurement plasmids in Minimal media as compared to DH5α cells without plasmid in LB media over time at 37˚C. | ||
| + | https://2019.igem.org/wiki/images/e/e2/T--Lethbridge--Characterization_Figure4Actual.png | ||
| + | Figure 4: Measurement of part BBa_J364001 in LB and minimal media as compared to DH5α cells without a plasmid grown in LB. | ||
| + | https://2019.igem.org/wiki/images/3/39/T--Lethbridge--Characterization_Figure5.png | ||
| + | Figure 5: Measurement of part BBa_J364002 in LB and minimal media as compared to DH5α cells without a plasmid grown in LB. | ||
| + | https://static.igem.org/mediawiki/parts/4/40/T--Lethbridge--Characterization_Figure_6.png | ||
| + | Figure 6: Measurement of part BBa_J364000 in LB and minimal media as compared to DH5α cells without a plasmid grown in LB. | ||
Latest revision as of 16:17, 17 November 2019
This experience page is provided so that any user may enter their experience using this part.
Please enter
how you used this part and how it worked out.
Applications of BBa_J364000
User Reviews
UNIQed205d693912ab96-partinfo-00000000-QINU UNIQed205d693912ab96-partinfo-00000001-QINU
SCU-China 2018:
Experiment conditions:
1. 37℃ incubator for E.coli DH5α;
2. LB liquid medium.
Analyze & Results:
We use this part BBa_J364000 as our original source of GFP proteins. As our expectation, this part can work normally under our experiment conditions.
For the modification, we added a spacer sequence and NGG site just on the upstream of the promoter for repression of GFP expression. And this modification is very successful because the repression is obvious according to the Figure 1 below.

As the picture shows, the part:BBa_J364000 and our part:BBa_K2611001 can both function well. And for the improvement: this part's expression can be regulated under the control of dCas9 system.
2017 Georgia State iGEM Team
Georgia State Growth Medium Study

2019 Lethbridge iGEM Team
LB and minimal growth study for BBa_J364000, BBa_J364001 and BBa_J364002.
In order to inform iGEM teams, we have compared these three parts in order to determine their growth and effectiveness in different conditions with the E. coli host. Each was test in LB and M9 minimal media to determine which part has the most resilience. Data was represented in colony forming units by using the microsphere calibration protocol from the 2018 measurement study. This will aid iGEM teams that will work in stress conditions for their projects.
Media Used: LB Media: 10g tryptone, 10g sodium chloride, 5g yeast extract, 1L volume; autoclaved and stored in fridge before use M9 Minimal media: 20mL of M9 salts, 2ml 20% glucose, 200uL 1M MgSO4, 10uL 1M CaCl2, 78mL H20. Filter sterilized and stored at room temperature. Basic Protocol: 1. In order to convert OD600 absorbance values to colony forming units, a standard curve using microspheres from the measurement kit was used. For protocols, please refer to iGEM’s 2018 measurement study. 2. Samples grown overnight in LB media + antibiotic were spun down and given fresh media. Samples were diluted in LB or minimal media to an OD600 of 0.1. using a multichannel pipette, they were loaded onto a 96 well plate in triplicate. Three biological replicates and three technical replicates were used. 3. Samples, LB media control and minimal media control were run with a Spectramax i3X. Samples were read for 16 hours at run at a temperature of 37˚C. Pathlength correction was turned of and absorbance was read at 600nm. Samples were shaken in between reads. 4. Data analysis was done to account for LB absorbance (from the control) then the technical and biological replicate values were averaged. Values were then converted into colony forming units. Standard deviation was also determined, and the graphs were created as seen below.
 Figure 1: Standard curve of the microsphere calibration protocol. R2 value was determined to be a value of 0.9997.
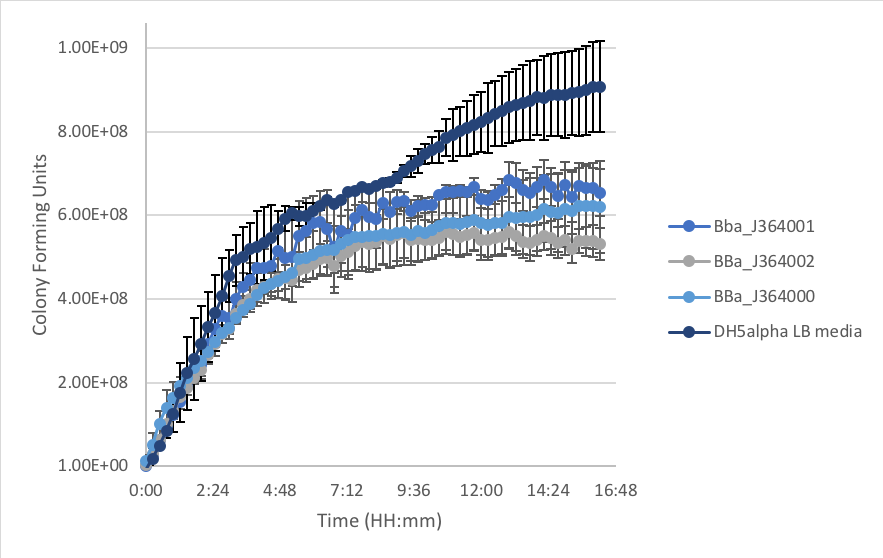 Figure 2: E.coli DH5α populations with measurement plasmids in LB as compared to DH5α cells without plasmid over time at 37˚C.
 Figure 3: E. coli DH5α populations with measurement plasmids in Minimal media as compared to DH5α cells without plasmid in LB media over time at 37˚C.
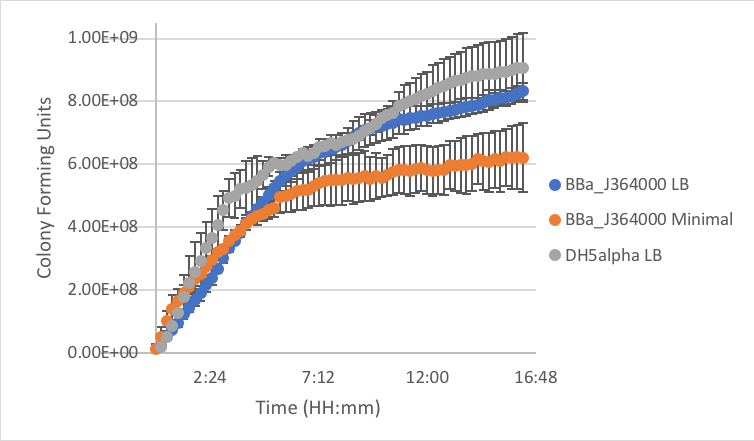 Figure 4: Measurement of part BBa_J364001 in LB and minimal media as compared to DH5α cells without a plasmid grown in LB.
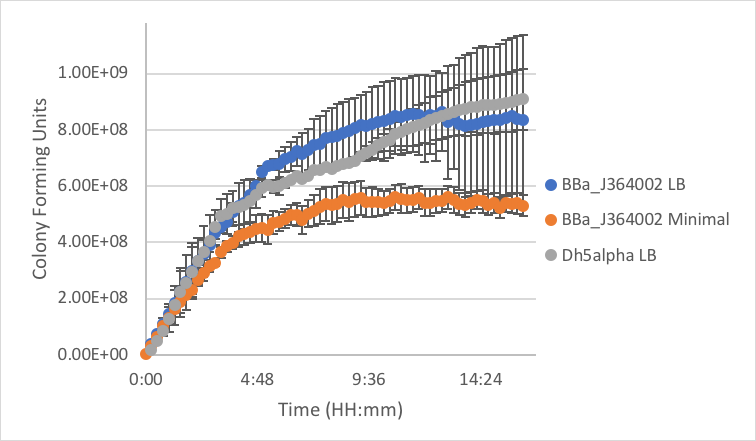 Figure 5: Measurement of part BBa_J364002 in LB and minimal media as compared to DH5α cells without a plasmid grown in LB.
 Figure 6: Measurement of part BBa_J364000 in LB and minimal media as compared to DH5α cells without a plasmid grown in LB.