Difference between revisions of "Part:BBa K2728001"
Bluepumpkin (Talk | contribs) |
(→Contribution) |
||
| (28 intermediate revisions by 3 users not shown) | |||
| Line 15: | Line 15: | ||
<br /> | <br /> | ||
=== Features === | === Features === | ||
| − | # It’s a formaldehyde-inducible promoter from E.coli. | + | #It’s a formaldehyde-inducible promoter from E.coli. |
#It’s an engineered promoter. It retains formaldehyde responsiveness, with 2-fold higher GFP expression in response to 100 μM formaldehyde than the native pfrm. Application of this promoter with higher basal and induced expression levels before methanol assimilation genes achieves higher biomass titers than the native E. coli pfrm. | #It’s an engineered promoter. It retains formaldehyde responsiveness, with 2-fold higher GFP expression in response to 100 μM formaldehyde than the native pfrm. Application of this promoter with higher basal and induced expression levels before methanol assimilation genes achieves higher biomass titers than the native E. coli pfrm. | ||
<br /> | <br /> | ||
| Line 23: | Line 23: | ||
<br /> | <br /> | ||
<br /> | <br /> | ||
| − | === | + | === Experimental Characterization === |
| − | + | Though we failed a lot of times that we cannot even count, due to a lot of different reasons and controls. Eventually we found the proper setting of our equipment, and got some promising data as below: | |
| + | <br /><br /> | ||
| + | ===== Experiment 1 ===== | ||
| + | Culture environment: saturated formaldehyde aqueous solution with concentration of 37 percent<br /> | ||
| + | Instruments: tecan infinite m1000<br /> | ||
| + | Experiment group: BL21 with pFrmR+EGFP<br /> | ||
| + | Control group: BL21 (with no plasmid transformed)<br /> | ||
<br /> | <br /> | ||
| − | The research conducted by Rohlhill J. | + | #Test the OD number of overnight-cultured strain; |
| + | #Diluted to 0.05, the strains are cultured under 37 celsius, 220prm. | ||
| + | #Take 5 tubes of 1ml system both from experiment group and control group and add 0ul, 1ul, 2.5ul, 5ul, and 7.5ul saturated formaldehyde solution into each tube. Mix evenly. | ||
| + | #ake 150ul from each of the tubes into 96 orifice plate. | ||
| + | #est fluorescence in tecan infinite m1000. | ||
| + | <br /> | ||
| + | Related conditions:<br /> | ||
| + | Excitation Wavelength 495 nm<br /> | ||
| + | Emission Wavelength 525 nm<br /> | ||
| + | List of actions in this measurement script:<br /> | ||
| + | Shaking (Orbital) Duration: 900 s<br /> | ||
| + | Shaking (Orbital) Amplitude: 2 mm<br /> | ||
| + | Shaking (Orbital) Frequency: 306 rpm<br /> | ||
| + | <br /> | ||
| + | Results:<br /> | ||
| + | [[File:T--BGIC-Global--pfmxrxp1.png|left|border|800px]]<br clear=all> | ||
| + | <br /> | ||
| + | [[File:T--BGIC-Global--pfmxrxp2.png|left|border|500px]]<br clear=all> | ||
| + | <br /> | ||
| + | In solution with 1ul of formaldehyde, luminescence was the most obvious, indicating more active pFrmR. | ||
| + | <br /> | ||
| + | <br /> | ||
| + | ===== Experiment 2 ===== | ||
| + | Culture environment: saturated formaldehyde aqueous solution with concentration of 37 percent<br /> | ||
| + | Instruments: tecan infinite m1000<br /> | ||
| + | Experiment group: BL21 with pFrmR+EGFP<br /> | ||
| + | Control group: BL21<br /> | ||
| + | <br /> | ||
| + | #Test the OD number of overnight-cultured strain; | ||
| + | #Diluted to 0.05, the strains are cultured under 37 celsius, 220prm. | ||
| + | For experiment group:<br /> | ||
| + | #Take 5 tubes of 1ml system both from experiment group and control group and add 0ul,0.2ul,0.5ul,1ul,and 1.5ul saturated formaldehyde solution into each tube. Mix evenly. | ||
| + | #Take 150ul from each of the tubes into 96 orifice plate. | ||
| + | #Test fluorescence in tecan infinite m1000. | ||
| + | <br /> | ||
| + | Related conditions:<br /> | ||
| + | Excitation Wavelength 495 nm<br /> | ||
| + | Emission Wavelength 525 nm<br /> | ||
| + | List of actions in this measurement script:<br /> | ||
| + | Shaking (Orbital) Duration: 900 s<br /> | ||
| + | Shaking (Orbital) Amplitude: 2 mm<br /> | ||
| + | Shaking (Orbital) Frequency: 306 rpm<br /> | ||
| + | [[File:Pfmxrxp3.png|left|border|800px]]<br clear=all> | ||
| + | <br /> | ||
| + | Results:<br /> | ||
| + | [[File:T--BGIC-Global--pfmxrxp4.png|left|border|500px]]<br clear=all> | ||
| + | Summarized graph for all groups of FrmR and BL21. In solution with 1ul of formaldehyde, luminescence was the most obvious, indicating more active pFrmR.<br /> | ||
| + | <br /> | ||
| + | [[File:T--BGIC-Global--pfmxrxp5.png|left|border|500px]]<br clear=all> | ||
| + | In solution with no formaldehyde dosed, BL21 with EGFP had similar expression of fluorescence with control group.<br /> | ||
| + | <br /> | ||
| + | [[File:T--BGIC-Global--pfmxrxp6.png|left|border|500px]]<br clear=all> | ||
| + | In solution with addition of 0.2ul of formaldehyde, BL21 with EGFP had similar expression of fluorescence with the control group, which means in this condition the activity of pFrmR was low.<br /> | ||
| + | <br /> | ||
| + | [[File:T--BGIC-Global--pfmxrxp7.png|left|border|500px]]<br clear=all> | ||
| + | In solution with addition of 0.5ul of formaldehyde, the difference in fluorescent degree between BL21 with EGFP and the control group was clear, indicating higher activity of pFrmR.<br /> | ||
| + | <br /> | ||
| + | [[File:T--BGIC-Global--pfmxrxp8.png|left|border|500px]]<br clear=all> | ||
| + | In solution with addition of 1ul of formaldehyde, the difference in fluorescent degree between BL21 with EGFP and the control group was the most obvious, indicating highest activity of pFrmR which successfully activated EGFP.<br /> | ||
| + | <br /> | ||
| + | [[File:T--BGIC-Global--pfmxrxp9.png|left|border|500px]]<br clear=all> | ||
| + | In solution with addition of 1.5ul formaldehyde solution, the difference in fluorescent degree between BL21 with EGFP and the control group was clear, indicating the certain level of activity of pFrmR.<br /> | ||
| + | <br /> | ||
| + | [[File:T--BGIC-Global--pfmxrxp10.png|left|border|500px]]<br clear=all> | ||
| + | In solution with addition of 1ul of formaldehyde solution, the activity of pFrmR was the highest.<br /> | ||
| + | <br /> | ||
| + | [[File:T--BGIC-Global--v2exd.png|left|border|500px]]<br clear=all> | ||
| + | In formaldehyde free condition, FrmR inhibiting factor regulates pFrmR through negative feedback, lowering the activity of the promotor. After adding the inductor, FrmR inhibiting factor combined with formaldehyde molecules, lowering the effect of the negative feedback, thus the activity of pFrmR will be higher.<br /> | ||
| + | <br /> | ||
| + | |||
| + | === Improvements === | ||
| + | The sequence of this part was taken from the research of Rohlhill J. et al. The 2 binding sites of variations are -35 and -10 (Fig 1). We ordered synthesized plasmid with pFrmR and EGFP from Gensceipt and constructed pFrmR-EGFP-FrmR reporter system on plasmid pUC57. After dosing formaldehyde of 100 to 400uM, we tested the EGFP expression to identify the activity of the formaldehyde induced response of this prompter. | ||
| + | <br /><br /> | ||
| + | The research conducted by Rohlhill J. et al. has proved that, pFrmR retains formaldehyde responsiveness, with 2-fold higher GFP expression in response to 100 μM formaldehyde than the native pfrm ([https://parts.igem.org/Part:BBa_K749008 BBa_K749008], submitted by TMU-Tokyo in 2012 and they did not observe any GFP expression that year.)[4].This is quite a new discovery and we have not found other published researches having applied this promoter, which means, we are the first team that brings it to iGEM! | ||
<br /> | <br /> | ||
| − | |||
<br /> | <br /> | ||
Future Improvements: | Future Improvements: | ||
We plan to optimize our reporter vector by introducing an independent promoter pLac to regulate the expression of FrmR. | We plan to optimize our reporter vector by introducing an independent promoter pLac to regulate the expression of FrmR. | ||
<br /> | <br /> | ||
| − | [[File:T--BGIC-Global--pfrmr1.png|left|border| | + | <br /> |
| + | [[File:T--BGIC-Global--pfrmr1.png|left|border|500px]]<br clear=all> | ||
===== Fig 1: Sites of mutants ===== | ===== Fig 1: Sites of mutants ===== | ||
<br /> | <br /> | ||
| − | [[File:T--BGIC-Global--pfrmr2.png|left|border| | + | [[File:T--BGIC-Global--pfrmr2.png|left|border|500px]]<br clear=all> |
===== Fig 2: Comparison of activity ===== | ===== Fig 2: Comparison of activity ===== | ||
<br /> | <br /> | ||
| − | [[File:T--BGIC-Global--pfrmr3.png|left|border| | + | [[File:T--BGIC-Global--pfrmr3.png|left|border|300px]]<br clear=all> |
===== Fig 3: Current reporter system ===== | ===== Fig 3: Current reporter system ===== | ||
| − | |||
| − | |||
<br /> | <br /> | ||
| − | [[File:T--BGIC-Global--pfrmr5.png|left|border| | + | [[File:T--BGIC-Global--pfrmr5.png|left|border|300px]]<br clear=all> |
===== Fig 5: Future reporter system ===== | ===== Fig 5: Future reporter system ===== | ||
| + | <br /> | ||
| + | <br /> | ||
| + | |||
| + | === Potential Application === | ||
| + | *To construct a formaldehyde sensor with this promoter. | ||
| + | *To enable higher growth under formaldehyde pressure with the application of the engineered formaldehyde responsive promoter. | ||
<br /> | <br /> | ||
<br /> | <br /> | ||
| Line 65: | Line 148: | ||
===== Fig 5: Gel Verification ===== | ===== Fig 5: Gel Verification ===== | ||
<br /> | <br /> | ||
| + | <br /> | ||
| + | === References === | ||
| + | #Osman, D., Piergentili, C., Chen, J., Sayer, L. N., Uson, I., Huggins, T. G., Robinson, N. J., and Pohl, E. (2016) The Effectors and Sensory Sites of Formaldehyde-Responsive Regulator FrmR and Metal-Sensing Variant. J. Biol. Chem. 291, 19502-19516 | ||
| + | #Denby, K. J., Iwig, J., Bisson, C., Westwood, J., Rolfe, M. D., Sedelnikova, S. E., Higgins, K., Maroney, M. J., Baker, P. J., Chivers, P. T., and Green, J. (2016) The mechanism of a formaldehyde-sensing transcriptional regulator. Sci. Rep. 6, 38879 | ||
| + | #Gonzalez, C. F., Proudfoot, M., Brown, G., Korniyenko, Y., Mori, H., Savchenko, A. V., and Yakunin, A. F. (2006) Molecular basis of formaldehyde detoxification: Characterization of two S-formylglutathione hydrolases from Escherichia coli, FrmB and YeiG. J. Biol. Chem. 281, 14514-14522 | ||
| + | #Rohlhill J, Sandoval N R, Papoutsakis E T. Sort-seq approach to engineering a formaldehyde-inducible promoter for dynamically regulated Escherichia coli growth on methanol.[J]. Acs Synthetic Biology, 2017, 6(8) | ||
| + | <br /> | ||
| + | ==Contribution== | ||
| + | *'''Group:''' [http://2019.igem.org/Team:ZJUT-China iGEM Team ZJUT-China 2019] | ||
| + | *'''Author:''' Jiaqi Weng, Jialu Shao | ||
| + | *'''Summary:''' Quantify experimental characterization data by counting the A650 of the reaction solution of bacterial culture and TMB. | ||
| + | |||
| + | ===Characterize from ZJUT-iGEM=== | ||
| + | We added further measurement data to part BBa K2728001. In 2018, BGIC-GOBAL team registered pFrmR, a engineered promoter which was induced by formaldehyde. From they Experimental Characterization, they found it was hard to count the promoter due to the leakage. In this year, we use the catalytic ability of catalase to add quantitative experimental characterization data by counting the A650 of the reaction solution of the bacterial culture and 3, 3’ ,5, 5’ -Tetramethylbenzidine (TMB) | ||
| + | |||
| + | ===The qualitative experiment === | ||
| + | (1) Culture E. coli harboring pFrmR - Cat gene in LB medium with different concentrations of formaldehyde (0 mg/ml, 10 mg/ml, 20 mg/ml, 40 mg/ml, 80 mg/ml, 100 mg/ml, 120 mg/ml) for 12 h . | ||
| + | <br> | ||
| + | (2) Measure the absorbance of the bacteria liquid at the wavelength of 600 nm and dilute the bacteria solution until the OD600 reached 0.5. | ||
| + | <br> | ||
| + | (3) Take 40 μl diluted bacteria liquid out in 96 - well plates . | ||
| + | <br> | ||
| + | (4) Add 160 μl TMB reagent in the bacterial liquid containing 96-well plate and incubate it at 37℃ for half an hour. | ||
| + | <br> | ||
| + | (5) Measure the absorbance of the reaction solution 96-well plate at the wavelength of 650 nm using ultraviolet spectrophotometer. | ||
| + | |||
| + | ===Related conditions=== | ||
| + | https://static.igem.org/mediawiki/parts/6/64/T--ZJUT-China--igem-71.png | ||
| + | |||
| + | ===Data=== | ||
| + | The measured absorbance is shown below: | ||
| + | <br> | ||
| + | <html> | ||
| + | <center><img src="https://static.igem.org/mediawiki/parts/6/67/T--ZJUT-China--igem-72.png"> | ||
| + | <br> | ||
| + | Figure 1.1 The original data of the A650 of the reaction solution | ||
| + | <br><br> | ||
| + | Form 1.1 The A650 of the reaction solution | ||
| + | <br> | ||
| + | <img src="https://static.igem.org/mediawiki/parts/0/0b/T--ZJUT-China--igem-z26.png" width="800px"> | ||
| + | <br> | ||
| + | <img src="https://static.igem.org/mediawiki/parts/3/3a/T--ZJUT-China--igem-z1.png"> | ||
| + | <br> | ||
| + | Figure 1.2 Activation of pFrmR in different fromaldehyde concentrations | ||
| + | </center> | ||
| + | </html> | ||
| + | ===Analysis=== | ||
| + | When the E. coli were cultured with or without formaldehyde, they could react with TMB and the solution turned blue, which indicated that both of them produced catalase, and the absorbance at 650 nm was similar. The results indicated that FrmR promoter leakaged. There is no difference between the two situation because of the long culture time and the excessive amount of expressed enzymes, shortening the culture time can reduce the expression of enzymes, and whether the start-up of pFrmR can be seen. | ||
| + | ===The quantitative experiment=== | ||
| + | Considering to make the induction phenomenon more obvious by shortening the test culture time, we decided to take the bacterial liquid at specific times during the growth process and react with TMB. To avoid the effect on cell growth caused by sampling. We performed 32 culture batches and each group of measurements was repeated three times in parallel. We took E. coli containing pet-28b-cat plasmid as the control group, and E. coil with pet-28b-pfrmr-cat as the experimental group. | ||
| + | <br> | ||
| + | (1) Pick one colony of the strains into 5 ml LB medium and cultivate it overnight. | ||
| + | <br> | ||
| + | (2) Take 10 μl seed culture in 3 ml LB medim with 0 mg/ml, 80 mg/ml, and 120 mg/ml of formaldehyde. | ||
| + | <br> | ||
| + | (3) Take 200 μl cell culture at 3, 4.5, 5, 6, 7, 7.5, 8 and 8.5 hours respectively and stored at 4℃. | ||
| + | <br> | ||
| + | (4) Measure the absorbance of the bacteria liquid at the wavelength of 600 nm and dilute the bacteria solution until the OD600 reached 0.5. | ||
| + | <br> | ||
| + | (5) Take 40 μl diluted bacteria liquid out in 96 - well plates . | ||
| + | <br> | ||
| + | (6) Add 160 μl TMB reagent in the bacterial liquid containing 96-well plate and incubate it at 37℃ for half an hour. | ||
| + | <br> | ||
| + | (7) Measure the absorbance of the reaction solution 96-well plate at the wavelength of 650 nm using ultraviolet spectrophotometer. | ||
| + | ===Related conditions=== | ||
| + | <html> | ||
| + | <center><img src="https://static.igem.org/mediawiki/parts/2/21/T--ZJUT-China--igem-z233.png"></center> | ||
| + | </html> | ||
| + | ===Data=== | ||
| + | The measured absorbance is shown below: | ||
| + | <html> | ||
| + | <center><img src="https://static.igem.org/mediawiki/parts/a/aa/T--ZJUT-China--igem-z21.png"> | ||
| + | <img src="https://static.igem.org/mediawiki/parts/0/0e/T--ZJUT-China--igem-z22.png"> | ||
| + | <br> | ||
| + | Figure 1.3 The original data of the A650 of the reaction solution | ||
| + | <br> | ||
| + | Form 1.2 The Aorbance of the reaction solution at the wavelength of 650 nm | ||
| + | <br> | ||
| + | <img src="https://static.igem.org/mediawiki/parts/c/cc/T--ZJUT-China--igem-z25.png" width="800px"> | ||
| + | <br> | ||
| + | <img src="https://static.igem.org/mediawiki/parts/1/1d/T--ZJUT-China--igem-z27.png" width="800px"> | ||
| + | |||
| + | </center> | ||
| + | </html> | ||
| + | ===Analysis=== | ||
| + | It can be seen from figure 1.3 that after cultivation for 4.5 h and 5 h in LB medium containing 80 mg/ml and 120 mg/ml formaldehyde, reaction of the bacterial liquid with TMB, the value of A650 are very similar to the value of positive control group. | ||
| + | This could indicate that although pFrmR exists promoter leakage phenomenon at the early stage of culture, the FrmR promoter was abled to induce by formaldehyde between 4h and 5h. Besides, the reason why the difference between the experimental groups was not obvious after 6h was that catalase might had been overexpressed and the detection agent TMB was extremely sensitive to Cat. | ||
| + | |||
| + | <br /> | ||
| + | |||
| + | |||
| + | ==Contribution== | ||
| + | *'''Group:''' iGEM23_HongKong-JSS | ||
| + | |||
| + | ===Formaldehyde sensing reporter device construct by Team iGEM23_HongKong-JSS=== | ||
| + | Our project focuses on engineering ''E. coli'' bacteria to act as detectors of formaldehyde. These modified bacteria have the ability to change color when exposed to formaldehyde, providing a visible indication of its presence. This allows people to notice the presence of formaldehyde without requiring any special equipment. | ||
| + | |||
| + | By using this promoter, we developed our reporter device <partinfo>BBa_K4813002</partinfo>. Our experimental findings provide additional validation for the promoter's ability to regulate the expression of a chromoprotein. However, it is important to note that our results also highlighted the issue of leaky expression associated with this promoter. | ||
| + | |||
| + | |||
| + | <b>Functional assay with formaldehyde</b> | ||
| + | |||
| + | The ''E. coli'' strain expressing the construct was then cultured in 10 mL of LB broth with ampicillin for a duration of 12 hours. During this period, formaldehyde was added in concentrations of 500 uM and 1000 uM. Following the incubation, the culture was harvested and subjected to centrifugation, resulting in the formation of a pellet for easier observation of any color changes. | ||
| + | |||
| + | |||
| + | <html><center> | ||
| + | <img src="https://static.igem.wiki/teams/4813/wiki/experiments/result-of-formaldehyde-k4813002.jpg" alt="Results of formaldehyde functional test with K4813002" width="300"> | ||
| + | <figcaption><u>Fig. 1 The left pellet contains <i>E. coli</i> expressing BBa_K4813002 construct without any formaldehyde treatment, maintaining a white color. Conversely, the right pellet shows <i>E. coli</i> expressing the same construct but treated with 500 uM formaldehyde, resulting in a pink coloration. </u> </figcaption> | ||
| + | </center> | ||
| + | </html> | ||
| + | |||
| + | |||
| + | Figure 1 shows the results obtained from the control sample with no formaldehyde (Left) and the sample with 500 uM formaldehyde (Right). In the 500 uM formaldehyde setup, a noticeable pink coloration is observed in the pellet, whereas the control sample without formaldehyde retains its white colour. This result confirms that our construct can show a color change in our engineered ''E. coli'' strain in the presence of formaldehyde. | ||
| + | |||
| + | Furthermore, we observed that the culture with the 1000 uM formaldehyde setup showed no turbidity. This suggests that the concentration of 1000 uM may have inhibited the growth of the ''E. coli'' strain. | ||
| + | |||
| + | |||
| + | In future work, we aim to study how the color intensity of our constructs varies with different concentrations of formaldehyde. We also plan to enhance the sensitivity of our device to detect even lower levels of formaldehyde. | ||
| + | |||
| + | |||
<!-- Add more about the biology of this part here | <!-- Add more about the biology of this part here | ||
Latest revision as of 09:17, 9 October 2023
pfrmR - An Engineered Formaldehyde-Inducible Promoter
Basic Description
This promoter is an engineered formaldehyde-inducible promoter. Escherichia coli has a native formaldehyde-inducible promoter, pfrm, which is found upstream of the frmRAB formaldehyde detoxification operon. FrmR, the first product of the operon, is a member of the DUF156 family of DNA-binding transcriptional regulators. It binds the frmRAB promoter region and is negatively allosterically modulated by formaldehyde. FrmR is specific to formaldehyde, responding to acetaldehyde, methylglyoxal, and glyoxal to far lesser degrees and not at all to a range of other aldehydes and alcohols tested. The genes frmA and frmB encode a formaldehyde dehydrogenase and S-formylglutathione hydrolase, respectively, and are responsible for detoxifying formaldehyde to formic acid in a glutathione-dependent pathway. The negative-feedback regulation of the frmRAB operon is similar to that of many other prokaryotic operons, whereby the transcription factor represses its own transcription.
Fig 1: Without Formaldehyde
Fig 2: With Formaldehyde
Features
- It’s a formaldehyde-inducible promoter from E.coli.
- It’s an engineered promoter. It retains formaldehyde responsiveness, with 2-fold higher GFP expression in response to 100 μM formaldehyde than the native pfrm. Application of this promoter with higher basal and induced expression levels before methanol assimilation genes achieves higher biomass titers than the native E. coli pfrm.
Origins
Escherichia coli
Experimental Characterization
Though we failed a lot of times that we cannot even count, due to a lot of different reasons and controls. Eventually we found the proper setting of our equipment, and got some promising data as below:
Experiment 1
Culture environment: saturated formaldehyde aqueous solution with concentration of 37 percent
Instruments: tecan infinite m1000
Experiment group: BL21 with pFrmR+EGFP
Control group: BL21 (with no plasmid transformed)
- Test the OD number of overnight-cultured strain;
- Diluted to 0.05, the strains are cultured under 37 celsius, 220prm.
- Take 5 tubes of 1ml system both from experiment group and control group and add 0ul, 1ul, 2.5ul, 5ul, and 7.5ul saturated formaldehyde solution into each tube. Mix evenly.
- ake 150ul from each of the tubes into 96 orifice plate.
- est fluorescence in tecan infinite m1000.
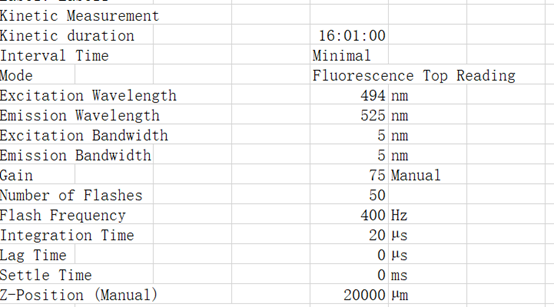
Related conditions:
Excitation Wavelength 495 nm
Emission Wavelength 525 nm
List of actions in this measurement script:
Shaking (Orbital) Duration: 900 s
Shaking (Orbital) Amplitude: 2 mm
Shaking (Orbital) Frequency: 306 rpm
Results:
In solution with 1ul of formaldehyde, luminescence was the most obvious, indicating more active pFrmR.
Experiment 2
Culture environment: saturated formaldehyde aqueous solution with concentration of 37 percent
Instruments: tecan infinite m1000
Experiment group: BL21 with pFrmR+EGFP
Control group: BL21
- Test the OD number of overnight-cultured strain;
- Diluted to 0.05, the strains are cultured under 37 celsius, 220prm.
For experiment group:
- Take 5 tubes of 1ml system both from experiment group and control group and add 0ul,0.2ul,0.5ul,1ul,and 1.5ul saturated formaldehyde solution into each tube. Mix evenly.
- Take 150ul from each of the tubes into 96 orifice plate.
- Test fluorescence in tecan infinite m1000.
Related conditions:
Excitation Wavelength 495 nm
Emission Wavelength 525 nm
List of actions in this measurement script:
Shaking (Orbital) Duration: 900 s
Shaking (Orbital) Amplitude: 2 mm
Shaking (Orbital) Frequency: 306 rpm
Results:
Summarized graph for all groups of FrmR and BL21. In solution with 1ul of formaldehyde, luminescence was the most obvious, indicating more active pFrmR.
In solution with no formaldehyde dosed, BL21 with EGFP had similar expression of fluorescence with control group.
In solution with addition of 0.2ul of formaldehyde, BL21 with EGFP had similar expression of fluorescence with the control group, which means in this condition the activity of pFrmR was low.
In solution with addition of 0.5ul of formaldehyde, the difference in fluorescent degree between BL21 with EGFP and the control group was clear, indicating higher activity of pFrmR.
In solution with addition of 1ul of formaldehyde, the difference in fluorescent degree between BL21 with EGFP and the control group was the most obvious, indicating highest activity of pFrmR which successfully activated EGFP.
In solution with addition of 1.5ul formaldehyde solution, the difference in fluorescent degree between BL21 with EGFP and the control group was clear, indicating the certain level of activity of pFrmR.
In solution with addition of 1ul of formaldehyde solution, the activity of pFrmR was the highest.
In formaldehyde free condition, FrmR inhibiting factor regulates pFrmR through negative feedback, lowering the activity of the promotor. After adding the inductor, FrmR inhibiting factor combined with formaldehyde molecules, lowering the effect of the negative feedback, thus the activity of pFrmR will be higher.
Improvements
The sequence of this part was taken from the research of Rohlhill J. et al. The 2 binding sites of variations are -35 and -10 (Fig 1). We ordered synthesized plasmid with pFrmR and EGFP from Gensceipt and constructed pFrmR-EGFP-FrmR reporter system on plasmid pUC57. After dosing formaldehyde of 100 to 400uM, we tested the EGFP expression to identify the activity of the formaldehyde induced response of this prompter.
The research conducted by Rohlhill J. et al. has proved that, pFrmR retains formaldehyde responsiveness, with 2-fold higher GFP expression in response to 100 μM formaldehyde than the native pfrm (BBa_K749008, submitted by TMU-Tokyo in 2012 and they did not observe any GFP expression that year.)[4].This is quite a new discovery and we have not found other published researches having applied this promoter, which means, we are the first team that brings it to iGEM!
Future Improvements:
We plan to optimize our reporter vector by introducing an independent promoter pLac to regulate the expression of FrmR.
Fig 1: Sites of mutants
Fig 2: Comparison of activity
Fig 3: Current reporter system
Fig 5: Future reporter system
Potential Application
- To construct a formaldehyde sensor with this promoter.
- To enable higher growth under formaldehyde pressure with the application of the engineered formaldehyde responsive promoter.
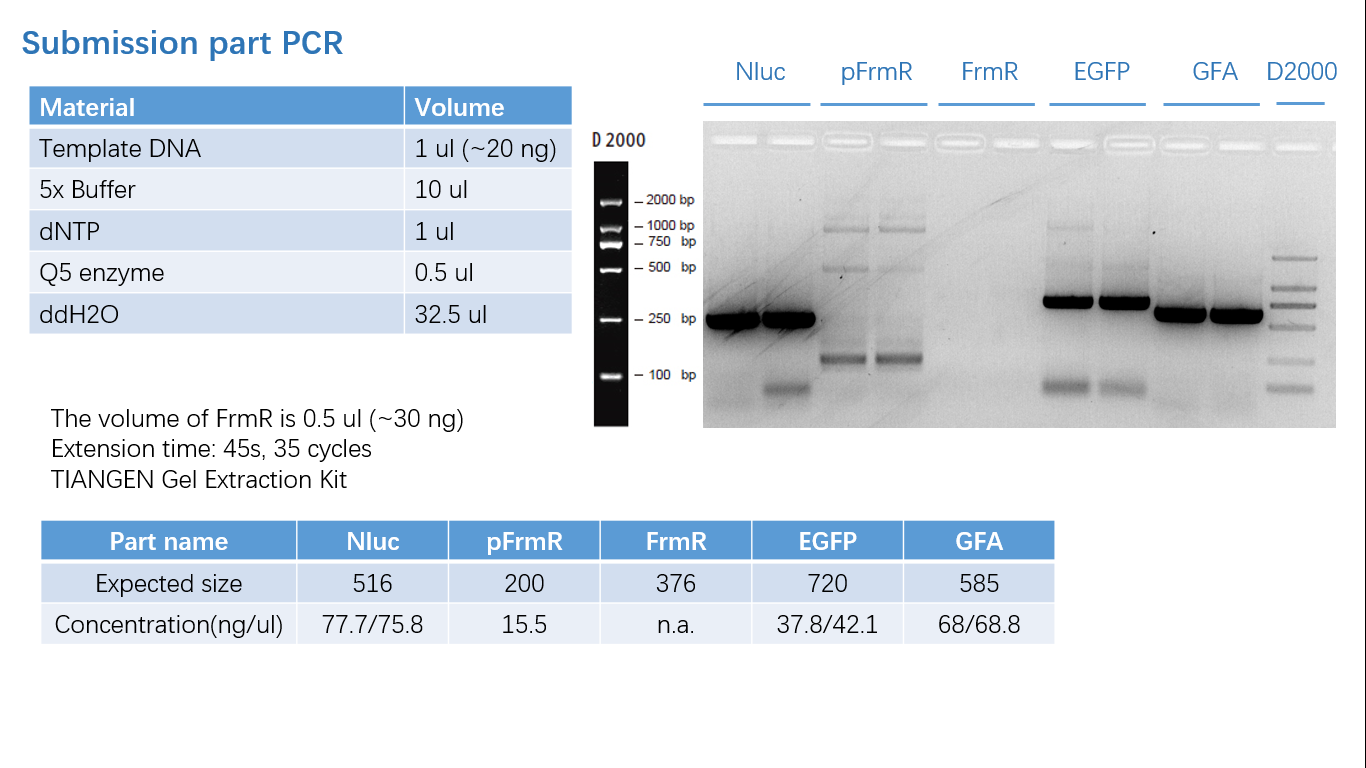
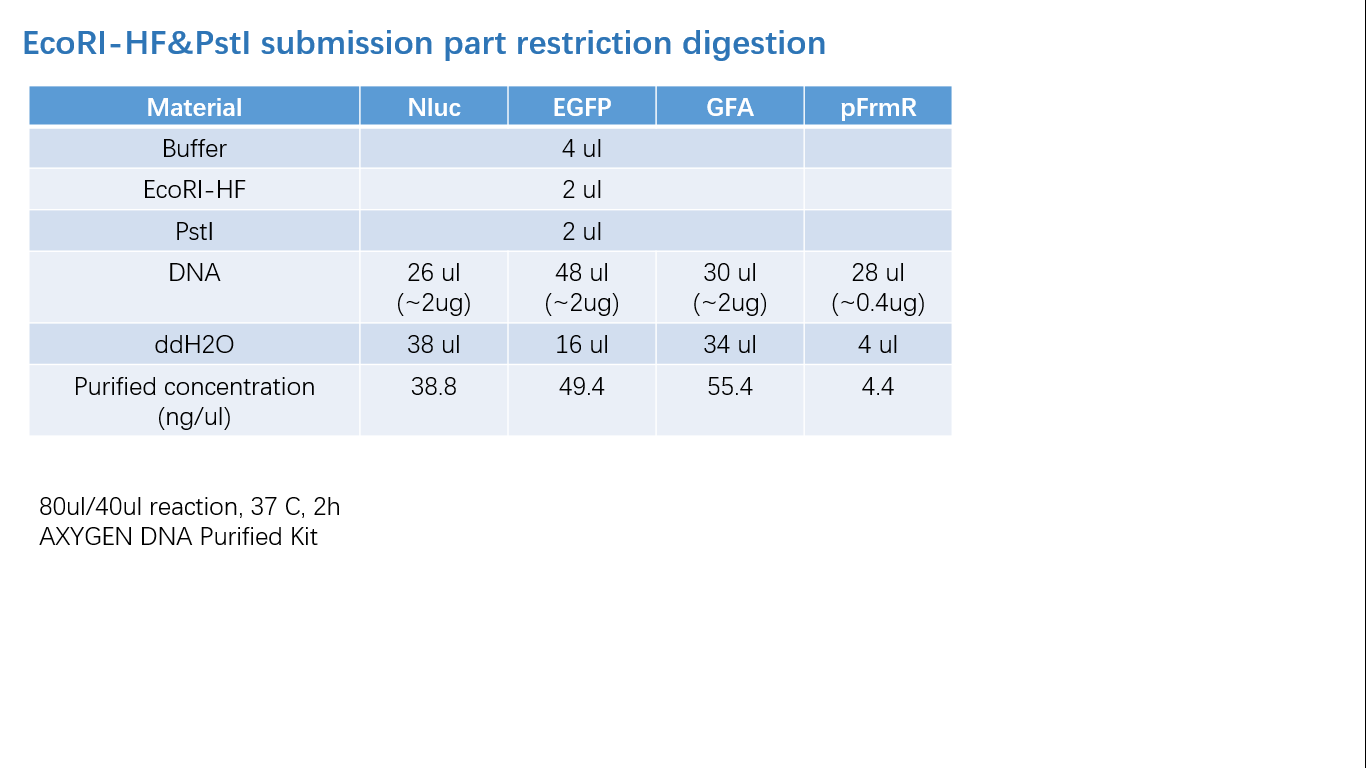
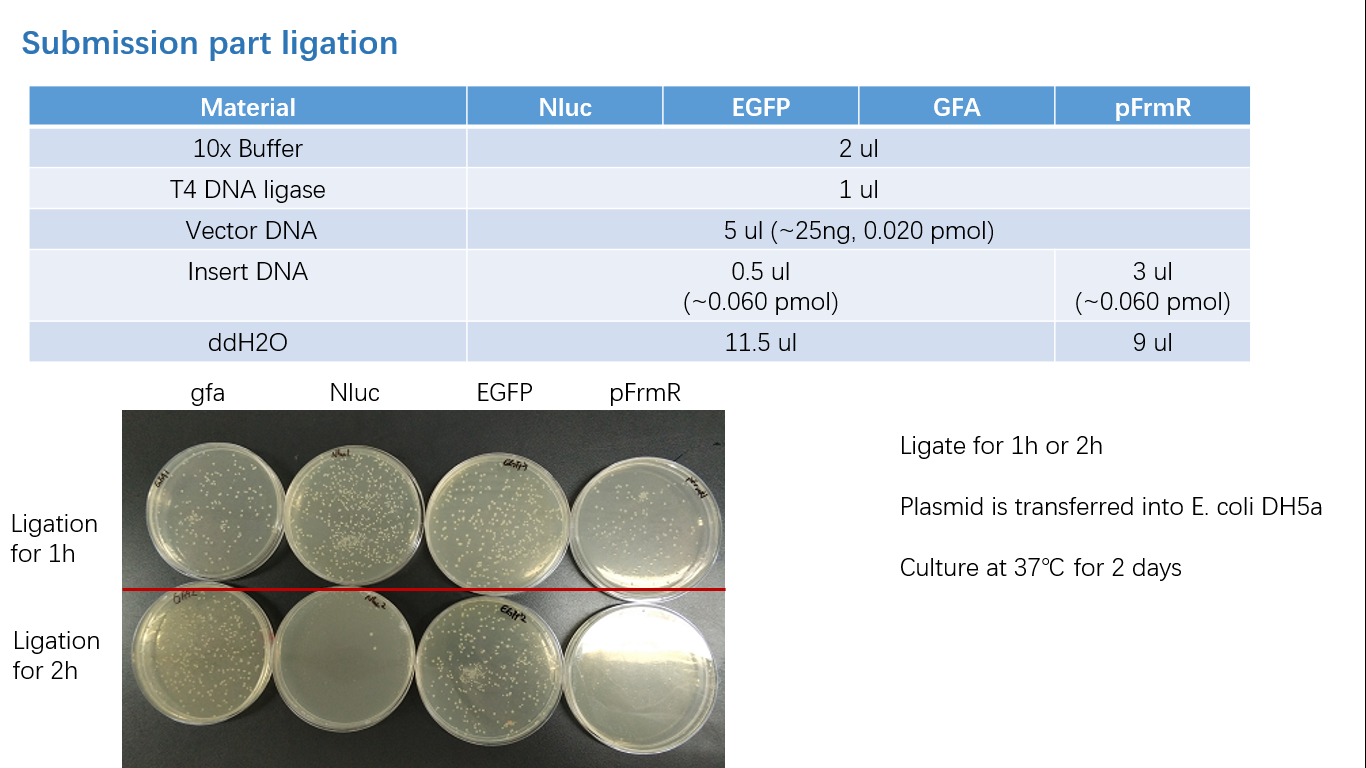
Parts Verification Before Submission
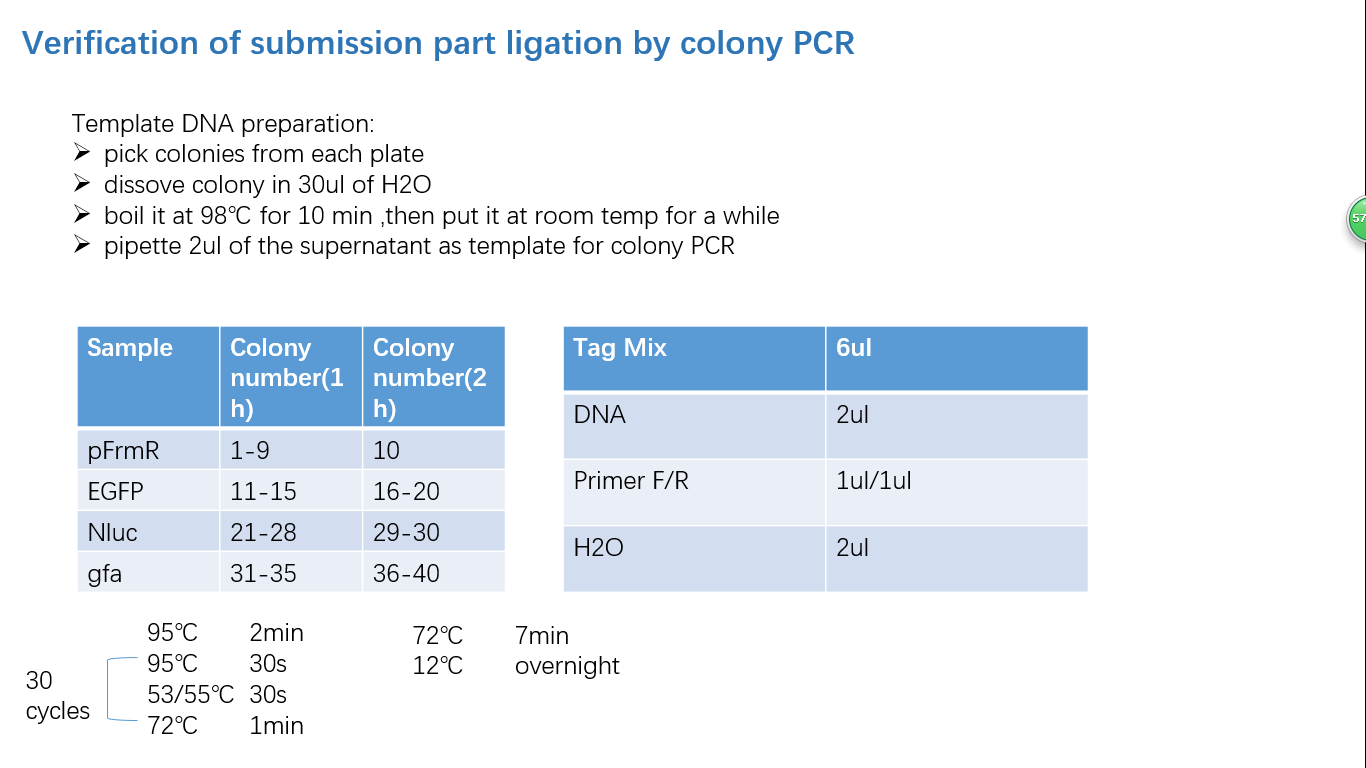
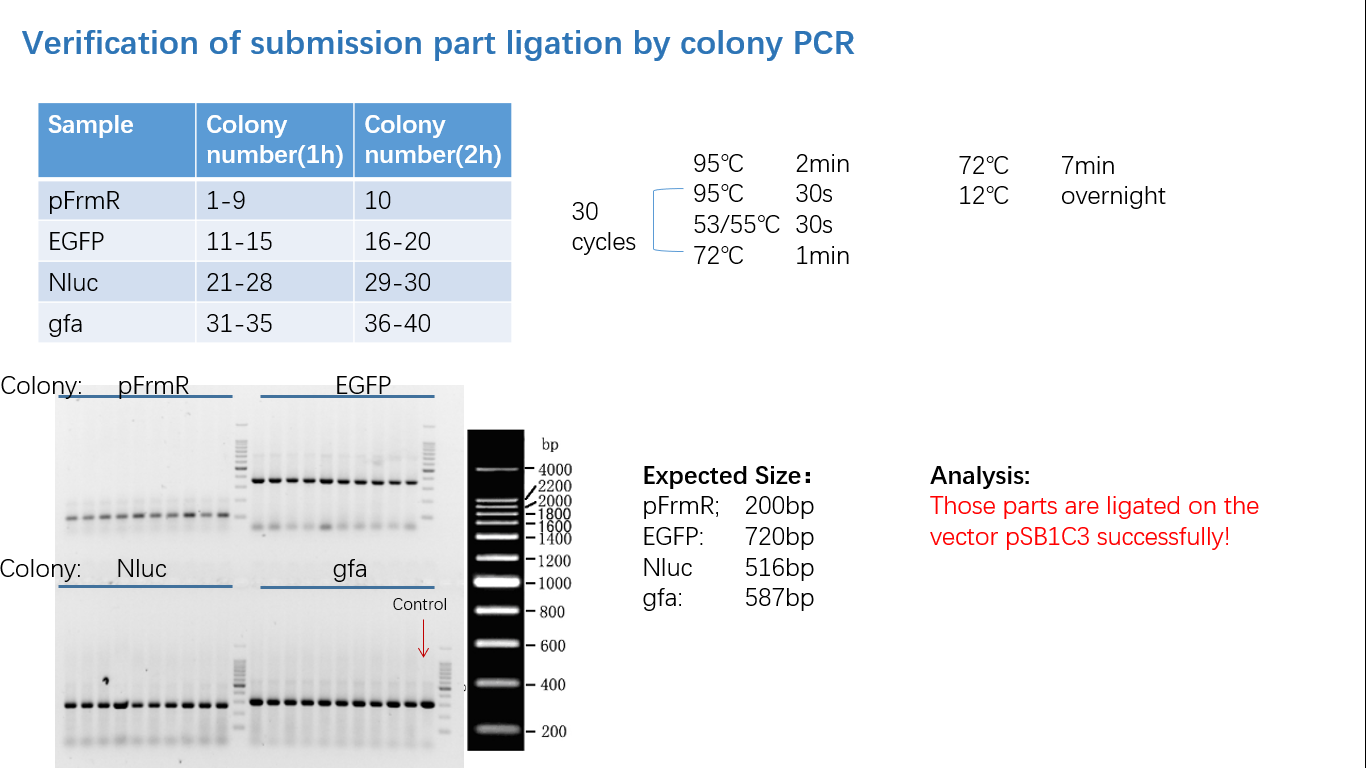
We verified our parts in the lab before submission. They are reliable! Please feel free to apply them onto your project.=)
Fig 1: PCR (to get targeted genes)
Fig 2: Restriction Digestion
Fig 3: Ligation
Fig 4: Colony PCR
Fig 5: Gel Verification
References
- Osman, D., Piergentili, C., Chen, J., Sayer, L. N., Uson, I., Huggins, T. G., Robinson, N. J., and Pohl, E. (2016) The Effectors and Sensory Sites of Formaldehyde-Responsive Regulator FrmR and Metal-Sensing Variant. J. Biol. Chem. 291, 19502-19516
- Denby, K. J., Iwig, J., Bisson, C., Westwood, J., Rolfe, M. D., Sedelnikova, S. E., Higgins, K., Maroney, M. J., Baker, P. J., Chivers, P. T., and Green, J. (2016) The mechanism of a formaldehyde-sensing transcriptional regulator. Sci. Rep. 6, 38879
- Gonzalez, C. F., Proudfoot, M., Brown, G., Korniyenko, Y., Mori, H., Savchenko, A. V., and Yakunin, A. F. (2006) Molecular basis of formaldehyde detoxification: Characterization of two S-formylglutathione hydrolases from Escherichia coli, FrmB and YeiG. J. Biol. Chem. 281, 14514-14522
- Rohlhill J, Sandoval N R, Papoutsakis E T. Sort-seq approach to engineering a formaldehyde-inducible promoter for dynamically regulated Escherichia coli growth on methanol.[J]. Acs Synthetic Biology, 2017, 6(8)
Contribution
- Group: [http://2019.igem.org/Team:ZJUT-China iGEM Team ZJUT-China 2019]
- Author: Jiaqi Weng, Jialu Shao
- Summary: Quantify experimental characterization data by counting the A650 of the reaction solution of bacterial culture and TMB.
Characterize from ZJUT-iGEM
We added further measurement data to part BBa K2728001. In 2018, BGIC-GOBAL team registered pFrmR, a engineered promoter which was induced by formaldehyde. From they Experimental Characterization, they found it was hard to count the promoter due to the leakage. In this year, we use the catalytic ability of catalase to add quantitative experimental characterization data by counting the A650 of the reaction solution of the bacterial culture and 3, 3’ ,5, 5’ -Tetramethylbenzidine (TMB)
The qualitative experiment
(1) Culture E. coli harboring pFrmR - Cat gene in LB medium with different concentrations of formaldehyde (0 mg/ml, 10 mg/ml, 20 mg/ml, 40 mg/ml, 80 mg/ml, 100 mg/ml, 120 mg/ml) for 12 h .
(2) Measure the absorbance of the bacteria liquid at the wavelength of 600 nm and dilute the bacteria solution until the OD600 reached 0.5.
(3) Take 40 μl diluted bacteria liquid out in 96 - well plates .
(4) Add 160 μl TMB reagent in the bacterial liquid containing 96-well plate and incubate it at 37℃ for half an hour.
(5) Measure the absorbance of the reaction solution 96-well plate at the wavelength of 650 nm using ultraviolet spectrophotometer.
Related conditions

Data
The measured absorbance is shown below:

Figure 1.1 The original data of the A650 of the reaction solution
Form 1.1 The A650 of the reaction solution


Figure 1.2 Activation of pFrmR in different fromaldehyde concentrations
Analysis
When the E. coli were cultured with or without formaldehyde, they could react with TMB and the solution turned blue, which indicated that both of them produced catalase, and the absorbance at 650 nm was similar. The results indicated that FrmR promoter leakaged. There is no difference between the two situation because of the long culture time and the excessive amount of expressed enzymes, shortening the culture time can reduce the expression of enzymes, and whether the start-up of pFrmR can be seen.
The quantitative experiment
Considering to make the induction phenomenon more obvious by shortening the test culture time, we decided to take the bacterial liquid at specific times during the growth process and react with TMB. To avoid the effect on cell growth caused by sampling. We performed 32 culture batches and each group of measurements was repeated three times in parallel. We took E. coli containing pet-28b-cat plasmid as the control group, and E. coil with pet-28b-pfrmr-cat as the experimental group.
(1) Pick one colony of the strains into 5 ml LB medium and cultivate it overnight.
(2) Take 10 μl seed culture in 3 ml LB medim with 0 mg/ml, 80 mg/ml, and 120 mg/ml of formaldehyde.
(3) Take 200 μl cell culture at 3, 4.5, 5, 6, 7, 7.5, 8 and 8.5 hours respectively and stored at 4℃.
(4) Measure the absorbance of the bacteria liquid at the wavelength of 600 nm and dilute the bacteria solution until the OD600 reached 0.5.
(5) Take 40 μl diluted bacteria liquid out in 96 - well plates .
(6) Add 160 μl TMB reagent in the bacterial liquid containing 96-well plate and incubate it at 37℃ for half an hour.
(7) Measure the absorbance of the reaction solution 96-well plate at the wavelength of 650 nm using ultraviolet spectrophotometer.
Related conditions

Data
The measured absorbance is shown below:


Figure 1.3 The original data of the A650 of the reaction solution
Form 1.2 The Aorbance of the reaction solution at the wavelength of 650 nm


Analysis
It can be seen from figure 1.3 that after cultivation for 4.5 h and 5 h in LB medium containing 80 mg/ml and 120 mg/ml formaldehyde, reaction of the bacterial liquid with TMB, the value of A650 are very similar to the value of positive control group. This could indicate that although pFrmR exists promoter leakage phenomenon at the early stage of culture, the FrmR promoter was abled to induce by formaldehyde between 4h and 5h. Besides, the reason why the difference between the experimental groups was not obvious after 6h was that catalase might had been overexpressed and the detection agent TMB was extremely sensitive to Cat.
Contribution
- Group: iGEM23_HongKong-JSS
Formaldehyde sensing reporter device construct by Team iGEM23_HongKong-JSS
Our project focuses on engineering E. coli bacteria to act as detectors of formaldehyde. These modified bacteria have the ability to change color when exposed to formaldehyde, providing a visible indication of its presence. This allows people to notice the presence of formaldehyde without requiring any special equipment.
By using this promoter, we developed our reporter device BBa_K4813002. Our experimental findings provide additional validation for the promoter's ability to regulate the expression of a chromoprotein. However, it is important to note that our results also highlighted the issue of leaky expression associated with this promoter.
Functional assay with formaldehyde
The E. coli strain expressing the construct was then cultured in 10 mL of LB broth with ampicillin for a duration of 12 hours. During this period, formaldehyde was added in concentrations of 500 uM and 1000 uM. Following the incubation, the culture was harvested and subjected to centrifugation, resulting in the formation of a pellet for easier observation of any color changes.

Figure 1 shows the results obtained from the control sample with no formaldehyde (Left) and the sample with 500 uM formaldehyde (Right). In the 500 uM formaldehyde setup, a noticeable pink coloration is observed in the pellet, whereas the control sample without formaldehyde retains its white colour. This result confirms that our construct can show a color change in our engineered E. coli strain in the presence of formaldehyde.
Furthermore, we observed that the culture with the 1000 uM formaldehyde setup showed no turbidity. This suggests that the concentration of 1000 uM may have inhibited the growth of the E. coli strain.
In future work, we aim to study how the color intensity of our constructs varies with different concentrations of formaldehyde. We also plan to enhance the sensitivity of our device to detect even lower levels of formaldehyde.
Sequence and Features
- 10COMPATIBLE WITH RFC[10]
- 12COMPATIBLE WITH RFC[12]
- 21COMPATIBLE WITH RFC[21]
- 23COMPATIBLE WITH RFC[23]
- 25COMPATIBLE WITH RFC[25]
- 1000COMPATIBLE WITH RFC[1000]


