Difference between revisions of "Part:BBa K1092003:Experience"
Oskarwestlin (Talk | contribs) |
Oskarwestlin (Talk | contribs) |
||
| Line 22: | Line 22: | ||
[[File:di_f2.jpg]] | [[File:di_f2.jpg]] | ||
| + | |||
| + | |||
| + | |||
===Usage and Biology=== | ===Usage and Biology=== | ||
Latest revision as of 18:07, 18 September 2015
This experience page is provided so that any user may enter their experience using this part.
Please enter
how you used this part and how it worked out.
Characterization of BBa_K1092003
1. Biobrick DNA length verification
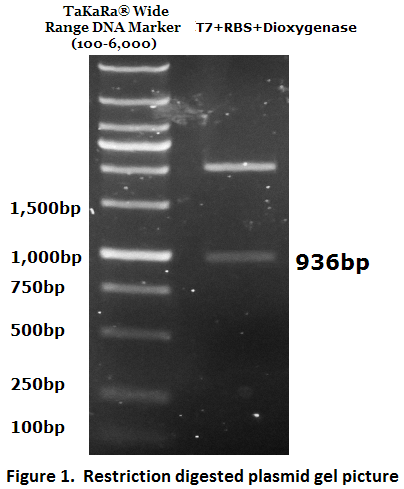
The inserted biobrick DNA length (936 bp) was confirmed by restriction digestion and agarose gel electrophoresis (Figure 1).
The DNA sequence was further verified by DNA sequencing.
2. Protein function verification by time series degradation assay
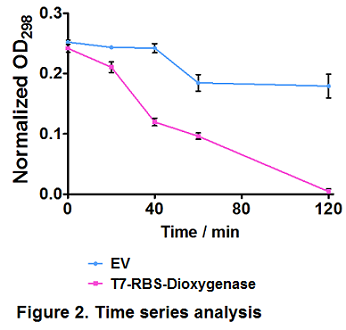
Catechol 1,2-dioxygenase is resposible for phenol degredation (Naiem et al., 2011). Before it is integrated into our PAHs degrdation system, hydroquinone, also known as benzene-1,4-diol or quinol, which is an aromatic organic compound belonging to the phenol family, was used as a substrate to test Catechol 1,2-dioxygenase expression and activity.
Time series analysis were performed. Empty vector-bearing (EV) and dioxygenase-overexpressing cells (T7-RBS-Dioxygenase) were induced by 0.3 mM IPTG at OD600 = 0.4, followed by 100 mg/L hydroquinone treatment. Cells were removed and extracellular hydroquinone was determined by OD298 at several intervals. Values represent the average of triplicate samples; error bars denote S.E.M. Paired t-test showed a significant difference in hydroquinone degradation trends between EV and dioxygenase-overexpressing cells (p ≤ 0.05) (Figure 2).
Usage and Biology
- Group: iGEM Uppsala 2015
- Authors: Delyan Georgiev, Adam Engberg, Ebba Perman, Josefin Ågren, Louise Granlund
- Summary:
The iGEM BioBrick™ BBa_K1092003 codes for Catechol 1,2 Dioxygenase from Pseudomonas putida. As an effort to improve the documentation regarding this part, the enzyme was expressed in recombinant E.coli cells and successfully purified and characterized. Basic properties like molecular mass and pI were verified against known literature, and catalytic activity under varying conditions was assayed.
- Introduction:
Uppsala University’s 2015 iGEM project is aiming to degrade polycyclic aromatic hydrocarbons, a class of recalcitrant environmental pollutants. For the purpose of achieving this, several enzymes were employed, mainly laccase and dioxygenase.
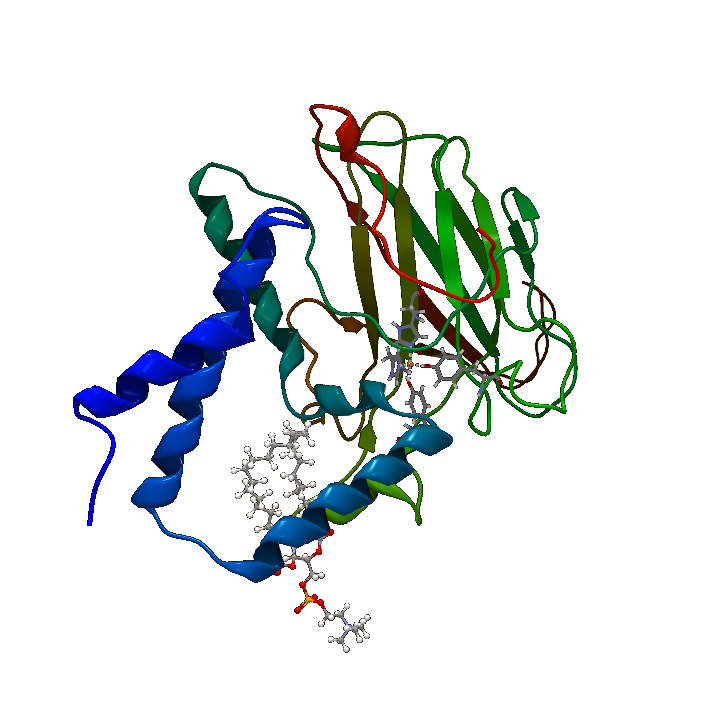
Downstream metabolites from polyaromatic compounds are varying, depending on the starting compound, but most include at least a catechol-like intermediate, which is a target for catechol 1,2 dioxygenase. The BioBrick™ was created by the 2013 team from Chinese University of Hong Kong, and while it’s reported as working, documentation is sparse. Thus, purification and characterization of the enzyme was done. Catechol 1,2 dioxygenase (Figure 1) is a metalloprotein oxidoreductase (EC 1.13.11.1) that contains non-heme Fe as a ferric ion (Fe3+). It catalyzes intradiol cleavage of catechol and similar substrates, by adding dioxygen and converting the ring structure into an open dicarboxylic acid state. According to literature, it’s a monomer of 34kDa approximate molecular weight and has a pI of 5.21. The coding part of the corresponding BioBrick™ is 933bp long (311 amino acids), and the total length is 974bp (including T7 promotor and RBS), contained in the iGEM standard high-copy plasmid pSB1C3, conferring chloramphenicol resistance.
- Methods and Materials:
Transformation of competent cells CaCl2-competent E.coli cells of DH5a and BL21DE3 strains were heat-shock transformed with 0.2 to 2 ng of the plasmid, containing the sequence of interest, and plated on selective media containing chloramphenicol. Initial transformation was performed on DH5a cells, subsequently transformed to BL21DE3 for large scale expression. Overnight cell culture A single colony of the desired transformed cells was picked up with a flame sterilized platinum inoculation loop and inoculated in 5 to 10ml of LB medium (40µg/ml chloramphenicol) in a 50ml Falcon tube and incubated overnight at 37° and 140rpm shaking. Plasmid extraction and purification High amounts (average 200ng/µl) of pure plasmid DNA were obtained with the GenElute™ Plasmid Miniprep Kit from Sigma™ (Catalog number PLN70), following the manufacturers protocol. For each purification reaction, 5ml of DH5a overnight culture with an OD600 of 1.3 was used. PCR verification of transformants Several colonies were picked at random with a sterile platinum loop and used directly as template for PCR, with the iGEM standard VF2 and VR primers and the appropriate cycling program. Each reaction volume was 50µl in total (5µM primers), using DreamTaq™ polymerase and buffer from Life Technologies, on a Bio-Rad T100 thermocycler. Products (2µl of each) were ran on 1% agarose gel in TBE buffer and GelRed™ together with DNA ladder (GeneRuler 1 kb by Thermo Fisher Scientific), 200V for 60 minutes, and results observed under UV. Expected band size was around 1300bp long. Large scale expression cultures Protein expression was performed in BL21DE3 strain of E.coli. 5ml of overnight cultures were inoculated in 500ml of Terrific Broth growth medium (500x4 = 2L total) in 2L Erlenmeyer flasks each, and incubated at 37°, 140rpm, until OD600 reached 2, then transferred to 18° and 120rpm and induced with IPTG (0.5M) for 16 hours exactly. Cultures were then transferred to 4° and proceeded immediately to protein extraction. Catechol 1,2 dioxygenase purification Cells were spun down at 4000g and distributed in 4 50mL Falcon tubes, then snap-frozen in liquid nitrogen and stored at -80° for 1h to overnight. Pellets were thawed in 15mL 50mM phosphate buffer (KH2PO4 + K2HPO4) pH 7.4, containing 1µg/mL lysozyme, then resuspended and sonicated in an ice cold water bath sonicator (6 cycles of 2 minutes on, 30 seconds off, 75W), then spun down at 16800g for 1 hour at room temperature. Supernatant was collected and filtered through 0.2µm sterile filter and kept at 4° on ice for the rest of the experiments. Crude cell extract was purified using Q Sepharose anion exchange column (26ml) using a stepwise NaCl gradient (0-1M, 50mM steps), flow rate 10ml/min, and fractions of 26ml from the eluent were collected at each step. SDS PAGE verification of product SDS PAGE was used to verify each fraction for protein contents. Fractions were separated in 5% stacking gel and 10% separating gel, with DTT added to each sample and compared against PageRuler™ Unstained Protein Ladder, by Thermo Scientific, BSA stock (200µg/ml) and the crude cell extract, 170V for 60min. Gel was stained with CBB 250G (1min. initial boil), and destained overnight (1min. initial boil) on a shaker at 60rpm. Enzymatic activity assays Catechol was used as a substrate for C12D activity assays, monitoring product formation (cis,cis-muconic acid, molar extinction coefficient of 16.0 mM-1) at 260nm in a 1mL quarts cuvette on Shimadzu 1800UV spectrophotomether, against a blank containing 50mM phosphate buffer pH 7.4, 100µM catechol, and 100µg BSA. For temperature range assays, NanoDrop™ 2000 by Thermo Scientific was used instead.
- Results:
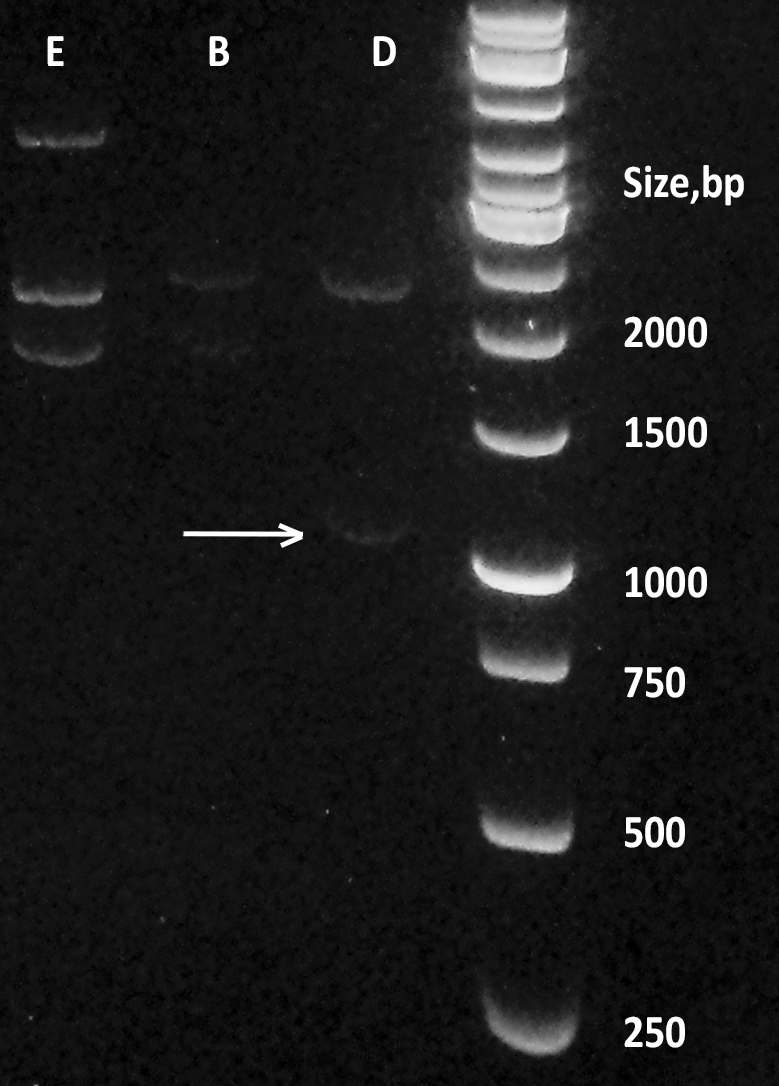
Transformation of DH5a cells with pSB1C3 plasmid, containing the BioBrick™ was successful, although not very effective (10 colonies per plate). Overnights from those colonies yielded a lot of pure plasmid DNA (average of 200 ng/ml), which was checked on an agarose gel (Figure 2.). This DNA was subsequently used to transform BL21DE3 cells with great results (more than 100 colonies per plate). Results of digestion of the plasmid with iGEM standard restriction enzymes EcoRI and PstI and agarose gel electrophoresis show that the fragment is of the appropriate length, as confirmed later by PCR colony screening (data not shown).
Expression cultures grew as expected, reaching OD600 of more than 4 at the time of harvest. Previous optimizations of lysis conditions proved effective, with 100% of cells lysed as estimated by visual inspection. After centrifugation and filtration, the crude cell extract showed 12.47±2.31 mg/ml, as measured by NanoDrop at 280nm. The total volume of the cell extract was around 60ml.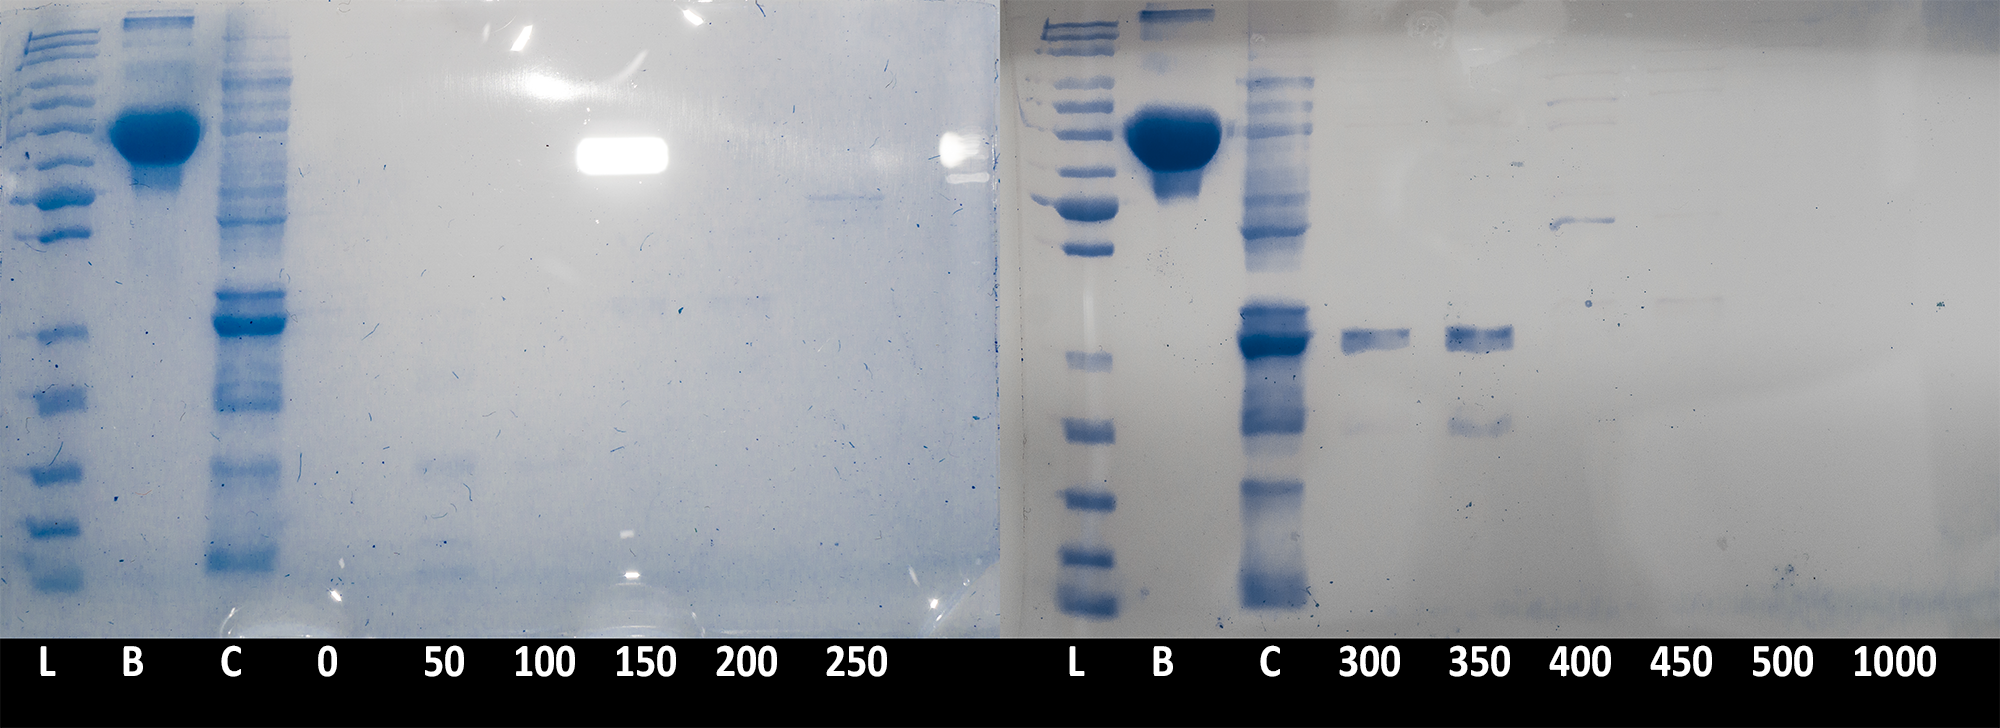
Collected fractions of each salt concentration (0 to 500mM NaCl in 50mM steps) were then ran on an SDS PAGE gel to confirm presence of the catechol 1,2 dioxygenase enzyme (Figure 3). The results confirmed that the protein is being successfully expressed in large quantities and is of the expected size. Due to the low resolution of the chromatography (fractions were collected in 26ml steps), the peak of the protein was spread between the 300mM and 350mM step.
Each fraction was then measured for protein concentration of the NanoDrop, with fractions 300 and 350 also measured more precisely by inputting Mw (34249.12 Da) and molar extinction coefficient ( 16.8 mM-1 ) into NanoDrop. Results for 300 and 350 fractions were 879 µg/ml, and 1161 µg/ml respectively. Thus fraction 300 was kept as a backup, and all further experiments were performed with fraction 350, diluted 10 times.
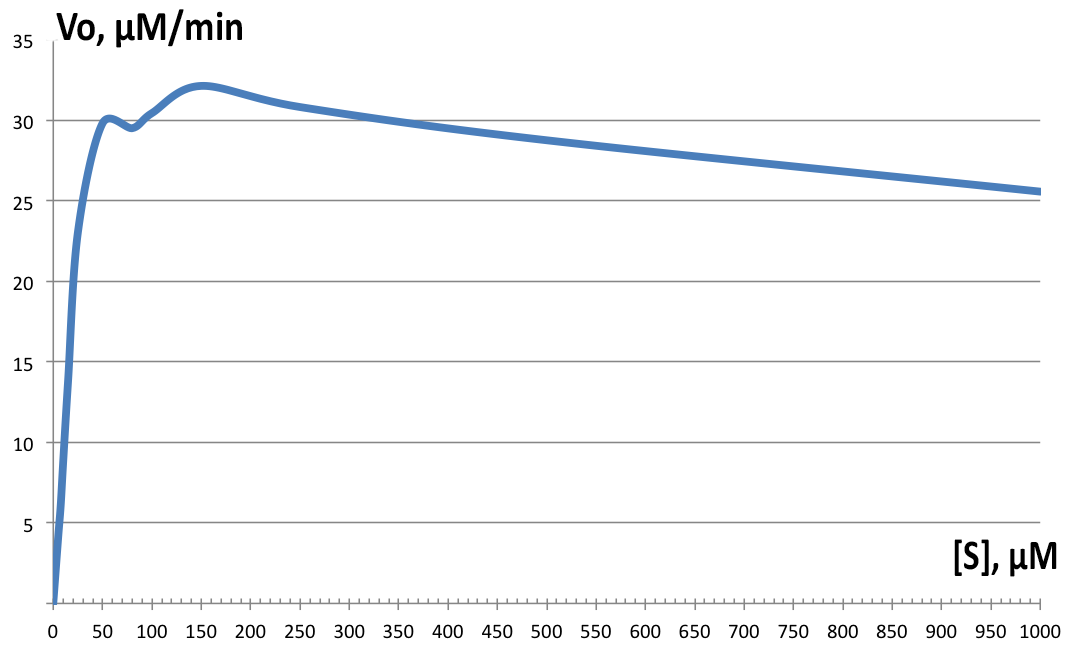
Initial velocities were measured on Shimadzu UV1800 spectrophotometer, observing cis,cis-muconic acid formation from catechol at 260nm. Serial dilutions from 5 µM to 10 mM were prepared and the assay solution as followed: blank with 100µM catechol, 100µL of 200µg/ml BSA stock in phosphate buffer; and samples with 100µL of fraction 350 added instead and varying catechol concentrations. All tests were performed at room temperature. Data was then plotted and derivatives of the resulting curves analyzed in LoggerPro™, and for Km and Vmax determination, GraphPad was used. Results are shown on Figure 4. Determined values were Vmax=32.64 µM.min-1, and Km=16.85 µM-1. The enzyme showed highest velocity at 150µM concentration of catechol, but for the rest of the tests, 100µM was used instead. The enzyme exhibits strong substrate inhibition above 400 µM substrate concentration, with 10mM completely inhibiting enzyme activity (data not shown on Figure 4).
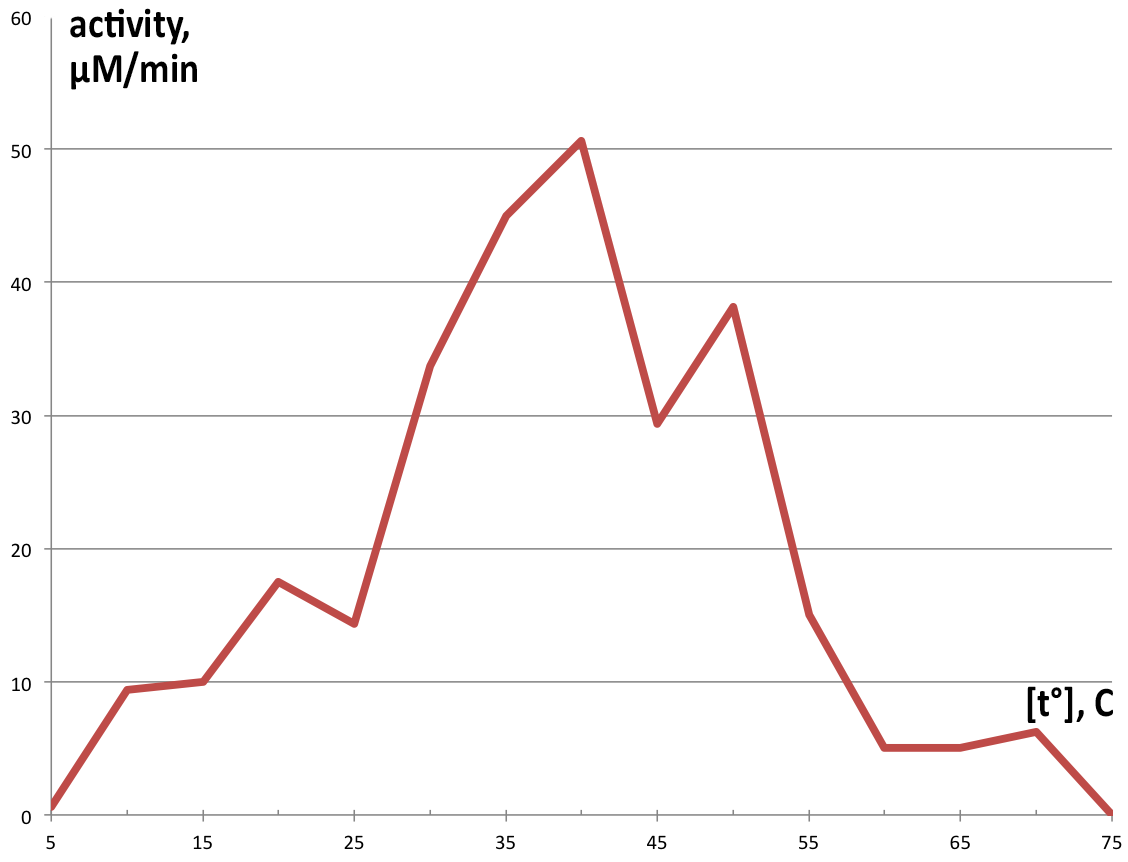
Temperature activity was assayed in 100 µl reaction volumes following the same proportions as the 1 ml reactions, using preheated thermocycler to control temperatures in each tube, and reaction was stopped after 90 seconds with addition of 50 µl 5M HCl. Measurement of this reaction was performed on NanoDrop™ T100 due to the small sample volume. Graphical representation of obtained product in one minute is displayed on Figure 5.
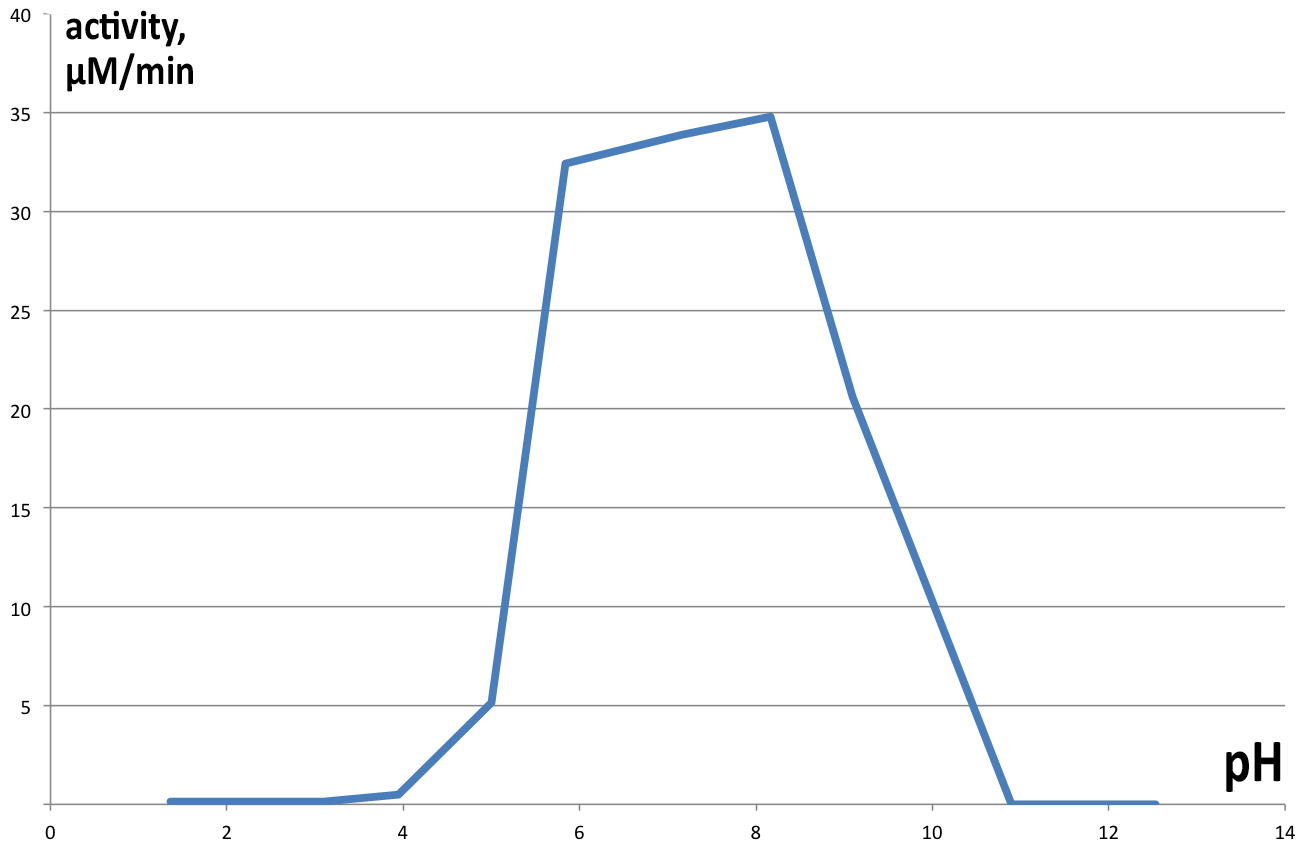
Activity of catechol 1,2 dioxygenase in varying pH environments (Figure 6) was assayed in 1 ml reaction volumes, with 100 µl of enzyme and 100µl 1mM catechol (final concentration of 100 µM) dissolved in 800 µl of buffers of varying pH (from 2 to 13). At lower pH catechol is stable, but at highly alkaline conditions it spontaneously degrades, obscuring results of the experiment, hence no data is presented for pH higher than 10. Controls were prepared for each pH separately, analogous to previous experiments. Results obtained are presented on Figure 6. Maximum velocity of 34.7875 µM.min-1 was obtained at pH 8.16 and 22°C, with very similar results for neutral pH as well (33.9 µM.min-1 at pH 7.17). pH lower than 5 completely inhibits enzyme activity, as well as pH>9.
- Discussion:
Catechol 1,2 dioxygenase was successfully expressed and extracted in large quantities, while preserving it’s activity, hence proving E.coli as a potent vector for its production. As a part of the degradation division of the 2015 Uppsala University iGEM project, that is important since catechol 1,2 dioxygenase is the major contributor to polycyclic aromatic hydrocarbon degradation. Laccases catalyze the initial oxidation of those compounds, but C12D turns them into organic acids, which are then easily metabolized downstream by other microorganisms in the community.
The obtained results show extraordinary stability of C12D, because during its purification, no protease inhibitors were added at any single point, and most of the steps were performed at room temperature, but the enzyme kept its activity. Comparison of the analyzed fraction 350 with fraction 300, which was kept as a backup at 4° showed no visible reduction of catalytic ability after 24h, and 50% reduction in activity after 4 days (data not shown). Since a major point of the Uppsala University iGEM 2015 project is to export the degrading enzymes out of the cell, the primary focus was on pH and temperature stability, as well as Km, since in the environment conditions will be harsh, and concentrations of substrate will be low. Dioxygenase shows a wide range of temperature stability, losing it’s activity completely only in extreme conditions. The enzyme has some residual catalytic functions at temperatures below 20, but it is as low as 18% of the maximum at 10°, which for practical purposes is unacceptable. It’s pH range is narrow, showing a peak around pH7, which is perfect for laboratory conditions, but not for the environment, where pH can vary by several units. Especially alarming is the complete inhibition of catalytic function below pH 5, which is often the range at which contaminated environments are (3-5). Dioxygenase shows very high substrate specificity and quickly approaches Vmax with increase in catechol concentrations. This is favorable for extracellular conditions, where any substrate produced by laccases is diluted several orders of magnitude. This specific isoform is suitable for extracellular export, since most known dioxygenases are dimers, stabilized by noncovalent interactions, and the current catechol 1,2 dioxygenase is a monomer. Inferring from the crystal structure of the enzyme, both its C and N termini do not participate in critical interactions within the enzyme, which makes them suitable sites for export tag fusion. A way to further this study would be developing standardized assay to quickly screen different organisms for dioxygenase activity, and compare catalytic parameters to obtain an enzyme that meets the demands of the extracellular environment better, especially in regards to pH and temperature optimums.
- Sources:
Roberts, S.A., Weichsel, A., Grass, G., Thakali, K., Hazzard, J.T., Tollin, G., Rensing, C., and Montfort, W.R. (2002). Crystal structure and electron transfer kinetics of CueO, a multicopper oxidase required for copper homeostasis in Escherichia coli. Proc. Natl. Acad. Sci. 99, 2766–2771.
Guzik, U., Greń, I., Hupert-Kocurek, K., and Wojcieszyńska, D. (2011). Catechol 1,2-dioxygenase from the new aromatic compounds – Degrading Pseudomonas putida strain N6. Int. Biodeterior. Biodegrad. 65, 504–512. Kim, Y.H., Cho, K., Yun, S.-H., Kim, J.Y., Kwon, K.-H., Yoo, J.S., and Kim, S.I. (2006). Analysis of aromatic catabolic pathways in Pseudomonas putida KT 2440 using a combined proteomic approach: 2-DE/MS and cleavable isotope-coded affinity tag analysis. PROTEOMICS 6, 1301–1318. Naiem H Nadaf, J.S.G. (2011). Purification and characterization of catechol 1, 2-dioxygenase from Rhodococcus sp. NCIM 2891. Res J Env. Earth Sci 3. Nakai, C., Horiike, K., Kuramitsu, S., Kagamiyama, H., and Nozaki, M. (1990). Three isozymes of catechol 1,2-dioxygenase (pyrocatechase), alpha alpha, alpha beta, and beta beta, from Pseudomonas arvilla C-1. J. Biol. Chem. 265, 660–665. Preti Saxena, I.S.T. (2004). Purification and characterization of catechol 1,2-dioxygenase of Pseudomonas fluorescens for degradation of 4-chlorobenzoic acid. Indian J Biotechnol 4. Zeyer, J., Kocher, H.P., and Timmis, K.N. (1986). Influence of para-substituents on the oxidative metabolism of o-nitrophenols by Pseudomonas putida B2. Appl. Environ. Microbiol. 52, 334–339.
Sequence and Features
- 10COMPATIBLE WITH RFC[10]
- 12COMPATIBLE WITH RFC[12]
- 21INCOMPATIBLE WITH RFC[21]Illegal BglII site found at 176
- 23COMPATIBLE WITH RFC[23]
- 25COMPATIBLE WITH RFC[25]
- 1000COMPATIBLE WITH RFC[1000]
User Reviews
UNIQ114b157c1a7dfaf1-partinfo-00000031-QINU UNIQ114b157c1a7dfaf1-partinfo-00000032-QINU

