Difference between revisions of "Part:BBa K1725000"
Kshitijrai (Talk | contribs) |
|||
| (22 intermediate revisions by 3 users not shown) | |||
| Line 1: | Line 1: | ||
| − | |||
__NOTOC__ | __NOTOC__ | ||
<partinfo>BBa_K1725000 short</partinfo> | <partinfo>BBa_K1725000 short</partinfo> | ||
| − | |||
| − | |||
<!-- Add more about the biology of this part here | <!-- Add more about the biology of this part here | ||
| Line 12: | Line 9: | ||
<partinfo>BBa_K1725000 SequenceAndFeatures</partinfo> | <partinfo>BBa_K1725000 SequenceAndFeatures</partinfo> | ||
| + | This promoter was characterised by using it to drive expression of GFP with two different Ribosome Binding Sites, <bbpart>BBa_B0032</bbpart> in E5501 and <bbpart>BBa_B0034</bbpart> in I13500. PphlF is a stronger promoter than pL-tet (<bbpart>BBa_R0040</bbpart> or PsrpR (<bbpart>BBa_K1725020</bbpart>). (figure 1) PhlF (<bbpart>BBa_K1725040</bbpart>) gave 83-fold repression of GFP expression from PphlF, whereas the control, TetR (<bbpart>BBa_C0040</bbpart>), gave only 33-fold repression of pL-tet. (figure 2) | ||
| + | |||
| + | |||
| + | https://static.igem.org/mediawiki/parts/e/ee/Glasgow_2015_Promoter_Strength_Graph.png | ||
| + | |||
| + | <b>Figure 1 Relative Promoter Strength. BioBricks: K1725082 (pL-tet driving GFP expression with B0034), E5504 (pL-tet driving GFP expression with B0032), K1725001 (PphlF driving GFP expression with B0034), and K1725002 (PphlF driving GFP expression with B0032). Mean and standard deviation of replicates were calculated to give value and error bars, and normalised against a negative control.</b> | ||
| + | |||
| + | |||
| + | https://static.igem.org/mediawiki/parts/7/78/Glasgow_2015_Fold_Repression_Graph.png | ||
| + | |||
| + | <b>Figure 2 Fold Repression. BioBricks: K1725082 (pL-tet driving GFP expression), K1725031 (pL-lac driving TetR expression), K1725001 (PphlF driving GFP expression), and K1725042 (pL-lac driving PhlF expression). Repressor protein expression induced with 100μM IPTG. Mean and standard deviation of replicates were calculated to give value and error bars, and normalised against a negative control.</b> | ||
| + | |||
| + | <h2> <b> IIT Delhi 2017 - Characterization of Promoter Strength </b> </h2> | ||
| + | <p> We see in Fig. 1 that the decreasing order of strengths for the five repressible promoters is pLac, pcI, pPhlF, pTet and pSrpR. This is also evident in Fig. 2 when all the 5 promoters settle to a steady state. Fig. 3 depicts the protein production rates for the promoters. pLac has the largest production rate reaffirming its highest strength. However, despite dominating completely in terms of protein production rate, we see in Figs. 2 and 4 that in the initial transient phase, pLac has lower relative strength compared to pTet and pcI. This is due to the highest dilution rate for pLac in this regime, which can be seen in Figs. 5 and 6. Similar arguments can be made about pcI. </p> | ||
| + | |||
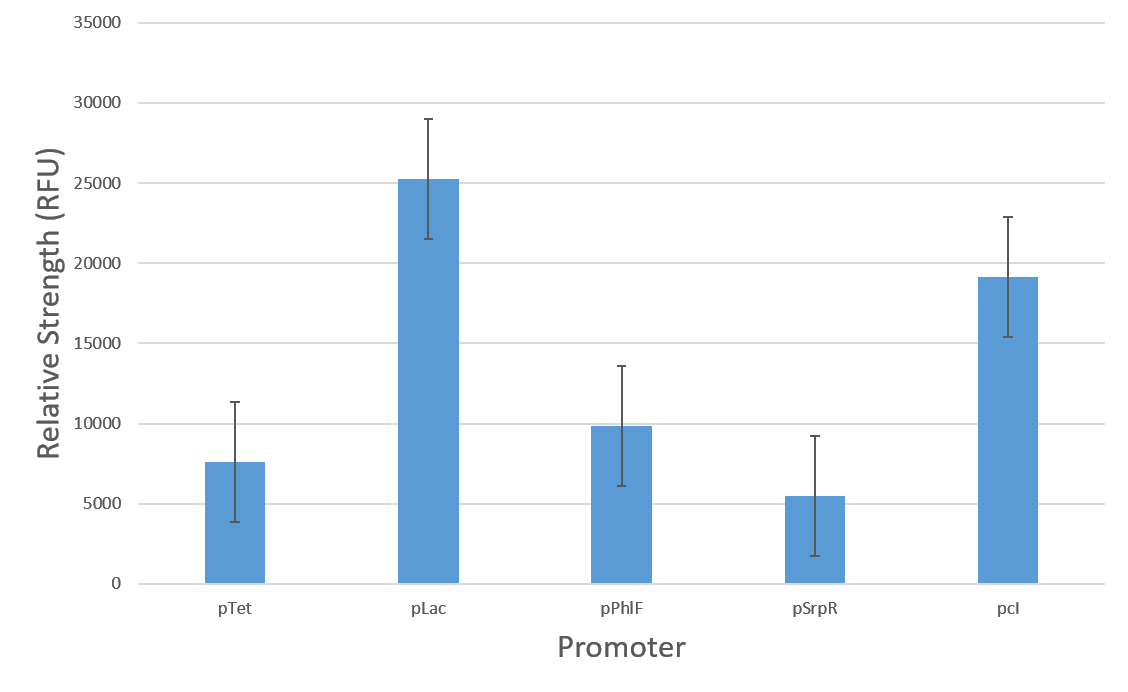
| + | [[File:Photobleaching_Fig_1.png|900px|thumb|left|Fig 1. Relative Strength for the five repressible promoters, including the novel promoters pPhlF and pSrpR, used in the construction and analysis of 5n1. The decreasing order of relative strength is pLac > pcI > pPhlF > pTet > pSrpR. Rlative strengths have been averaged over 4 trials.]] | ||
| + | |||
| + | |||
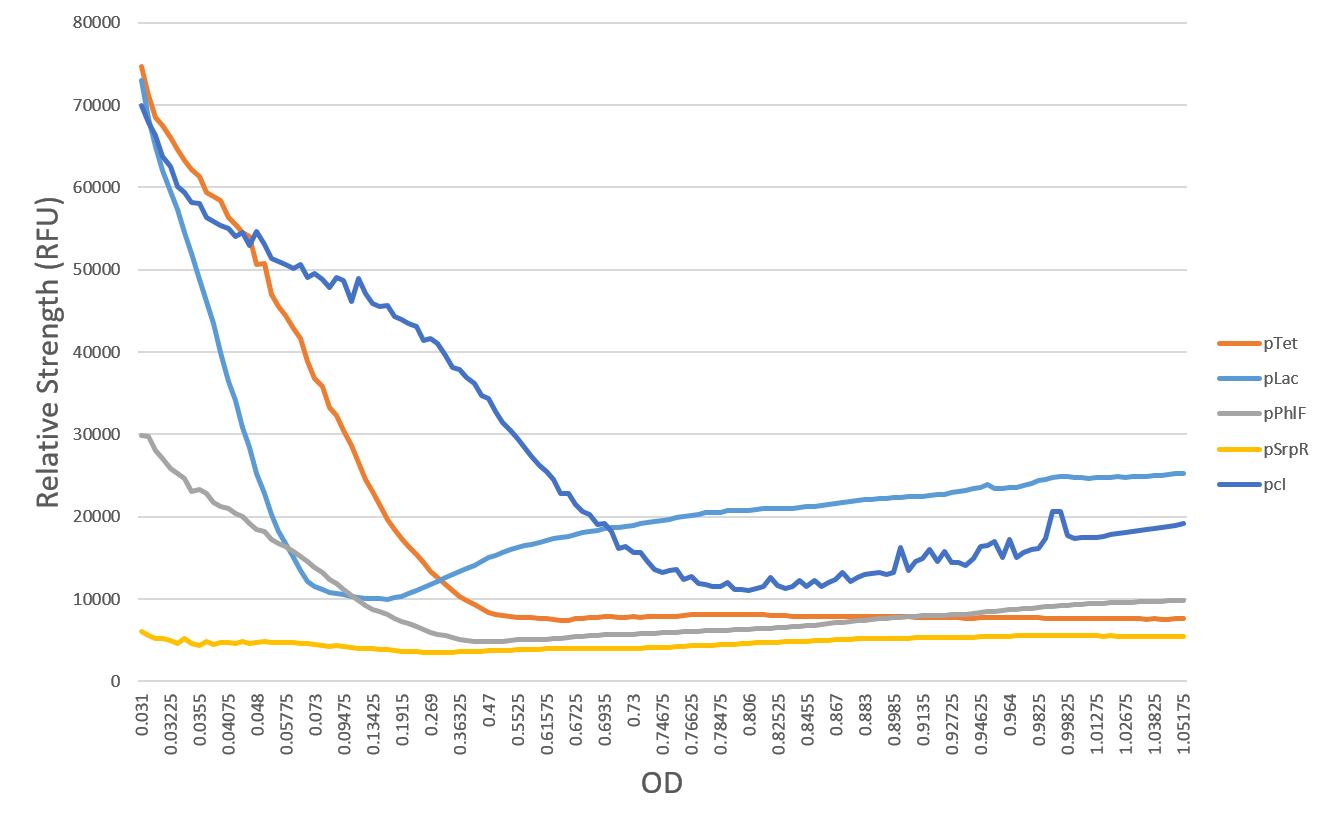
| + | [[File:Photobleaching_Fig_2.png|900px|thumb|left|Fig 2. Relative Strength over time for the five repressible promoters, including the novel promoters pPhlF and pSrpR, used in the construction and analysis of 5n1. The plots have been averaged over 4 trials.]] | ||
| + | |||
| + | |||
| + | [[File:Photobleaching_Fig_3.png|900px|thumb|left|Fig 3. Protein production rate over time for the five repressible promoters, including the novel promoters pPhlF and pSrpR, used in the construction and analysis of 5n1. The plots have been averaged over 4 trials.]] | ||
| + | |||
| + | |||
| + | [[File:Photobleaching_Fig_4.png|900px|thumb|left|Fig 4. Relative Strength versus OD over time for the five repressible promoters, including the novel promoters pPhlF and pSrpR, used in the construction and analysis of 5n1. The plots have been averaged over 4 trials.]] | ||
| + | |||
| + | |||
| + | [[File:Photobleaching_Fig_5.png|900px|thumb|left|Fig 5. Dilution rate over time for the five repressible promoters, including the novel promoters pPhlF and pSrpR, used in the construction and analysis of 5n1. The plots have been averaged over 4 trials.]] | ||
| + | |||
| + | |||
| + | [[File:Photobleaching_Fig_6.png|900px|thumb|left|Fig 6. OD over time for the five repressible promoters, including the novel promoters pPhlF and pSrpR, used in the construction and analysis of 5n1. The plots have been averaged over 4 trials.]] | ||
| + | |||
| + | |||
| + | |||
| + | <p> As shown in Fig. 2, pLac and pcI have three distinct regions of behavior in terms of relative strength over time. In the initial transient phase, dilution rate is higher than the protein production rate, thus we see that relative strength per OD decreases over time. The middle corresponds to overcompensation phase, where protein production rate surpasses the dilution rate. Finally, the relative strength settles a steady state value, entering an exact compensation between protein production and dilution rates. Contrary to pLac and pcI, the other promoters don’t exhibit the overcompensation phase. </p> | ||
<!-- Uncomment this to enable Functional Parameter display | <!-- Uncomment this to enable Functional Parameter display | ||
Latest revision as of 03:09, 28 October 2017
PhlF repressible promoter
Sequence and Features
- 10COMPATIBLE WITH RFC[10]
- 12COMPATIBLE WITH RFC[12]
- 21COMPATIBLE WITH RFC[21]
- 23COMPATIBLE WITH RFC[23]
- 25COMPATIBLE WITH RFC[25]
- 1000COMPATIBLE WITH RFC[1000]
This promoter was characterised by using it to drive expression of GFP with two different Ribosome Binding Sites, BBa_B0032 in E5501 and BBa_B0034 in I13500. PphlF is a stronger promoter than pL-tet (BBa_R0040 or PsrpR (BBa_K1725020). (figure 1) PhlF (BBa_K1725040) gave 83-fold repression of GFP expression from PphlF, whereas the control, TetR (BBa_C0040), gave only 33-fold repression of pL-tet. (figure 2)

Figure 1 Relative Promoter Strength. BioBricks: K1725082 (pL-tet driving GFP expression with B0034), E5504 (pL-tet driving GFP expression with B0032), K1725001 (PphlF driving GFP expression with B0034), and K1725002 (PphlF driving GFP expression with B0032). Mean and standard deviation of replicates were calculated to give value and error bars, and normalised against a negative control.

Figure 2 Fold Repression. BioBricks: K1725082 (pL-tet driving GFP expression), K1725031 (pL-lac driving TetR expression), K1725001 (PphlF driving GFP expression), and K1725042 (pL-lac driving PhlF expression). Repressor protein expression induced with 100μM IPTG. Mean and standard deviation of replicates were calculated to give value and error bars, and normalised against a negative control.
IIT Delhi 2017 - Characterization of Promoter Strength
We see in Fig. 1 that the decreasing order of strengths for the five repressible promoters is pLac, pcI, pPhlF, pTet and pSrpR. This is also evident in Fig. 2 when all the 5 promoters settle to a steady state. Fig. 3 depicts the protein production rates for the promoters. pLac has the largest production rate reaffirming its highest strength. However, despite dominating completely in terms of protein production rate, we see in Figs. 2 and 4 that in the initial transient phase, pLac has lower relative strength compared to pTet and pcI. This is due to the highest dilution rate for pLac in this regime, which can be seen in Figs. 5 and 6. Similar arguments can be made about pcI.
As shown in Fig. 2, pLac and pcI have three distinct regions of behavior in terms of relative strength over time. In the initial transient phase, dilution rate is higher than the protein production rate, thus we see that relative strength per OD decreases over time. The middle corresponds to overcompensation phase, where protein production rate surpasses the dilution rate. Finally, the relative strength settles a steady state value, entering an exact compensation between protein production and dilution rates. Contrary to pLac and pcI, the other promoters don’t exhibit the overcompensation phase.


