Difference between revisions of "Part:BBa I13522:Experience"
m (→Characterisations of BBa_I13522) |
m (→Method) |
||
| Line 12: | Line 12: | ||
=== Method === | === Method === | ||
| − | BBa_I13522 pSB1C3 plasmids were rescued from Spring 2014 Distribution Plate 3-6I, and transformed into XL1Blue ''E. coli.'' After selection on Chloramphenicol LB agar, monoclonal liquid cultures were prepared in chloramphenicol LB liquid. | + | BBa_I13522 pSB1C3 plasmids were rescued from Spring 2014 Distribution Plate 3-6I, and transformed into competent XL1Blue ''E. coli.'' After selection on Chloramphenicol LB agar, monoclonal liquid cultures were prepared in chloramphenicol LB liquid. |
Cells were immobilised on a Poly-Lysine membrane in a 96well plate. GFP measured using a FluoSTAR OPTIMA fluorescence plate reader. | Cells were immobilised on a Poly-Lysine membrane in a 96well plate. GFP measured using a FluoSTAR OPTIMA fluorescence plate reader. | ||
| Line 20: | Line 20: | ||
# Unbound cells removed by lightly shaking over waste and washed three times with Phosphate-Buffered Saline (PBS). 50μl fresh LB medium was added to each well. | # Unbound cells removed by lightly shaking over waste and washed three times with Phosphate-Buffered Saline (PBS). 50μl fresh LB medium was added to each well. | ||
# A FluoSTAR OPTIMA Fluoresence Plate Reader was used to measure Green (Excitation 485nm/Emission 520nm) Fluoresence every 5 minutes for 420 minutes, this incubates the samples at 37C and shakes (1mm double-orbital) for 30 seconds before each read. | # A FluoSTAR OPTIMA Fluoresence Plate Reader was used to measure Green (Excitation 485nm/Emission 520nm) Fluoresence every 5 minutes for 420 minutes, this incubates the samples at 37C and shakes (1mm double-orbital) for 30 seconds before each read. | ||
| − | |||
=== Results === | === Results === | ||
Latest revision as of 21:07, 26 October 2014
Characterisations of BBa_I13522
iGEM Team Aberdeen 2014
BBa_I13522 on pSB1C3 constitutively expresses GFP in XL1Blue E.coli.
Aims
BBa_I13522 was used as a positive control for comparison to Part:BBa_T9002 GFP expression in response to AHL induction.
Method
BBa_I13522 pSB1C3 plasmids were rescued from Spring 2014 Distribution Plate 3-6I, and transformed into competent XL1Blue E. coli. After selection on Chloramphenicol LB agar, monoclonal liquid cultures were prepared in chloramphenicol LB liquid. Cells were immobilised on a Poly-Lysine membrane in a 96well plate. GFP measured using a FluoSTAR OPTIMA fluorescence plate reader.
- 50μl 0.01% Poly-Lysine was added to each well, of a 96 well glass-bottom Plate (Whatman). Incubated at room temperature for 2 hours.
- Excess Poly-Lysine removed and washed three times with sterile water. Allowed to dry at room temperature.
- E. coli cultures grown overnight in a 37C shaking water bath, single culture wells diluted as required to achieve an Optical Density-600nm(OD600) of 0.02.
- Unbound cells removed by lightly shaking over waste and washed three times with Phosphate-Buffered Saline (PBS). 50μl fresh LB medium was added to each well.
- A FluoSTAR OPTIMA Fluoresence Plate Reader was used to measure Green (Excitation 485nm/Emission 520nm) Fluoresence every 5 minutes for 420 minutes, this incubates the samples at 37C and shakes (1mm double-orbital) for 30 seconds before each read.
Results
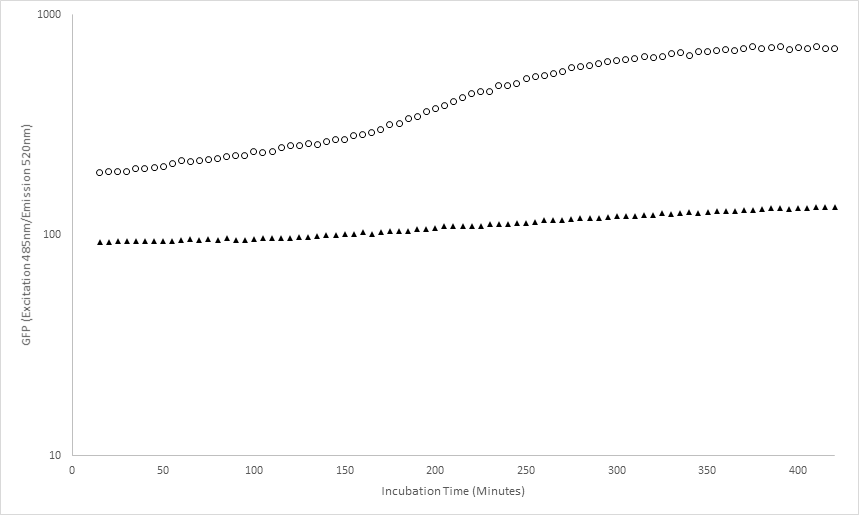
BBa_I13522 transformed E. coli exhibited higher Green fluorescence than untransformed E. coli, this increased over time, with absolute green fluorescence plateauing at 300minutes.
Figure 1 – BBa_I13522 constitutively expresses GFP. Mean green fluorescence (Excitation 485nm/Emission 520nm) of BBa_I13522 transformed E.Coli (circles) and untransformed E. coli (triangles), immobilised on Poly-Lysine. 50μl Chloramphenicol liquid LB, reading every 5 minutes, incubated at 37C and shaking, in 96well plate.
Conclusion
The plasmid BBa_I13522 on pSB1C3 constitutively expresses GFP when transformed into XL1Blue E. coli.
KIT-Kyoto iGEM Team 2013
2013 KIT-Kyoto iGEM team assessed influence of fluorescence proteins on
the growth of E.coli. We used BBa_I13521, BBa_I13522 and BBa_I13600 in order to measure the
growth.
We measured the turbidities of the transformants at hourly intervals
and made the growth curves. We transferred the transformant prepared to 200 mL flasks. We measured the turbidities every 1 hour. The measurements were carried out for 12 hours.
Liquid LB 50mL
Sample 20µL
Ampicillin 75µL
37°C, 125rpm
Control:HST08
As the result, it was found that eCFP and mRFP have the effect of
growth promotion relative to GFP.
Haynes Lab 2012
I used BBa_I13522 to demonstrate the expression of GFP in E. coli for a
biomedical engineering course at Arizona State University.
- Cells: NEB10B
- Medium: LB Lennox agar, 100 ug/mL ampicillin
- The read area contains bacteria expressing RFP from BBa_J04450
iGEM team Wageningen UR 2012
This brick was used to create GFP with a coiled coil at the N-terminus
to use it as reporter for the E- and K-coil
[http://2012.igem.org/Team:Wageningen_UR/Coil_system Plug and Apply
sytem]
see [https://parts.igem.org/wiki/index.php?title=Part:BBa_K883704
BBa_K883704]; [https://parts.igem.org/wiki/index.php?
title=Part:BBa_K883705 BBa_K883705]
Imperial College London 2011 iGEM team
Thermostability Assay
For this BioBrick, the denaturation temperature was determined by heating the protein at a range of temperatures, and then measuring the fluorescence. This is a useful characterisation as it allows the selection of an appropriate reporter gene for the required temperature.
Stock solutions of GFP were prepared by extracting the protein from cell lysate, and then 50 µl aliquots of the solution were heated in a PCR thermocycler along a temperature gradient.
After two hours, 30 µl was removed from each aliquot and diluted with 170 µl of 20 mM Tris buffer to give 200 µl samples. The fluorescence of the samples was then measured on a 96-well plate. The corresponding curve was plotted on the graph below.

Results of the heat denaturation experiment. The temperature at which half of the protein is denatured is measured by observing its fluorescence (PTm50) mRFP1: 82.2°C; GFPmut3b: 61.6°C; Dendra2: 89.1°C; sfGFP: 75.0°C.
The sigmoidal curves that were calculated gave us the following function which also created the coefficient K which happens to relate to PTm50 (temperature at which half of the protein is denatured measured by looking at its fluorescence):

METU-TURKEY IGEM 2010 Team
For parts BBa_I13521 and BBa_I13522, their excitation and emission
maxima were determined. BBa_B0034 was used as a negative control. These
data were used later in following characterisation experiments as set
parameters. The host was E. coli Top Ten in all experiments.
Meanwhile, the graph below shows the emission scan for GFP in part
BBa_I13522. Since it was the best option in terms of fluorescence
yield, 395 nm was set as the excitation wavelength. As it can be seen
from the graph, maximum emission wavelength is 515 nm.

Reviews of I13522
UNIQeb4d051aad2d9c84-partinfo-00000002-QINU
|
Antiquity |
This review comes from the old result system and indicates that this part did not work in some test. |
|
•••••
|
We obtained this part from the Spring 2011 distribution plate. It expresses wonderfully in NEB10B cells from New England Biolabs. It does not express well in the fast-growing strain DH5-alpha Turbo, which we've found doesn't express transgenes very well in general. |
|
•••••
iGEM Team Wageningen UR 2014 |
We obtained this part from the Spring 2014 distribution plate. It doesn't express in E. coli DH5-alpha or NEB 5-alpha strains. We sequenced this part and we concluded that this parts sequence is inconsistent, missing 25 bp of the promoter sequence. Therefore, we made a twin of this part, BBa_K1493504. We did this by assembly of pTet (BBa_R0040) and GFP (BBa_I13504) using standard BioBrick assembly. Sequencing with the forward primer VF2 (5'-tgccacctgacgtctaagaa-3') confirmed the right sequence. |
UNIQeb4d051aad2d9c84-partinfo-00000007-QINU


