Difference between revisions of "Part:BBa K1073022:Experience"
(→User Reviews) |
|||
| (23 intermediate revisions by 6 users not shown) | |||
| Line 5: | Line 5: | ||
===Applications of BBa_K1073022=== | ===Applications of BBa_K1073022=== | ||
| − | When eforRed is expressed the colonies on agar plates as well as | + | The iGEM Team Braunschweig 2013 used this device as a reporter to distinguish two different strains when cultivated in a mixed culture. <br> When eforRed is expressed, the colonies on agar plates as well as the liquid culture exhibit a bright pink color. |
| + | |||
| + | |||
| + | ===Part Sequence Quality=== | ||
| + | |||
| + | '''The Tech Museum, May 2014''': This part's real sequence may end with two stop codons, TAATAA. This is not listed in [https://parts.igem.org/Part:BBa_K592012 the original source part's sequence] or in this part's sequence, but [https://parts.igem.org/cgi/sequencing/one_blast.cgi?update_database=1&id=19622 sequencing from the registry] indicates it may be present. Beware. | ||
===User Reviews=== | ===User Reviews=== | ||
| Line 16: | Line 21: | ||
<I>iGEM Team Braunschweig 2013</I> | <I>iGEM Team Braunschweig 2013</I> | ||
|width='60%' valign='top'| | |width='60%' valign='top'| | ||
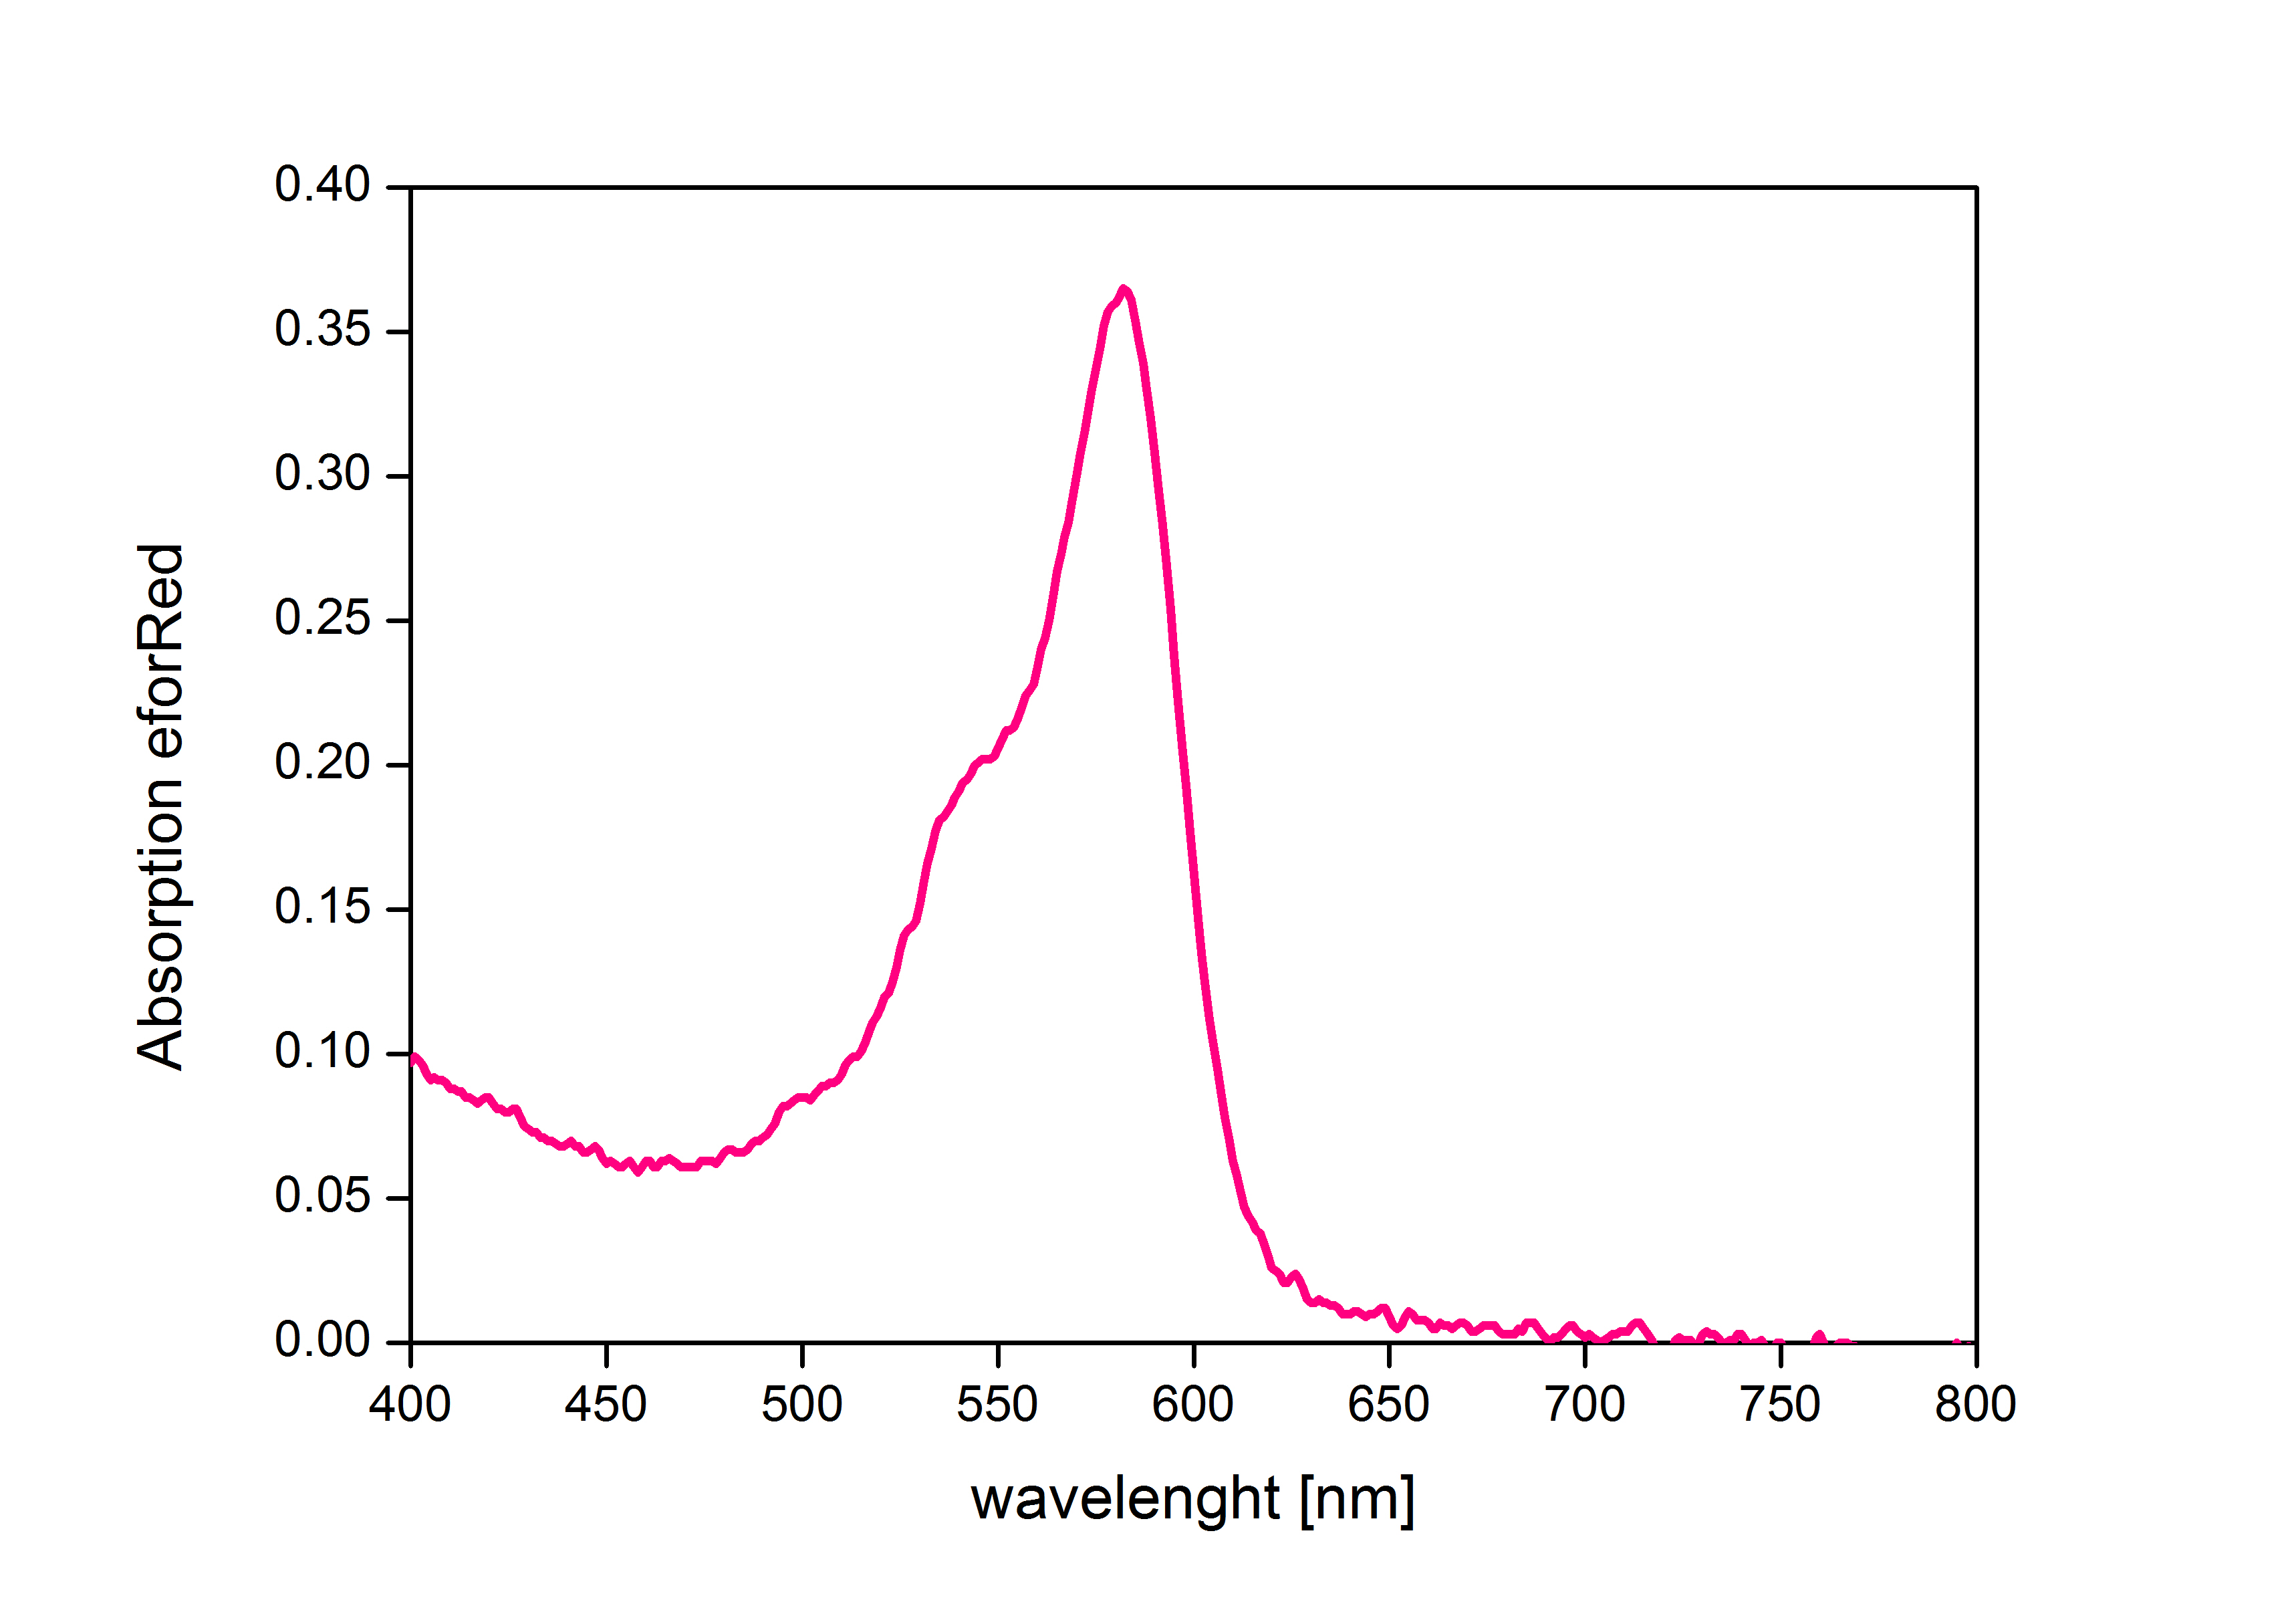
| − | When expressed the chromoprotein eforRed exhibits a distinct pink color. In order to avoid absorption | + | When expressed, the chromoprotein eforRed exhibits a distinct pink color. In order to avoid absorption by the chomoprotein during OD measurement of a bacterial culture, the absorption and emission spectra were measured. An optimal wavelength for spectral optical density measurement was determined to be at 520nm. |
[[File:BSAbsorption-eforRed.jpg |400px]] | [[File:BSAbsorption-eforRed.jpg |400px]] | ||
| − | '''iGEM Team Braunschweig 2013:''' | + | '''iGEM Team Braunschweig 2013:''' Absorption spectrum of chromoprotein eforRed in the wavelength range 400-800 nm. |
'''Absorption maximum of eforRed:''' 534 nm | '''Absorption maximum of eforRed:''' 534 nm | ||
| Line 26: | Line 31: | ||
[[File:BS2013Emission eforRed.jpg |400px]] | [[File:BS2013Emission eforRed.jpg |400px]] | ||
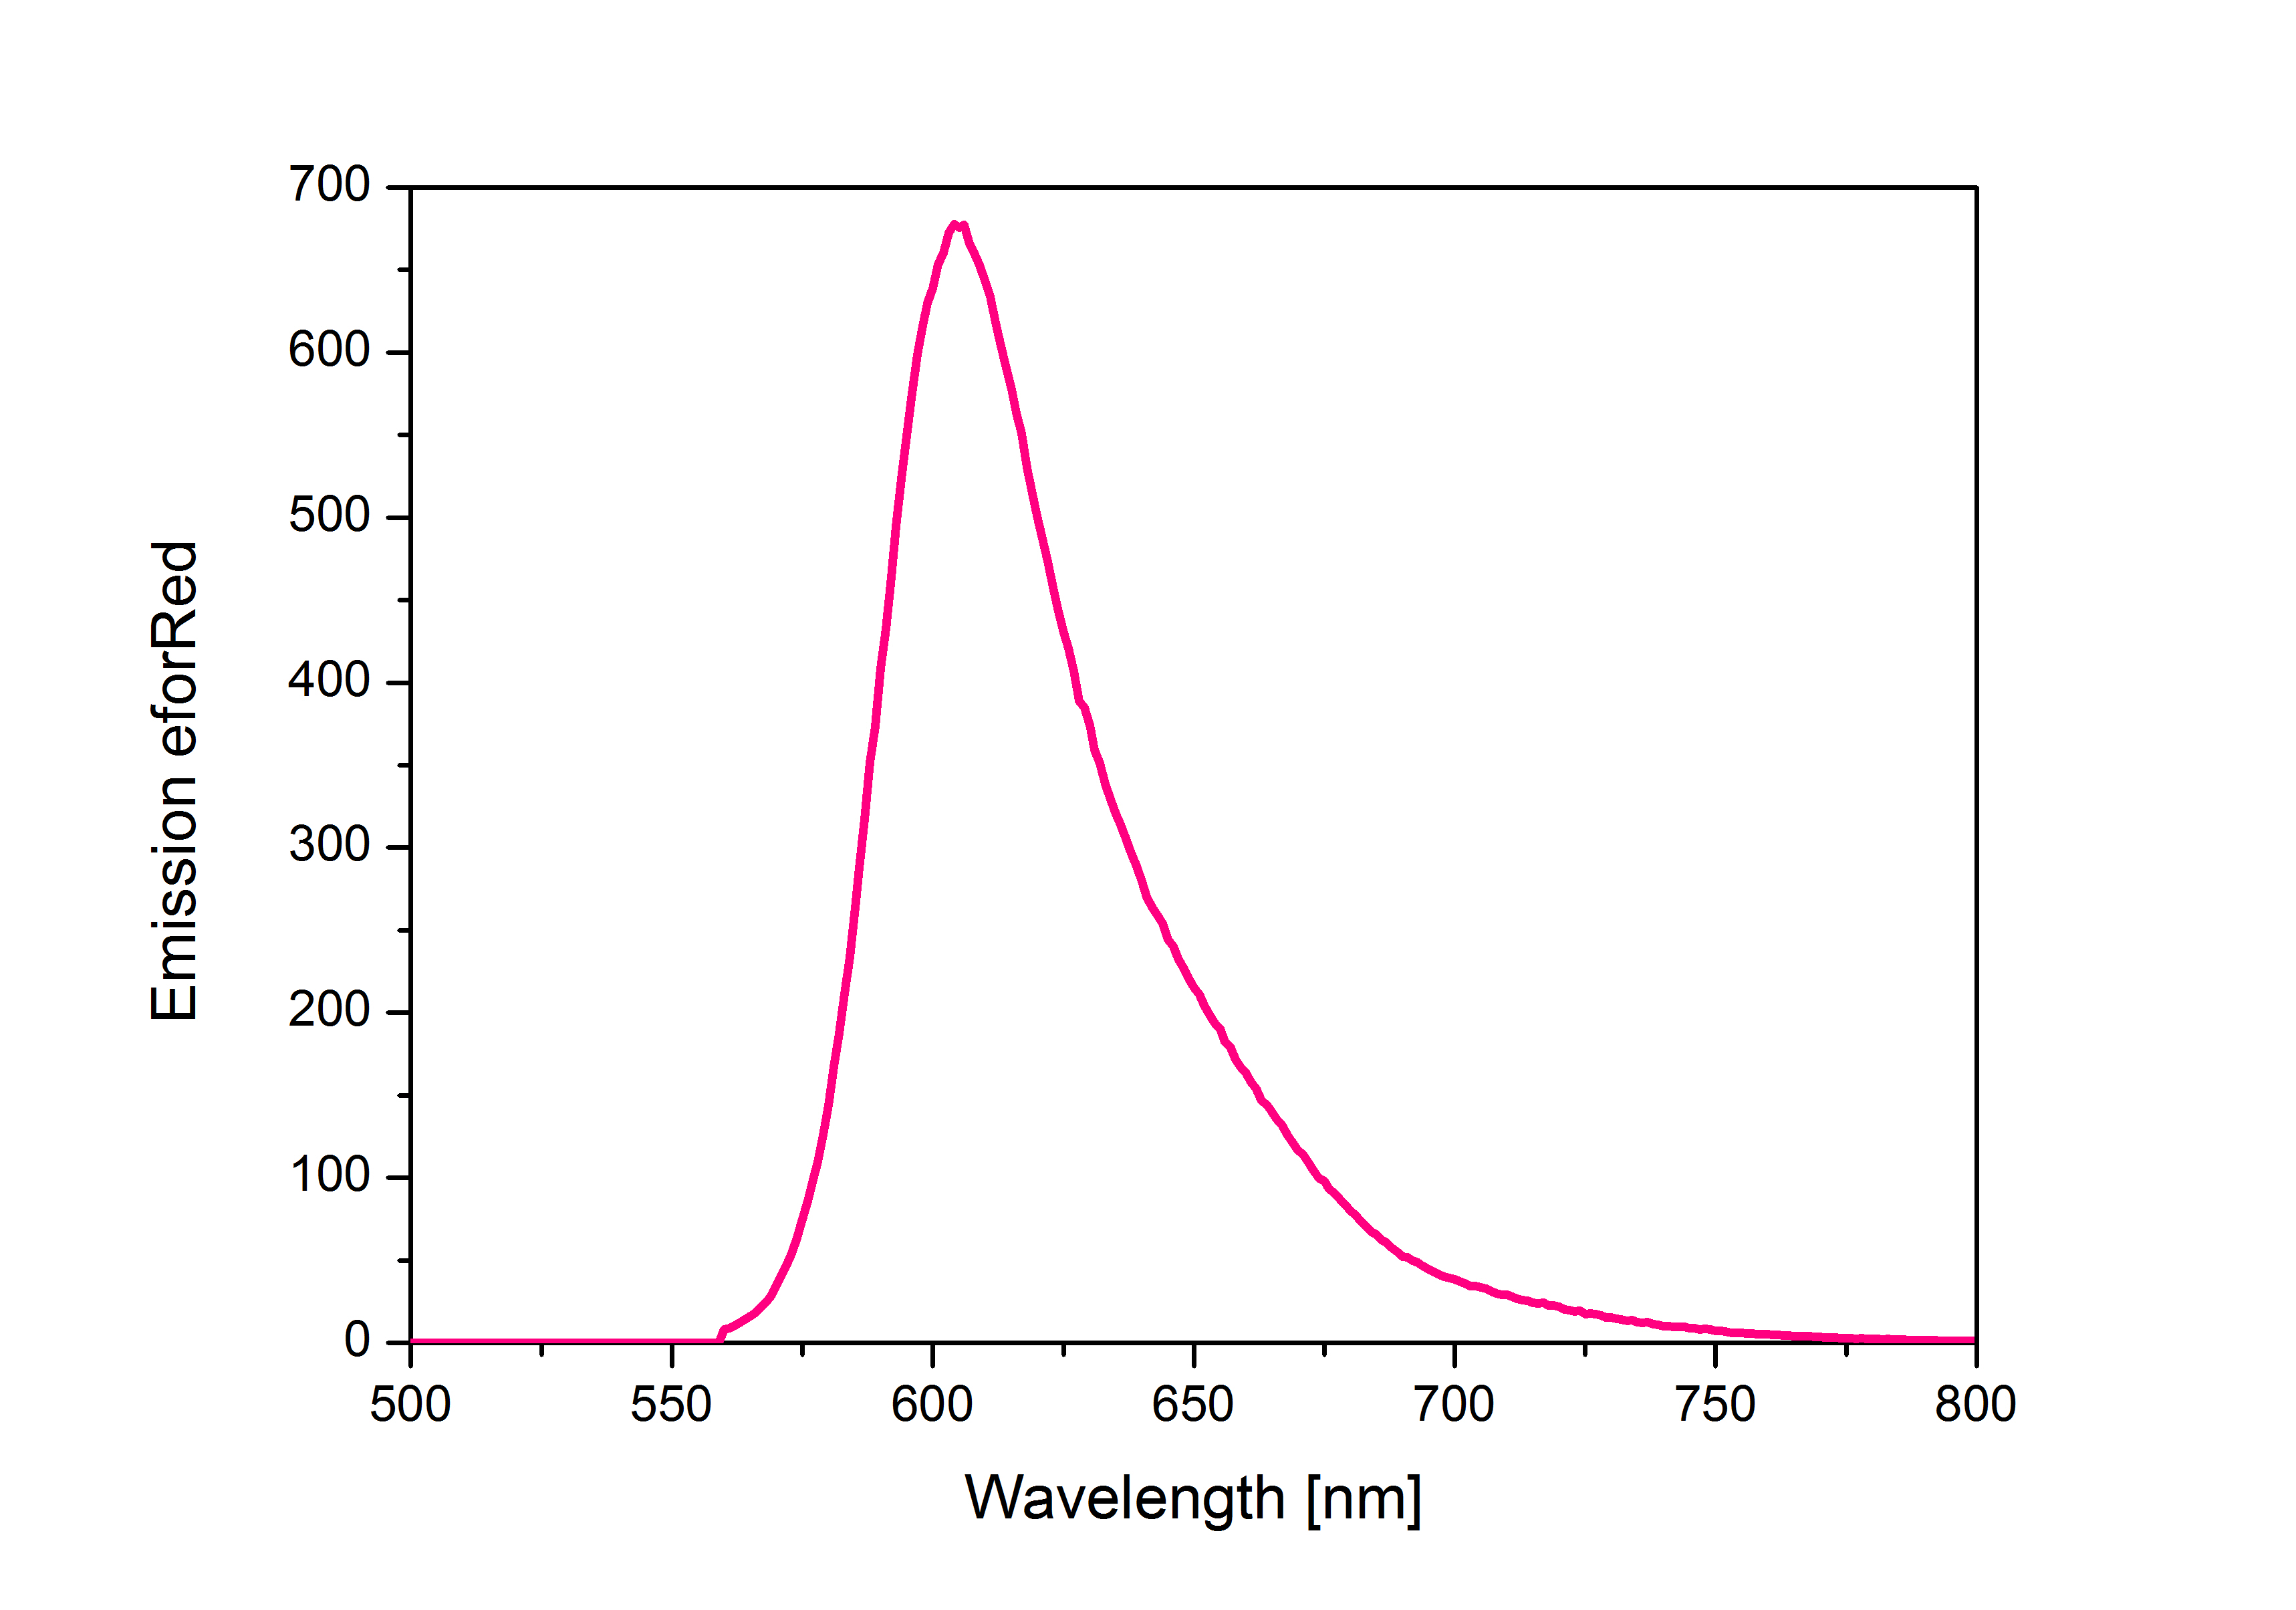
| − | '''iGEM Team Braunschweig 2013:''' Emission spectrum of chromoprotein eforRed. | + | '''iGEM Team Braunschweig 2013:''' Emission spectrum of chromoprotein eforRed. The chromoprotein does show significant emission and can be detected by its fluorescence. |
| + | |||
| + | '''Emission maximum of eforRed:''' 605 nm <br> | ||
| + | |||
| + | |||
| + | [[File:Fluorescence.JPG |200px]] | ||
| + | |||
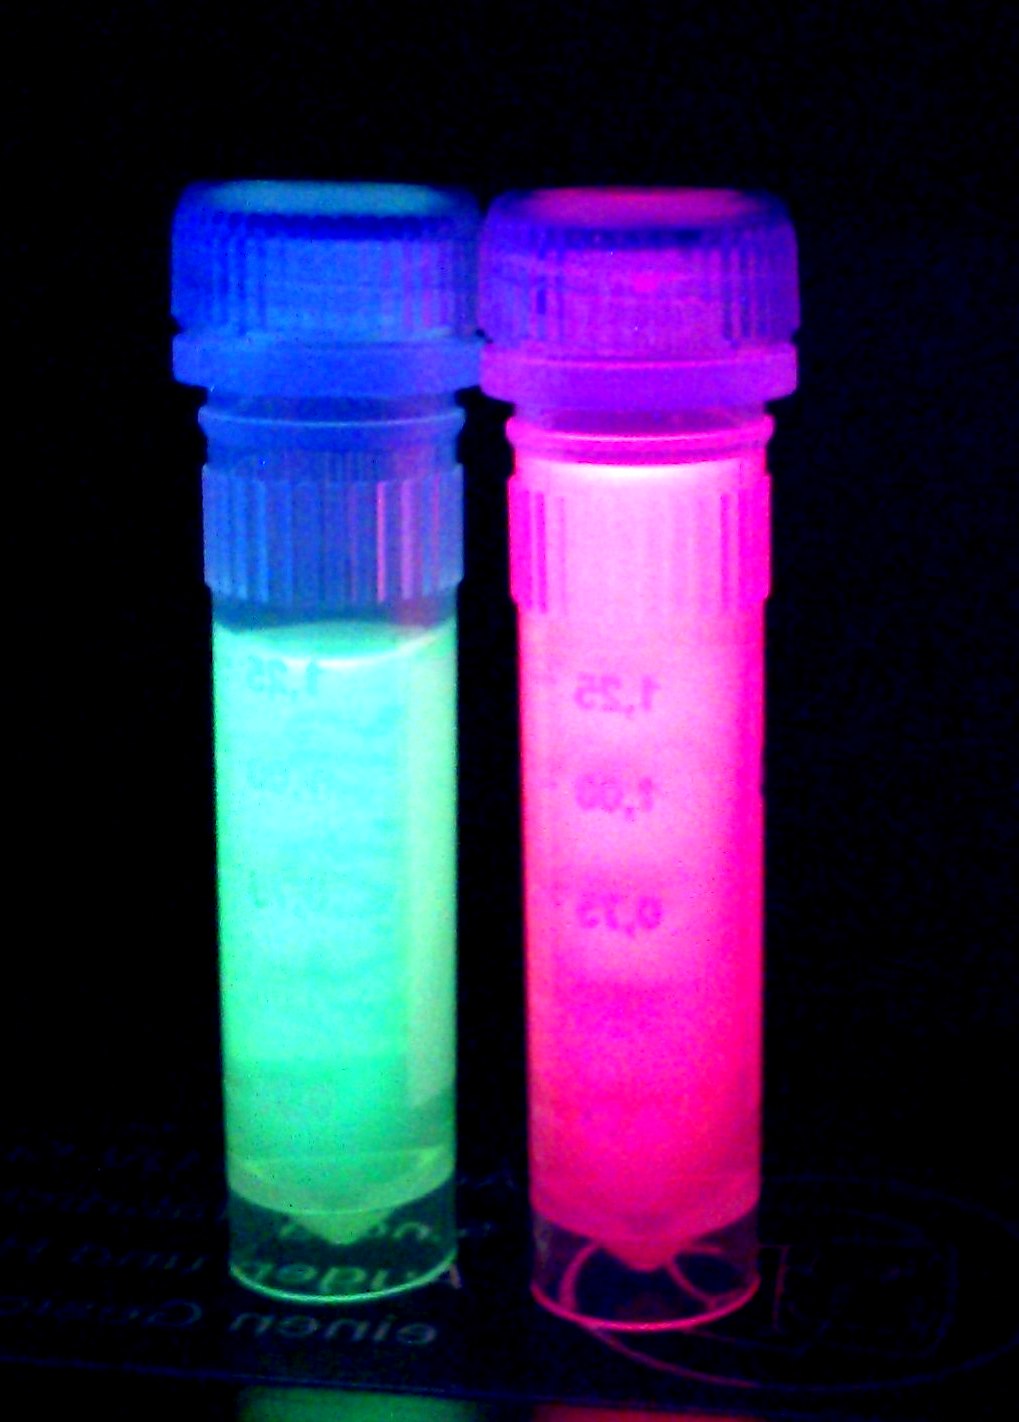
| + | '''iGEM Team Braunschweig 2013:''' Supernatant after cell disruption containing chromoproteins of eforRed and amilGFP (<partinfo>BBa_K1073024</partinfo>). Both chromoproteins fluoresce when excited by UV-light. | ||
| + | |||
| + | |}; | ||
| + | |||
| + | {|width='80%' style='border:1px solid gray' | ||
| + | |- | ||
| + | |width='10%'| | ||
| + | <partinfo>BBa_K1073022 AddReview 5</partinfo> | ||
| + | <I>iGEM Team Pasteur Paris 2019</I> | ||
| + | |width='60%' valign='top'| | ||
| + | To further characterize this biobrick, we decided to focus on the fluorescence expression of eforRed in ''E. coli''. | ||
| + | |||
| + | '''Fluorescence microscopy''' | ||
| + | |||
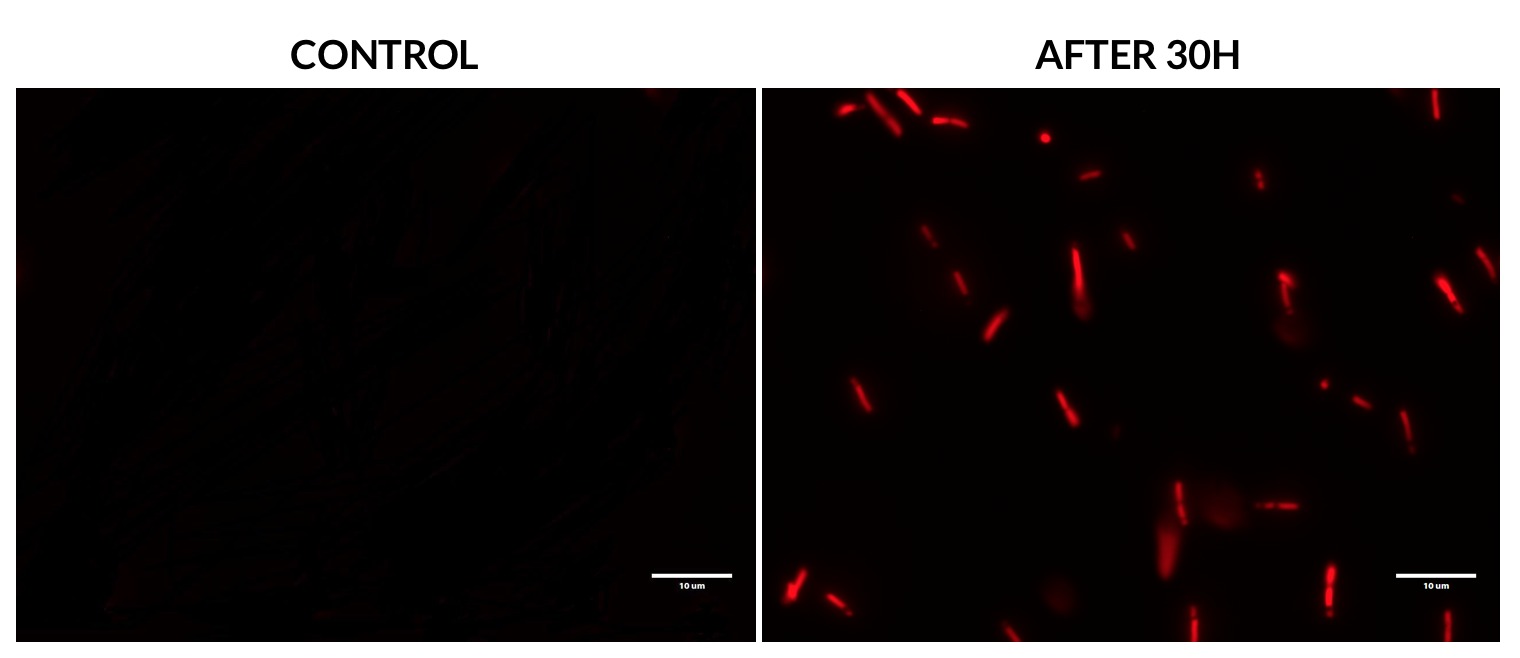
| + | This experiment was performed using an RFP filter. Samples were analyzed after 30 hours of incubation and compared to a non-transformed ''E. coli'' strain. | ||
| + | |||
| + | |||
| + | [[File:T--Pasteur Paris--Fluorescence_microscopy_eforRed_1.png |500px]] | ||
| + | |||
| + | |||
| + | We can clearly see that BBa_K1073022 allows the expression of red fluorescence in ''E. coli'' after several hours of incubation. | ||
| + | |||
| + | However, when we merged brightfield and mRFP images, we observed that the fluorescence is not expressed by all of the bacteria. | ||
| + | |||
| + | |||
| + | [[File:T--Pasteur Paris--Fluorescence_microscopy_eforRed_2.png |700px]] | ||
| + | |||
| + | |||
| + | '''Flow cytometry''' | ||
| + | |||
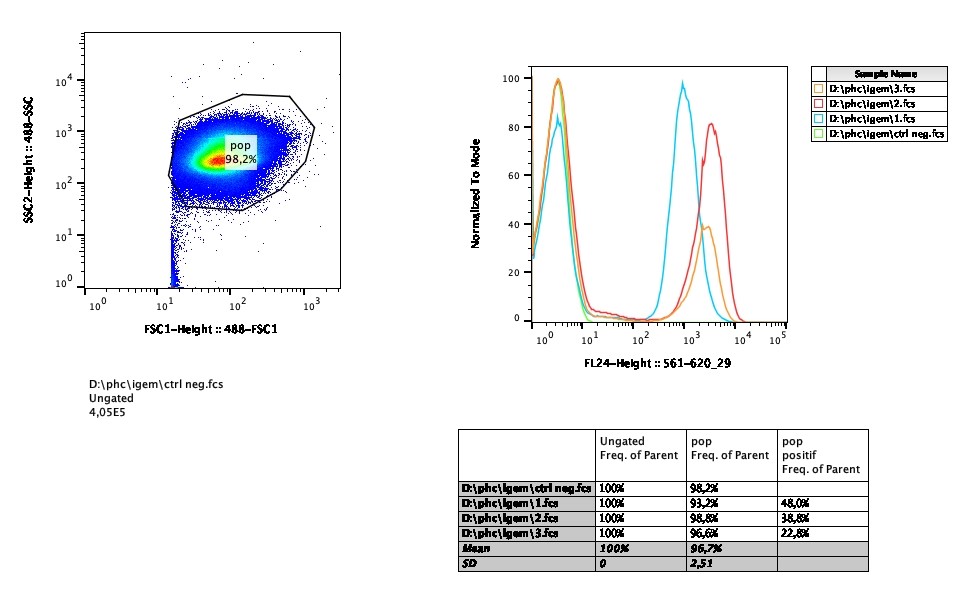
| + | In addition of fluorescence microscopy, we performed flow cytometry in order to test the efficiency of transformation and the stability of the expression of eforRed over time. | ||
| + | |||
| + | |||
| + | [[File:T--Pasteur Paris--Flow_cytometry.jpg |800px]] | ||
| − | |||
| + | Less than 50% of bacteria expressed the red fluorescence after 2 hours of incubation, and this percentage decreases over time. | ||
| − | + | This low percentage of expression could be explained by a poor transformation efficiency. When the selective pressure was removed, the bacteria continued to lose expression of the chromoprotein as wild type bacteria out-competed those with the plasmid. | |
|}; | |}; | ||
<!-- End of the user review template --> | <!-- End of the user review template --> | ||
<!-- DON'T DELETE --><partinfo>BBa_K1073022 EndReviews</partinfo> | <!-- DON'T DELETE --><partinfo>BBa_K1073022 EndReviews</partinfo> | ||
Latest revision as of 00:07, 22 October 2019
This experience page is provided so that any user may enter their experience using this part.
Please enter
how you used this part and how it worked out.
Applications of BBa_K1073022
The iGEM Team Braunschweig 2013 used this device as a reporter to distinguish two different strains when cultivated in a mixed culture.
When eforRed is expressed, the colonies on agar plates as well as the liquid culture exhibit a bright pink color.
Part Sequence Quality
The Tech Museum, May 2014: This part's real sequence may end with two stop codons, TAATAA. This is not listed in the original source part's sequence or in this part's sequence, but sequencing from the registry indicates it may be present. Beware.
User Reviews
UNIQd618c45d4202b38c-partinfo-00000000-QINU
|
•••••
iGEM Team Braunschweig 2013 |
When expressed, the chromoprotein eforRed exhibits a distinct pink color. In order to avoid absorption by the chomoprotein during OD measurement of a bacterial culture, the absorption and emission spectra were measured. An optimal wavelength for spectral optical density measurement was determined to be at 520nm. iGEM Team Braunschweig 2013: Absorption spectrum of chromoprotein eforRed in the wavelength range 400-800 nm. Absorption maximum of eforRed: 534 nm iGEM Team Braunschweig 2013: Emission spectrum of chromoprotein eforRed. The chromoprotein does show significant emission and can be detected by its fluorescence. Emission maximum of eforRed: 605 nm iGEM Team Braunschweig 2013: Supernatant after cell disruption containing chromoproteins of eforRed and amilGFP (BBa_K1073024). Both chromoproteins fluoresce when excited by UV-light. |
|
•••••
iGEM Team Pasteur Paris 2019 |
To further characterize this biobrick, we decided to focus on the fluorescence expression of eforRed in E. coli. Fluorescence microscopy This experiment was performed using an RFP filter. Samples were analyzed after 30 hours of incubation and compared to a non-transformed E. coli strain.
However, when we merged brightfield and mRFP images, we observed that the fluorescence is not expressed by all of the bacteria.
In addition of fluorescence microscopy, we performed flow cytometry in order to test the efficiency of transformation and the stability of the expression of eforRed over time.
This low percentage of expression could be explained by a poor transformation efficiency. When the selective pressure was removed, the bacteria continued to lose expression of the chromoprotein as wild type bacteria out-competed those with the plasmid. |
UNIQd618c45d4202b38c-partinfo-00000004-QINU

