Difference between revisions of "Part:BBa K1119001"
(→Characterization) |
|||
| (7 intermediate revisions by 2 users not shown) | |||
| Line 2: | Line 2: | ||
<partinfo>BBa_K1119001 short</partinfo> | <partinfo>BBa_K1119001 short</partinfo> | ||
| − | Mitochondrial Leader Sequence (MLS) helps direct protein to the mitochondria when this peptide sequence is in front of the N-terminus of the protein of interest. | + | Mitochondrial Leader Sequence (MLS) helps direct protein to the mitochondria when this peptide sequence is in front of the N-terminus of the protein of interest. MLS will be removed upon the peptide’s translocation into the mitochondria, but four additional amino acid residues (Ile-His-Ser-Leu) will be left at the N-terminus of the protein. Under the RFC25 standard, two additional amino residue linker (Ala-Gly) will be left between the MLS remnant and N-terminus of the protein of interest. The CDS of MLS was cloned out from pCMV/myc/mito (Invitrogen, Carlsbard, CA) using PCR. |
<br><br> | <br><br> | ||
This part is in RFC25 standard to facilitate fusing with other CDS. | This part is in RFC25 standard to facilitate fusing with other CDS. | ||
| Line 15: | Line 15: | ||
To provide a positive control, CDS of EGFP from pEGFP-N1 (Clontech) was inserted downstream and in frame with the CDS of the MLS in the commercial plasmid pCMV/myc/mito, (Invitrogen, Carlsbard, CA). A negative control was made by GFP generator that does not contains the CDS of MLS ([[Part:BBa_K1119008|BBa_K1119008]]). | To provide a positive control, CDS of EGFP from pEGFP-N1 (Clontech) was inserted downstream and in frame with the CDS of the MLS in the commercial plasmid pCMV/myc/mito, (Invitrogen, Carlsbard, CA). A negative control was made by GFP generator that does not contains the CDS of MLS ([[Part:BBa_K1119008|BBa_K1119008]]). | ||
| − | + | To quantify the amount of signal overlapped between the GFP signal and the red fluorescence signal from MitoTracker ® Red CMXRos, we adopted the method described by A.P. French et al. in “Colocalization of fluorescent markers in confocal microscope images of plant cells” (French et al., 2008). With the use of Pearson-Spearman correlation colocalization plugin for ImageJ, scatterplots of the green intensities (y-axis) and red intensities (x axis), Pearson's correlation coefficient and Spearman correlation coefficient were generated. | |
| − | [ | + | The [http://2013.igem.org/Team:Hong_Kong_HKUST/characterization/mls detailed protocol] of our characterization can be found in HKUST iGEM 2013 Wiki. |
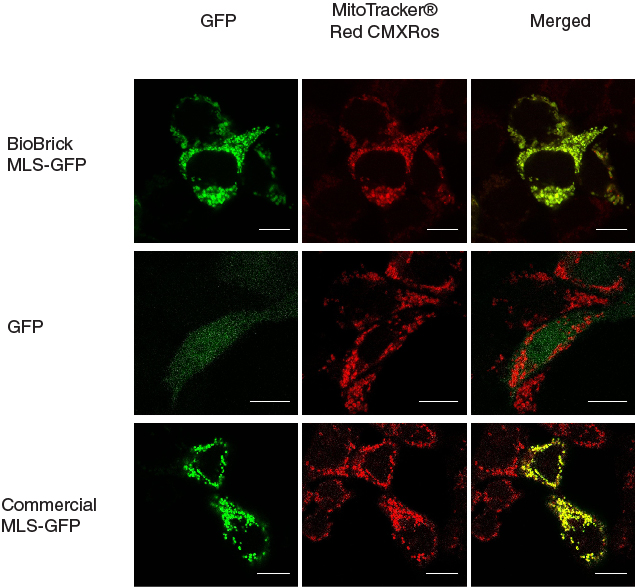
| + | [[File:mlschar_1.jpg|600px|thumb|center|'''Figure 1. MLS directs GFP into mitochondria.''' When MLS is added to the N terminus of GFP, the GFP was directed to the mitochondria in the cells, giving patches of GFP signal that overlapped with the signals from MitoTracker®. When MLS is not added to the GFP, the GFP signal can be seen scattered all around in the cell. Scale bar = 10 microns]] | ||
| + | |||
| + | |||
| + | [[File:scatterplots_mlsquantification.jpg|600px|thumb|center|'''Figure 2. Scatter plots of fluorescence intensities of green (y axis) and red (x axis) from images shown in Figure 1.''' It showed that the BioBrick MLS-GFP and commercial GFP construct had linear relationship of green intensities and red intensities while the GFP generator had no relationship. Pearson's correlation coefficient (rp) and Spearman correlation coefficient (rs) were determined using the Pearson-Spearman correlation colocalization plugin (French et al., 2008) for ImageJ with a threshold of 0 and listed for each image.]] | ||
| + | |||
| + | |||
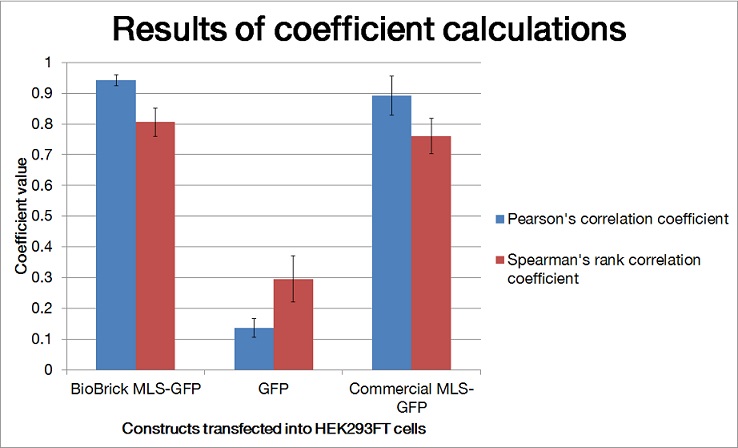
| + | [[File:barchart_mlsquantification.jpg|600px|thumb|center|'''Figure 3. Mean Pearson correlation coefficient(rp) and mean Spearman correlation coefficient(rs) were shown in bar chart.''' Using ImageJ software and plugins, the Pearson correlation coefficient and Spearman correlation coefficient were generated. For every batch of transfected cells, four samples were used for quantification. Experimental BioBrick MLS-GFP and commercial MLS-GFP: Coefficients were close to 1, good colocalization ; GFP: Coefficients were close to 0, poor colocalization. Error bars show standard deviation.]] | ||
<!-- Add more about the biology of this part here | <!-- Add more about the biology of this part here | ||
===Usage and Biology=== | ===Usage and Biology=== | ||
Latest revision as of 20:05, 27 September 2013
Mitochondrial Leader Sequence with RFC25 standard
Mitochondrial Leader Sequence (MLS) helps direct protein to the mitochondria when this peptide sequence is in front of the N-terminus of the protein of interest. MLS will be removed upon the peptide’s translocation into the mitochondria, but four additional amino acid residues (Ile-His-Ser-Leu) will be left at the N-terminus of the protein. Under the RFC25 standard, two additional amino residue linker (Ala-Gly) will be left between the MLS remnant and N-terminus of the protein of interest. The CDS of MLS was cloned out from pCMV/myc/mito (Invitrogen, Carlsbard, CA) using PCR.
This part is in RFC25 standard to facilitate fusing with other CDS.
MLS in RFC10 standard (BBa_K1119000)is submitted as alternative. but cannot be fused directly to other CDS due to limitations in RFC10. Users who obtained the part in RFC10 standard can obtain the part by PCR and fuse to other domains using Splicing by Overlapping PCR.
Characterization
In our characterization, the CDS of MLS was assembled in frame with that of GFP reporter using Freiburg’s RFC25 format(BBa_K648013). The translation unit was driven by CMV promoter (BBa_K1119006) and terminated by hGH polyA signal (BBa_K404108).
The MLS-GFP generator (BBa_K1119009) was then transfected into HEK293FT cells. Mitochondria were stained after transfection and co-localization was determined by area of signal that overlapped.
To provide a positive control, CDS of EGFP from pEGFP-N1 (Clontech) was inserted downstream and in frame with the CDS of the MLS in the commercial plasmid pCMV/myc/mito, (Invitrogen, Carlsbard, CA). A negative control was made by GFP generator that does not contains the CDS of MLS (BBa_K1119008).
To quantify the amount of signal overlapped between the GFP signal and the red fluorescence signal from MitoTracker ® Red CMXRos, we adopted the method described by A.P. French et al. in “Colocalization of fluorescent markers in confocal microscope images of plant cells” (French et al., 2008). With the use of Pearson-Spearman correlation colocalization plugin for ImageJ, scatterplots of the green intensities (y-axis) and red intensities (x axis), Pearson's correlation coefficient and Spearman correlation coefficient were generated.
The [http://2013.igem.org/Team:Hong_Kong_HKUST/characterization/mls detailed protocol] of our characterization can be found in HKUST iGEM 2013 Wiki.


Sequence and Features
- 10COMPATIBLE WITH RFC[10]
- 12COMPATIBLE WITH RFC[12]
- 21COMPATIBLE WITH RFC[21]
- 23COMPATIBLE WITH RFC[23]
- 25COMPATIBLE WITH RFC[25]
- 1000COMPATIBLE WITH RFC[1000]
