Difference between revisions of "Part:BBa K1041000:Experience"
(→Team NRP-UEA_Norwich 2013) |
(→BLAST Analysis) |
||
| (30 intermediate revisions by 2 users not shown) | |||
| Line 1: | Line 1: | ||
| − | |||
__NOTOC__ | __NOTOC__ | ||
This experience page is provided so that any user may enter their experience using this part.<BR>Please enter | This experience page is provided so that any user may enter their experience using this part.<BR>Please enter | ||
| Line 5: | Line 4: | ||
===Team NRP-UEA_Norwich 2013=== | ===Team NRP-UEA_Norwich 2013=== | ||
| − | Team NRP-UEA_Norwich 2013 added an NdeI restriction site at the start of the RFP coding region of [[BBa_J04450]] using mutagenesis. This was to allow either the promoter region or RFP gene to be excised and exchanged for a different promoter or gene and provide restriction sites for further cloning such as part [[Bba_K1041002]]. | + | Team NRP-UEA_Norwich 2013 added an NdeI restriction site at the start of the RFP coding region of [[BBa_J04450]] using mutagenesis. This was to allow either the promoter region or RFP gene to be excised and exchanged for a different promoter or gene and provide restriction sites for further cloning, such as we used to create part [[Bba_K1041002]]. |
| + | |||
| + | ===Characterisation=== | ||
| + | This involved comparisons with the original Bba_J04450 biobrick by performing transformations, restriction digests BLAST analysis and Absorbance Spectroscopy. We also had our biobrick sequenced. | ||
| + | |||
| + | ===Transformation=== | ||
| + | |||
| + | Parts BBa_K1041000 and BBa_J04450 were transformed into Alpha-Select competent ''E. coli'' cells and plated onto LB Agar plates which contained the antibiotic ampicillin. Both plates have colonies that appear red under natural light (''Fig. 1''). Therefore the addition of an NdeI site has not affected the ability for the RFP gene to be transcribed and translated. | ||
| + | |||
| + | [[Image:WP 000051.jpg|thumb|centre|Fig 1: Plates containing (left) BBa_K1041000 and (right) BBa_J04450 visualized under non-UV lightbox]] | ||
| + | |||
| + | ===Restriction Digests=== | ||
| + | Parts Bba_K1041000 and Bba_J04450 were analysed by restriction digests and run on agarose gels. Both biobricks were cut with NdeI (''Fig 2'') and PvuII (''Fig 3''). | ||
| + | Fig 2 shows that part Bba_K1041000 has an NdeI site and part Bba_J04450 does not as when both parts are cut with NdeI only part Bba_K1041000 produces a different size band in the gel compared to uncut DNA. Fig 3 shows that the rest of the DNA sequence in Bba_K1041000 is identical to Bba_J04450 as bands of the same sized are produced when the parts are cut with the enzyme PvuII. | ||
| + | [[image:K1041000 digest 2.JPG|thumb|left|Fig 2: Analysis of Restriction enzyme digest with NdeI. Lanes 1 and 2 contain uncut Bba_K1041000 and Bba_K1041000 digested with NdeI, respectively. Lanes 3 and 4 contain uncut Bba_J04450 and Bba_J04450 digested with NdeI, respectively.]] | ||
| + | [[image:K1041000 digest.JPG|thumb|centre|Fig 3: Analysis of Restriction enzyme digest with PvuII. Lanes 2 and 3 contain uncut BBa_J04450 and BBa_J04450 digested with PvuII, respectively. Lane 5 contains Bba_K1041000 with PvuII.]] | ||
| + | |||
| + | ===Absorbance Spectroscopy=== | ||
| + | An experiment was designed to compare the intensity of red produced by RFP in part Bba_K1041000 to that produced by Bba_J04450. Both parts were transformed into ''E. coli'' cells and spread on agar plates containing Chloramphenicol. A culture from each plate was used to inoculate a 10ml LB solution each and left to incubate overnight at 37 degrees C. After 24 hours of growth both cultures contained a red colour. The cultures were then analysed using Absorbance Spectroscopy (''Fig 4'') to measure the absorbance of the cultures over a range of wavelengths from 450-800 nm. | ||
| + | [[image:Fluorescence 1.JPG|thumb|500px|Fig 4: Absorbance of cultures containing BBa_J04450 and BBa_K1041000 over a range of wavelengths.]] | ||
| + | |||
| + | <br> | ||
| + | <br> | ||
| + | <br> | ||
| + | <br> | ||
| + | <br> | ||
| + | <br> | ||
| + | <br> | ||
| + | <br> | ||
| + | <br> | ||
| + | <br> | ||
| + | <br> | ||
| + | <br> | ||
| + | <br> | ||
| + | <br> | ||
| + | <br> | ||
| + | <br> | ||
| + | <br> | ||
| + | <br> | ||
| + | <br> | ||
| + | |||
| + | ===Sequencing=== | ||
| + | The biobrick was sent off to a company for sequencing (''Fig 4,5,6''). The data we received back showed the DNA was of good quality as strong chromatographic peaks were produced throughout analysis of the sample. | ||
| + | |||
| + | [[image:3a vf2 0-540.JPG|thumb|left|Fig. 4: K1041000 sequencing data part 1]] | ||
| + | [[image:3a vf2 440-860.JPG|thumb|left|Fig. 5: K1041000 sequencing data part 2 ]] | ||
| + | [[image:3a vf2 860-.JPG|thumb|left|Fig. 6: K1041000 sequencing data part 3]] | ||
| + | |||
| + | <br> | ||
| + | <br> | ||
| + | <br> | ||
| + | <br> | ||
| + | <br> | ||
| + | <br> | ||
| + | <br> | ||
| + | <br> | ||
| + | <br> | ||
| + | |||
| + | ===BLAST Analysis=== | ||
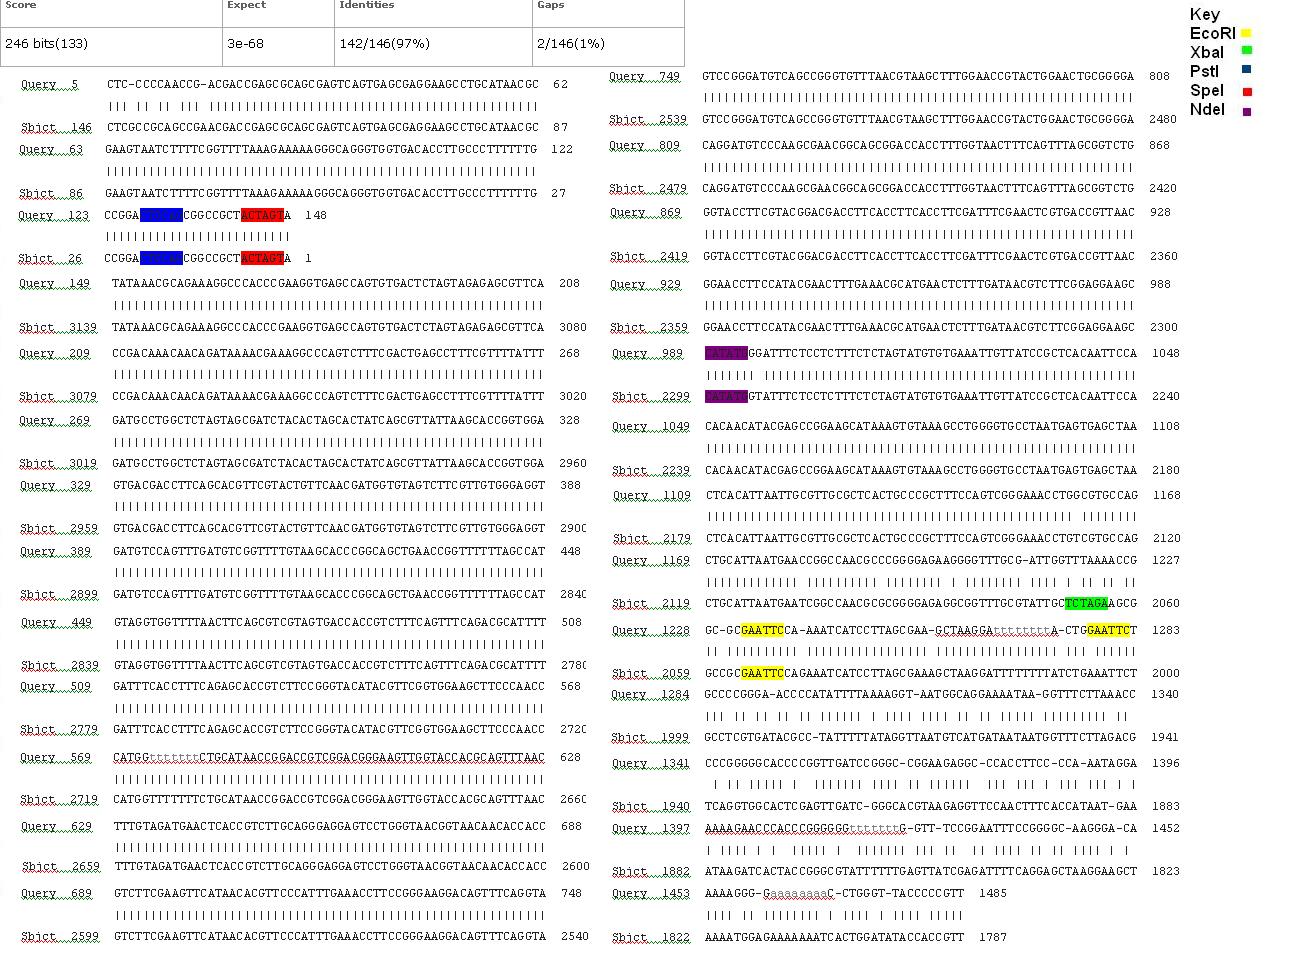
| + | The data we received back from the sequencing company was aligned using BLAST with the expected DNA sequence. The sequencing with both the forward and reverse primers had over 97% matches with the expected DNA sequence (''Figs 7,8''). Deviations from the expected sequence were at the end of the useful sequencing data and combination of both sets of data confirmed a complete match with the expected sequence. | ||
| + | [[image:3a Forward.JPG|thumb|left|Fig. 7: Forward primer K1041000 sequencing data aligned with the expected DNA sequence]] | ||
| + | [[image:3a Reverse.JPG|thumb|left|Fig. 8: Reverse primer K1041000 sequencing data aligned with expected DNA sequence]] | ||
===User Reviews=== | ===User Reviews=== | ||
Latest revision as of 22:10, 4 October 2013
This experience page is provided so that any user may enter their experience using this part.
Please enter
how you used this part and how it worked out.
Team NRP-UEA_Norwich 2013
Team NRP-UEA_Norwich 2013 added an NdeI restriction site at the start of the RFP coding region of BBa_J04450 using mutagenesis. This was to allow either the promoter region or RFP gene to be excised and exchanged for a different promoter or gene and provide restriction sites for further cloning, such as we used to create part Bba_K1041002.
Characterisation
This involved comparisons with the original Bba_J04450 biobrick by performing transformations, restriction digests BLAST analysis and Absorbance Spectroscopy. We also had our biobrick sequenced.
Transformation
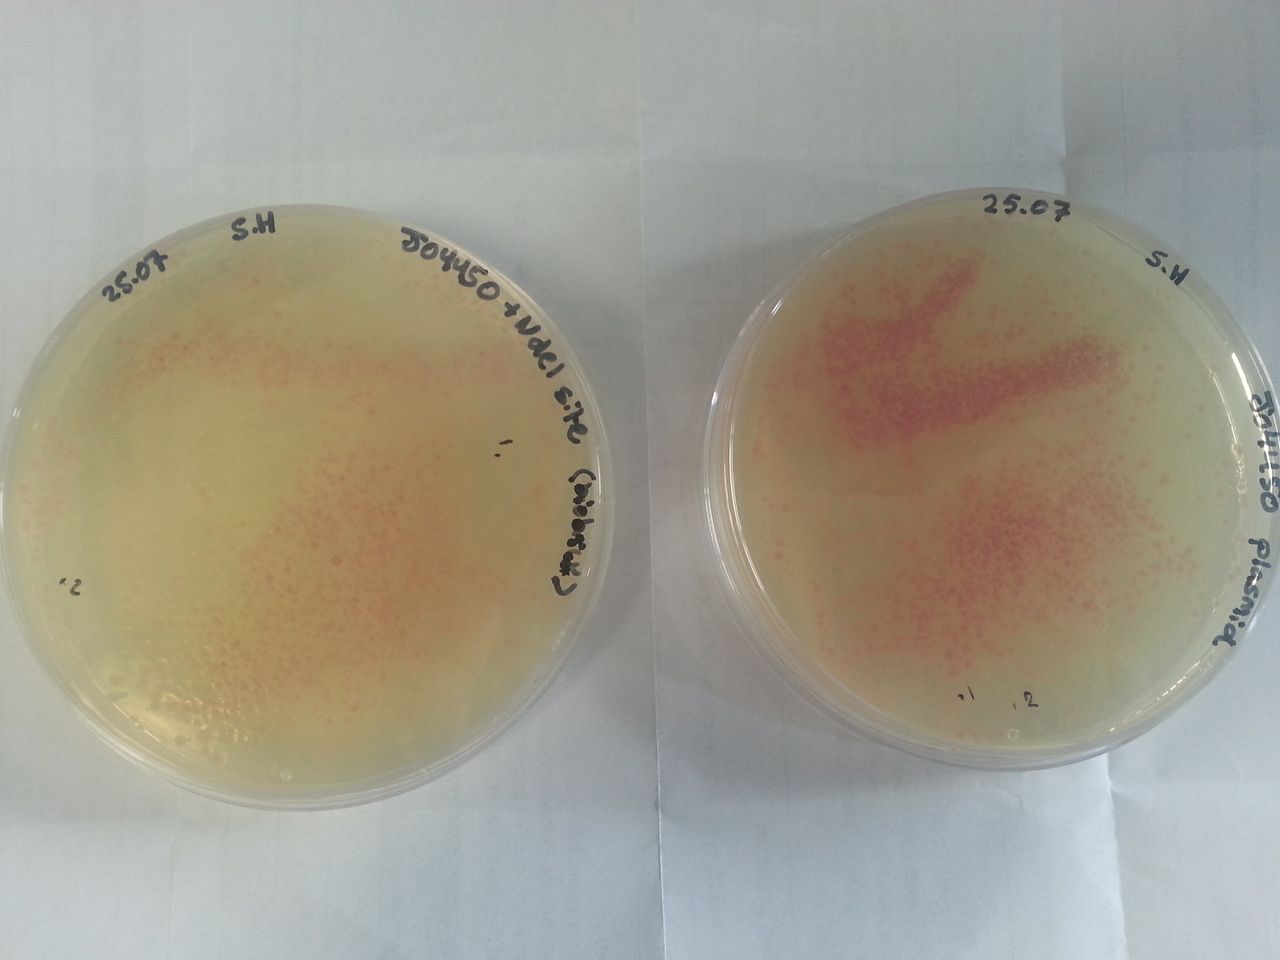
Parts BBa_K1041000 and BBa_J04450 were transformed into Alpha-Select competent E. coli cells and plated onto LB Agar plates which contained the antibiotic ampicillin. Both plates have colonies that appear red under natural light (Fig. 1). Therefore the addition of an NdeI site has not affected the ability for the RFP gene to be transcribed and translated.
Restriction Digests
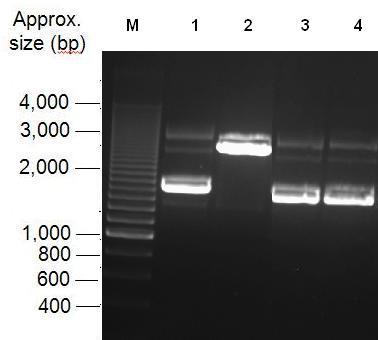
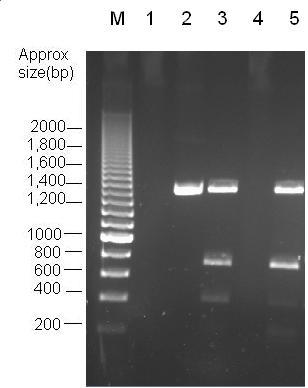
Parts Bba_K1041000 and Bba_J04450 were analysed by restriction digests and run on agarose gels. Both biobricks were cut with NdeI (Fig 2) and PvuII (Fig 3). Fig 2 shows that part Bba_K1041000 has an NdeI site and part Bba_J04450 does not as when both parts are cut with NdeI only part Bba_K1041000 produces a different size band in the gel compared to uncut DNA. Fig 3 shows that the rest of the DNA sequence in Bba_K1041000 is identical to Bba_J04450 as bands of the same sized are produced when the parts are cut with the enzyme PvuII.
Absorbance Spectroscopy
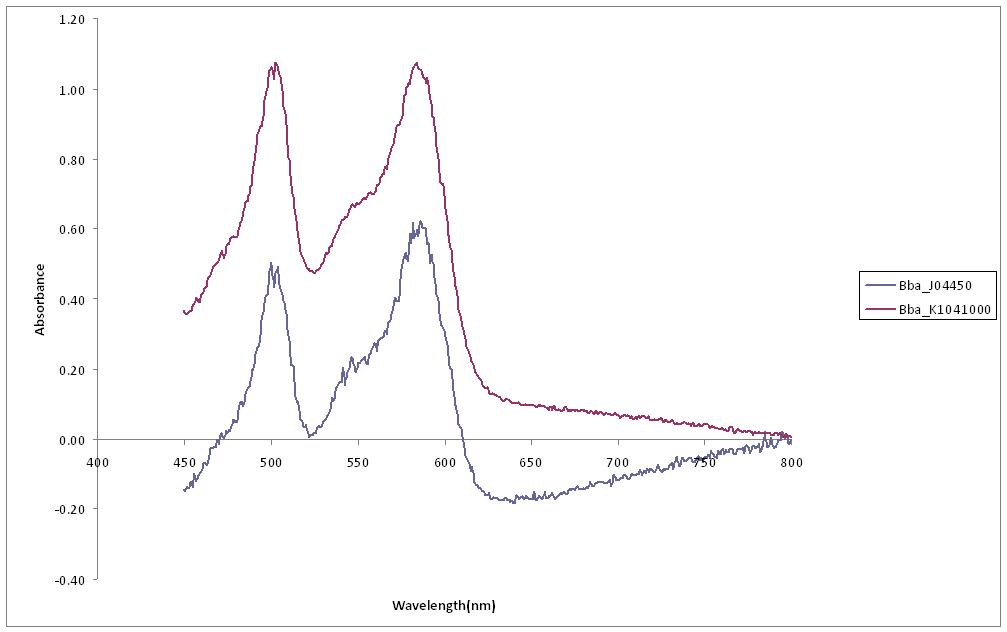
An experiment was designed to compare the intensity of red produced by RFP in part Bba_K1041000 to that produced by Bba_J04450. Both parts were transformed into E. coli cells and spread on agar plates containing Chloramphenicol. A culture from each plate was used to inoculate a 10ml LB solution each and left to incubate overnight at 37 degrees C. After 24 hours of growth both cultures contained a red colour. The cultures were then analysed using Absorbance Spectroscopy (Fig 4) to measure the absorbance of the cultures over a range of wavelengths from 450-800 nm.
Sequencing
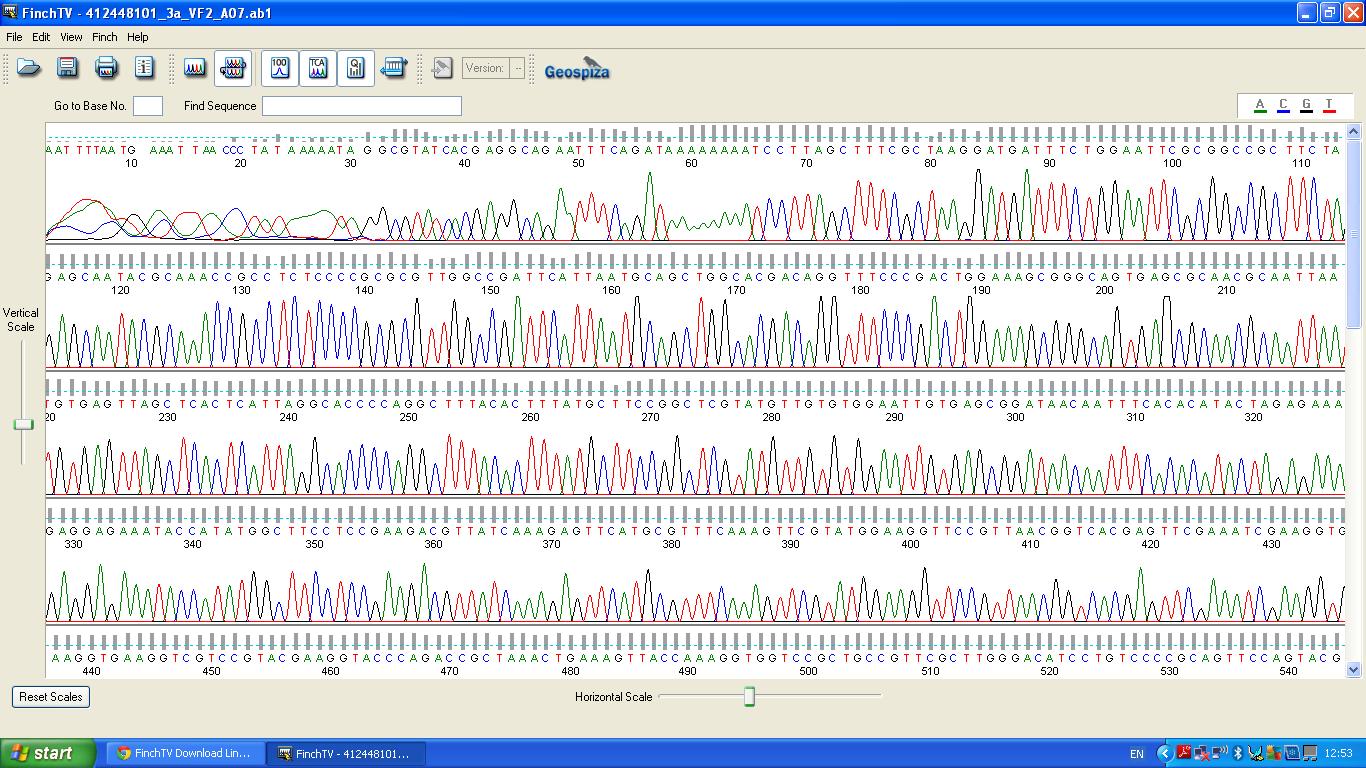
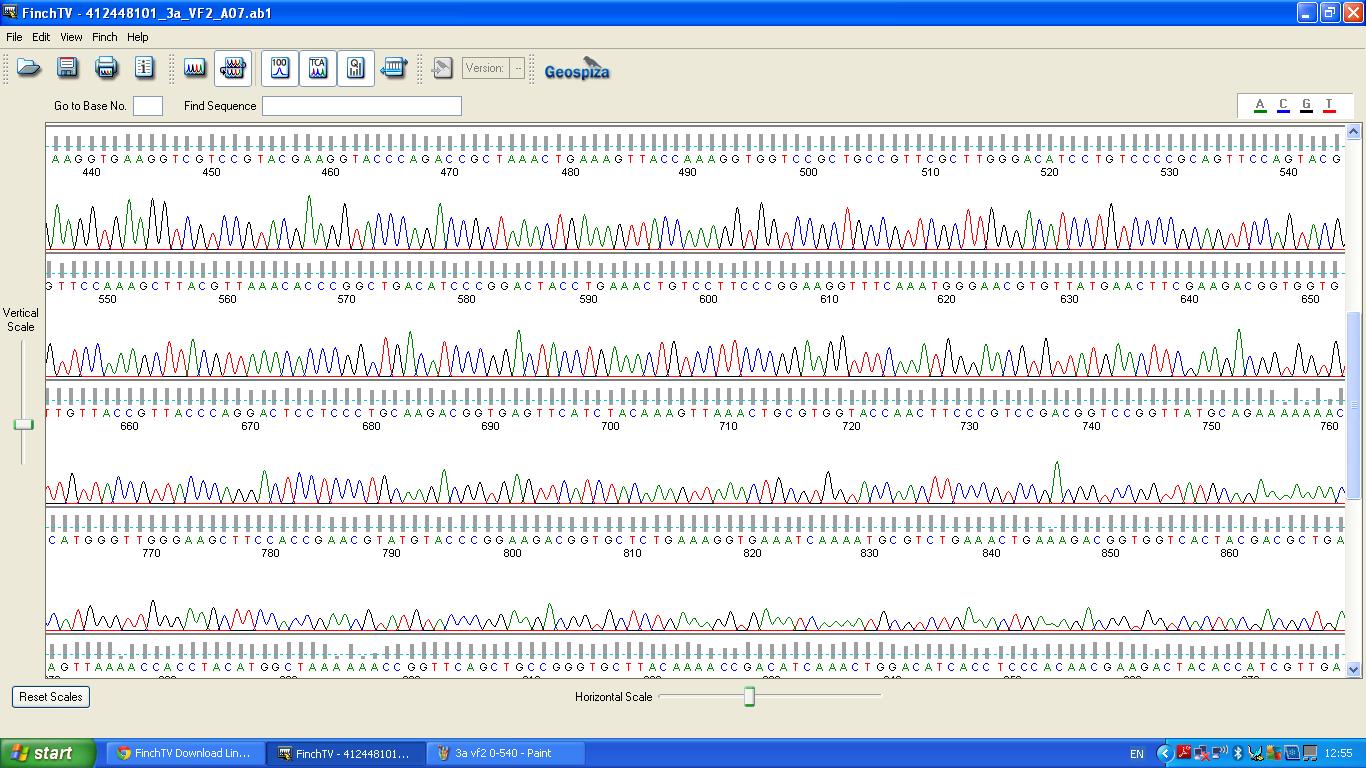
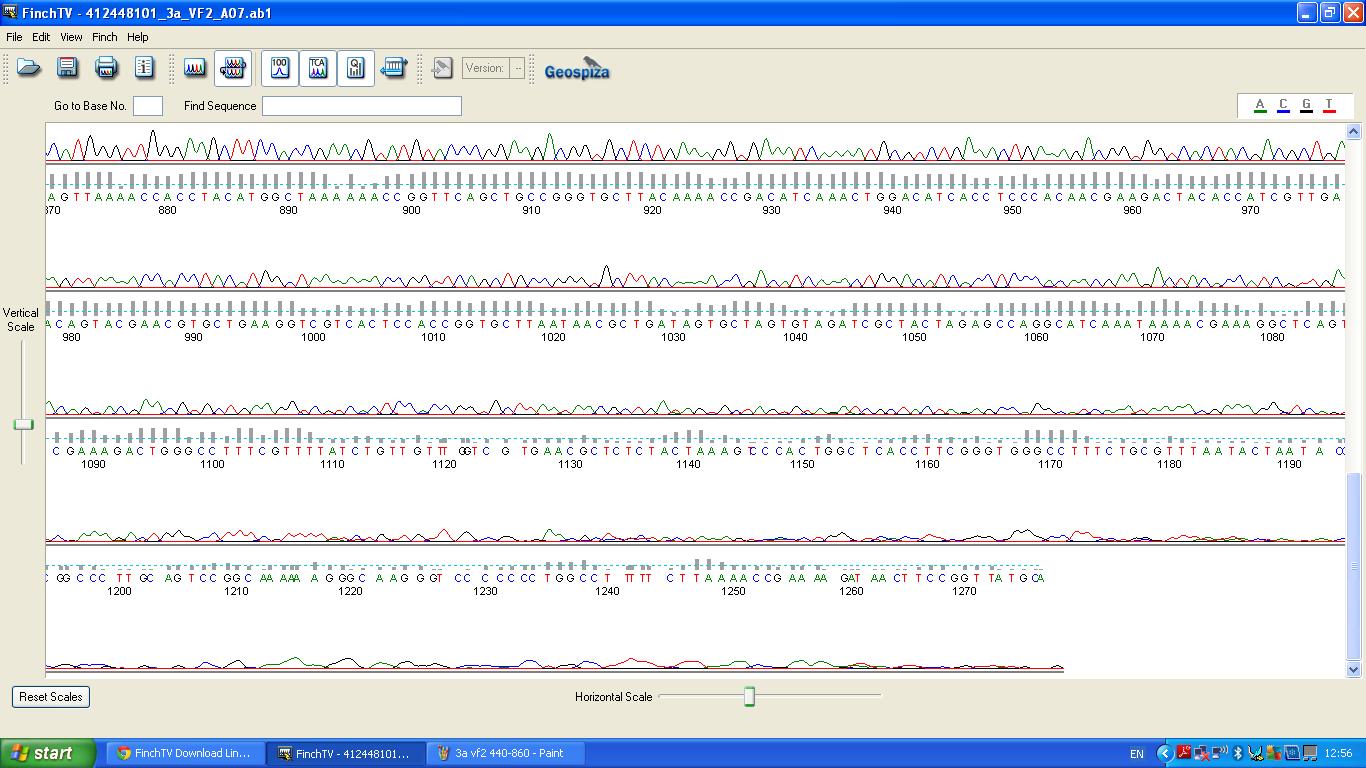
The biobrick was sent off to a company for sequencing (Fig 4,5,6). The data we received back showed the DNA was of good quality as strong chromatographic peaks were produced throughout analysis of the sample.
BLAST Analysis
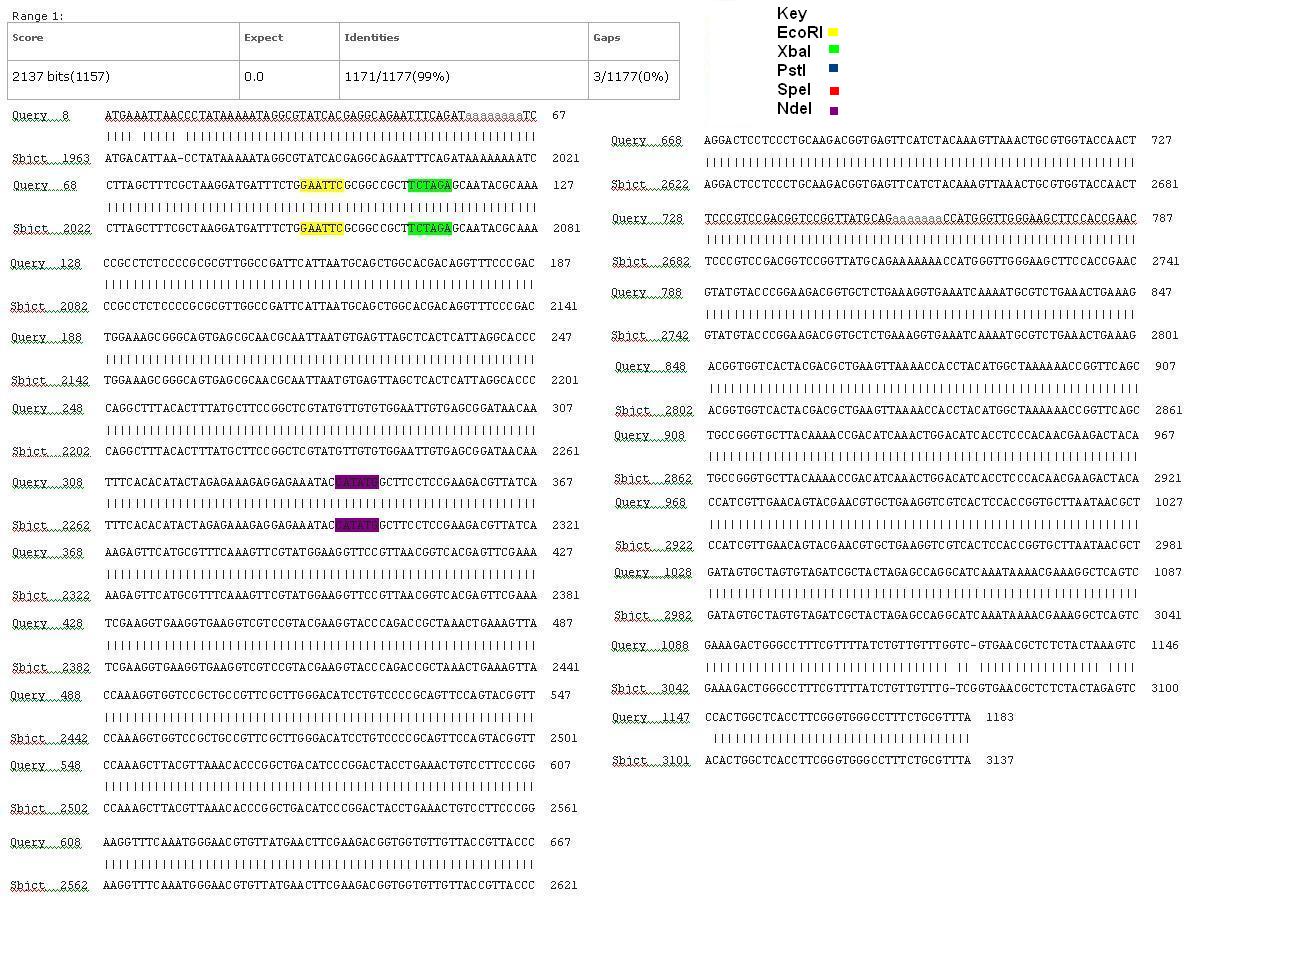
The data we received back from the sequencing company was aligned using BLAST with the expected DNA sequence. The sequencing with both the forward and reverse primers had over 97% matches with the expected DNA sequence (Figs 7,8). Deviations from the expected sequence were at the end of the useful sequencing data and combination of both sets of data confirmed a complete match with the expected sequence.
User Reviews
UNIQ5adbfc98f06434dd-partinfo-00000000-QINU UNIQ5adbfc98f06434dd-partinfo-00000001-QINU

