Difference between revisions of "Part:BBa K643000"
(→Result) |
(→Result) |
||
| (14 intermediate revisions by the same user not shown) | |||
| Line 1: | Line 1: | ||
| − | ==CDS7 cadmium | + | ==CDS7 cadmium sulfide Quantum Dot binding peptide coding sequence== |
The protein coded by this part is claimed to be capable of binding to cadmium chloride and sodium sulfide, forming a cadmium sulfate nanocrystal that exhibits quantum dot behavior. | The protein coded by this part is claimed to be capable of binding to cadmium chloride and sodium sulfide, forming a cadmium sulfate nanocrystal that exhibits quantum dot behavior. | ||
| Line 12: | Line 12: | ||
==Result== | ==Result== | ||
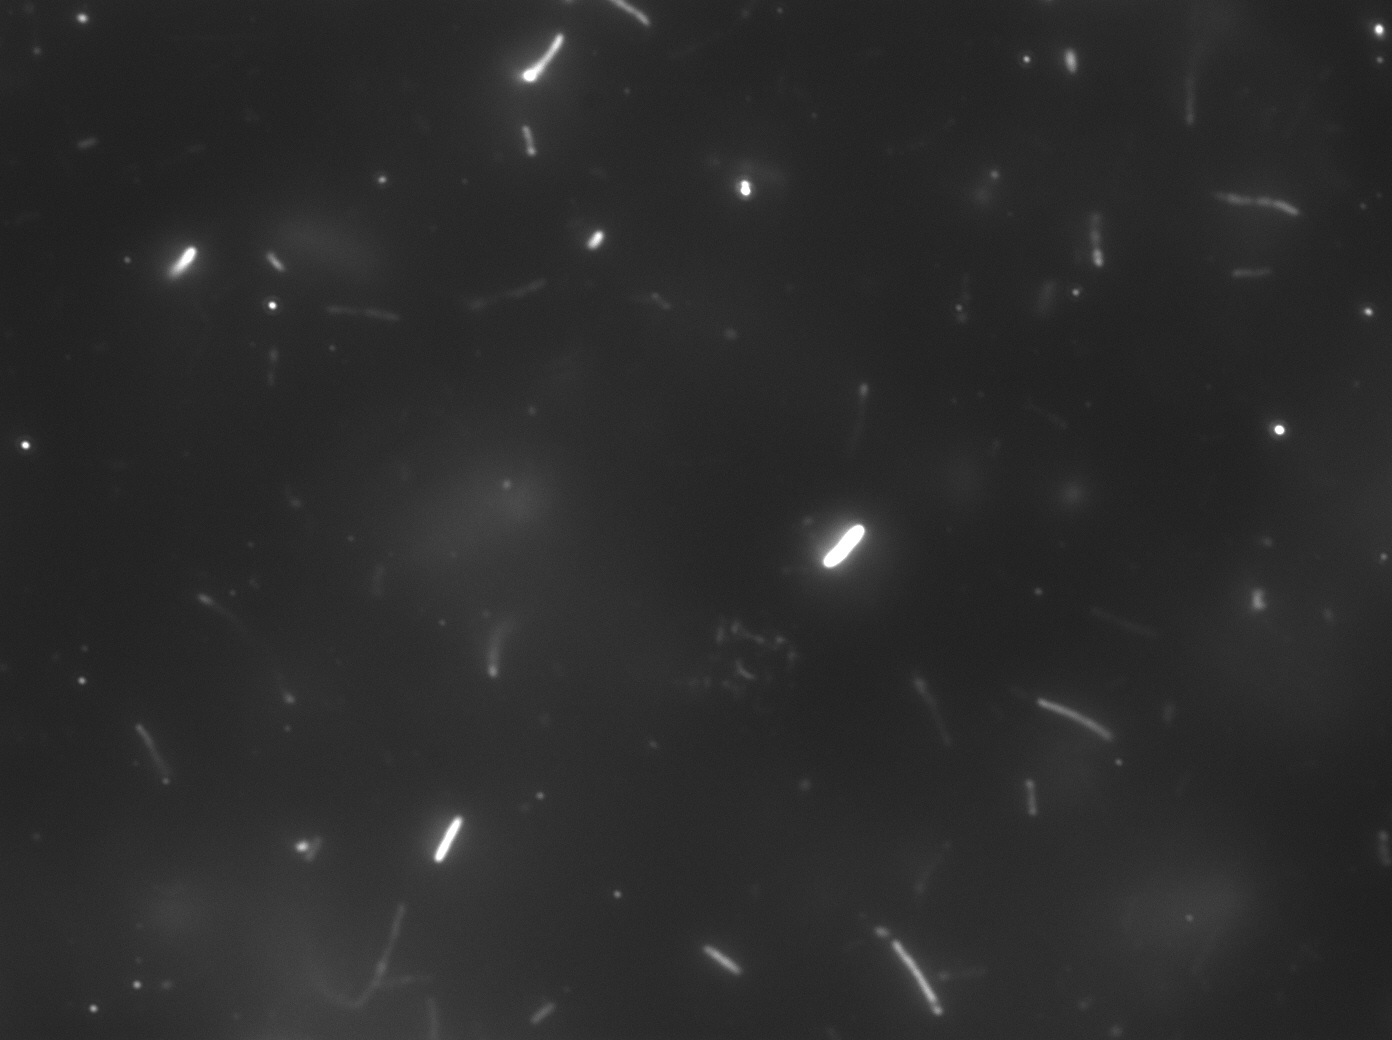
| − | [[Image: | + | [[Image:Captured_40x_2.jpg|thumb|alt=Alt|Image #1, 400x with UV excitation]] |
| − | + | Image #1 is from the first experiment described above, sample was E. coli JM109 cells transformed with pET28b/CDS7 plasmid, induced with IPTG and treated with 10mM CdCl2 and sodium sulfide as described above. Cells exhibit fluorescent behavior from green to red but negative controls (Image #2, JM109 transformed with pET28)exposed to cadmium and sulfide mixture without engineered genetic sequence showed similar, possibly little less, amount of fluorescence by eye. | |
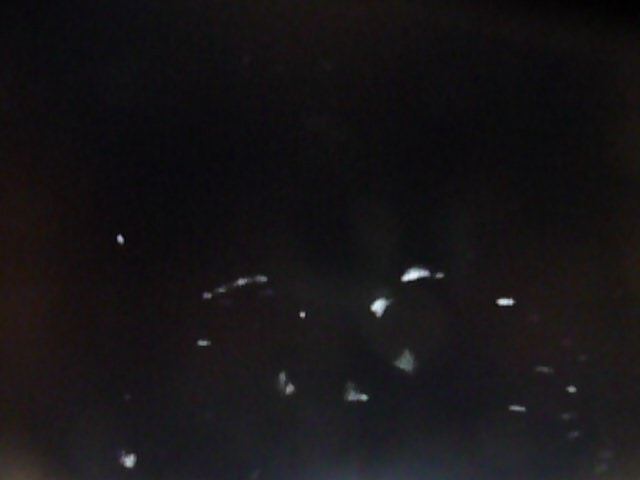
| − | Image 2 | + | [[Image:P1030528.JPG|thumb|alt=Alt|Image #2, 400x with UV excitation]] |
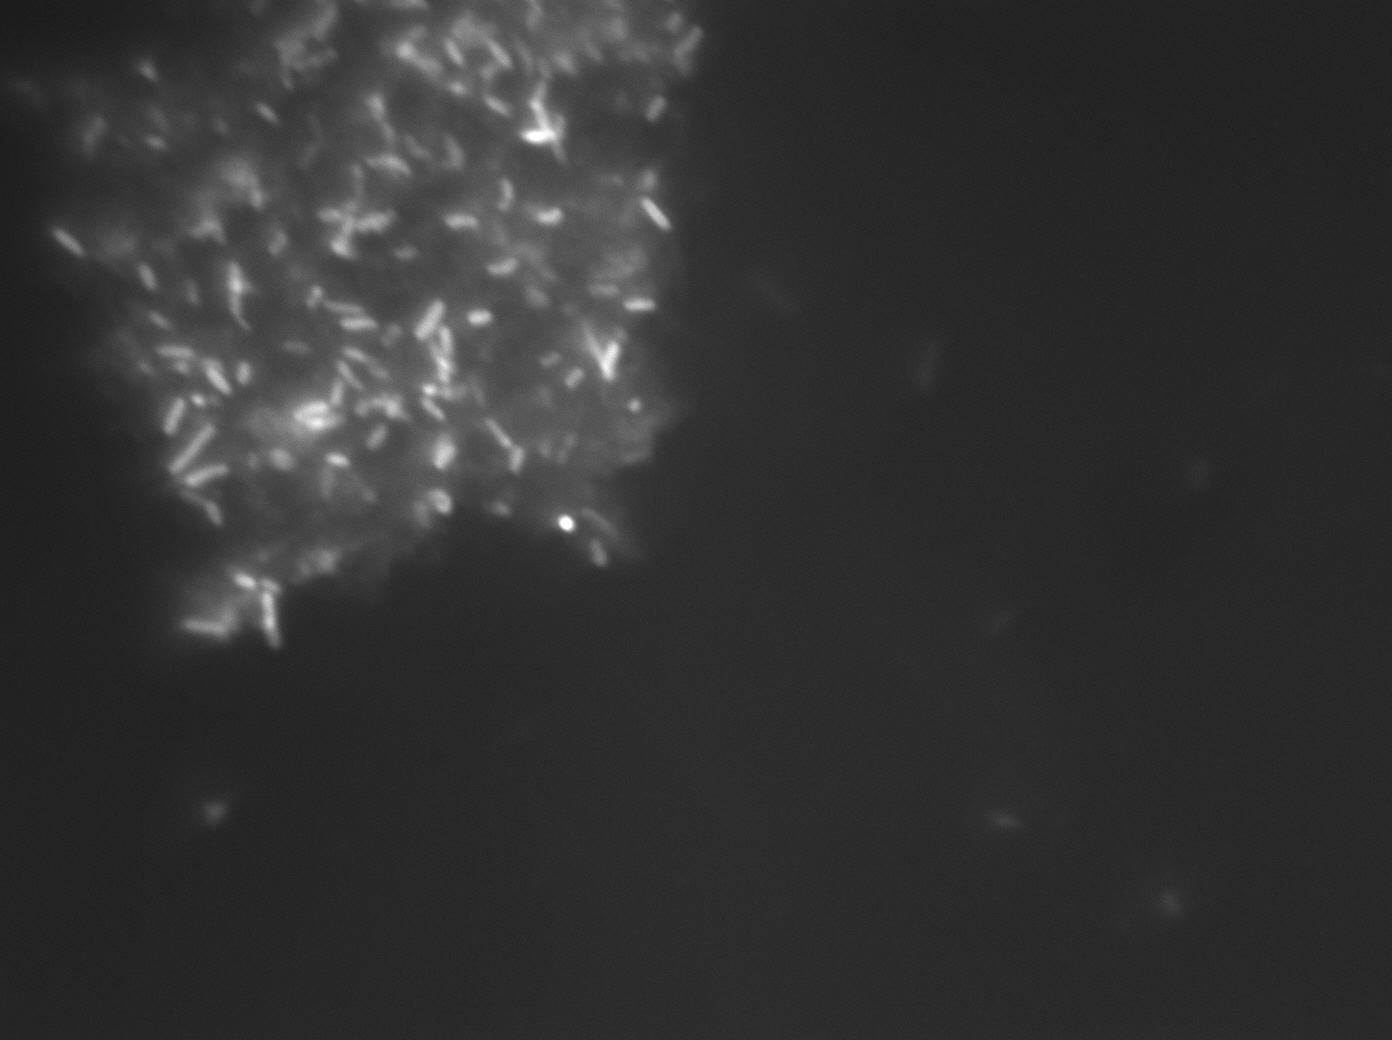
| − | The presence of large clumps of flocculent orange precipitate prevented us from using flow cytometry or fluorimetry to analyze the samples for fluorescence intensity. | + | The presence of large clumps of flocculent orange precipitate prevented us from using flow cytometry or fluorimetry to analyze the samples for fluorescence intensity. Bacteria can be seen embedded withing these crystals (Image #3). |
| + | |||
| + | [[Image:Captured_40x_1.jpg|thumb|alt=Alt|Image #3, 400x with UV excitation]] | ||
| + | |||
| + | Results from the second and third experiments above were similar and are not shown. | ||
| + | |||
| + | In the fourth experiment, samples consisting of JM109 transformed with pET28b/CDS7 plasmid and treated with IPTG, ZnCl2, and sodium sulfide as described above showed a few brightly fluorescent bacteria as shown in the video below (although there were many more present in the same field that were not fluorescent as confirmed by phase contrast of the same field). | ||
| + | |||
| + | Link to video of Zn-treated bacteria = http://www.youtube.com/embed/8pw1BTQ1MJg | ||
| + | |||
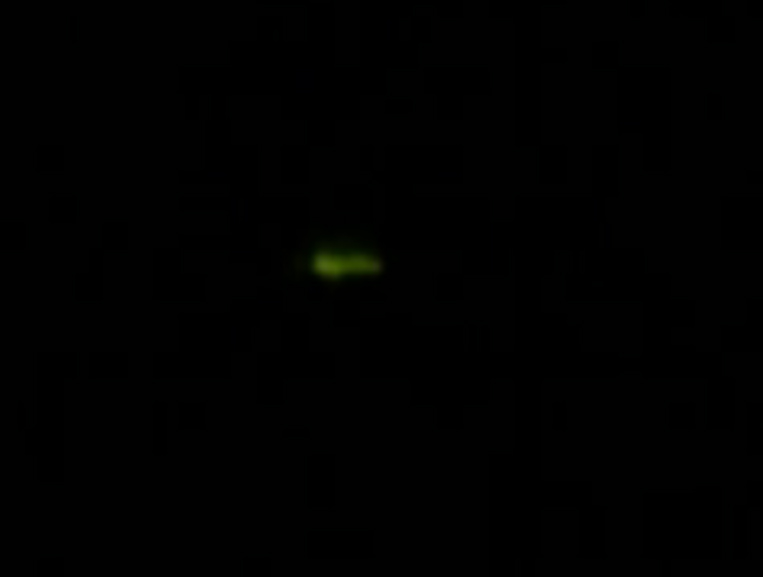
| + | Image #4 is from the same sample as the video. | ||
| + | |||
| + | [[Image:ZnS.jpg|thumb|alt=Alt|Image #4, 400x with UV excitation]] | ||
| + | |||
| + | All other samples (JM109 transformed with pET28b plasmid and treated with IPTG, ZnCl2 and sodium sulfide or JM109 transformed with pET28b/CDS7 plasmid treated as above but with either no IPTG, no CdCl2 or no Na2S) showed no fluorescence. Image #5 is a typical example of control images. It is JM109 transformed with pET28b/CDS7 plasmid treated as above but with no IPTG. | ||
| + | |||
| + | [[Image:P1030537.JPG|thumb|alt=Alt|Image #5, 400x with UV excitation]] | ||
==Future== | ==Future== | ||
| − | We plan to | + | We plan to continue conducting experiments even after the iGEM has ended. We will optimize the quantum dot synthesis protocol and determine conclusively whether or not we are making quality quantum dots. Our goal is to complete at least one of the quantum dot producing systems using these short metal binding peptides for future iGEM projects. |
Latest revision as of 00:31, 10 October 2011
Contents
CDS7 cadmium sulfide Quantum Dot binding peptide coding sequence
The protein coded by this part is claimed to be capable of binding to cadmium chloride and sodium sulfide, forming a cadmium sulfate nanocrystal that exhibits quantum dot behavior.
Experience
Four experiments were run testing the CDS7 biobrick part in the expression plasmid pET28b. The Nco1 and BamH1 sites engineered into the part were used to clone it into the multiple cloning site of pET28b under the control of an IPTG-inducible promotor. A consensus quantum dot synthesis protocol from the literature was used. E. coli strain Jm109 transformed with the pET28b/CDS7 plasmid was tested against JM109 transformed with pET28b with no insert. Cells were inoculated at OD600 = 0.1 and grown to log phase (OD600=0.5) at which time IPTG was added to induce the synthesis of CDS7. In the first experiment CdCl2 was added (either 1mM or 10mM)at the same time as IPTG and the cells incubated with shaking for an additional 3h at 37C. In the second experiment the cells were treated with IPTG as above, abut allowed to incubate for 2h before the CdCl2 was added and then allowed to grow for 3h. In both cases the 3h incubation was followed by removal of the cells from the 37C shaker. Sodium sulfide (Na2S) was added and the cells rotated end-over-end at room temperature for 1.5hr. They were then washed 4x with distilled water and analyzed with fluorescence microscopy. Samples were pET28b/CDS7, pET28b, no cells. All samples were tested +/- CdCl2 and +/- Na2S. In a third experiment, the conditions were the same as the second above except an arm with +/-IPTG was added.
In a fourth experiment ZnCl2 (10mM) was used in place of CdCl2, using the conditions in the third experiment.
Result
Image #1 is from the first experiment described above, sample was E. coli JM109 cells transformed with pET28b/CDS7 plasmid, induced with IPTG and treated with 10mM CdCl2 and sodium sulfide as described above. Cells exhibit fluorescent behavior from green to red but negative controls (Image #2, JM109 transformed with pET28)exposed to cadmium and sulfide mixture without engineered genetic sequence showed similar, possibly little less, amount of fluorescence by eye.
The presence of large clumps of flocculent orange precipitate prevented us from using flow cytometry or fluorimetry to analyze the samples for fluorescence intensity. Bacteria can be seen embedded withing these crystals (Image #3).
Results from the second and third experiments above were similar and are not shown.
In the fourth experiment, samples consisting of JM109 transformed with pET28b/CDS7 plasmid and treated with IPTG, ZnCl2, and sodium sulfide as described above showed a few brightly fluorescent bacteria as shown in the video below (although there were many more present in the same field that were not fluorescent as confirmed by phase contrast of the same field).
Link to video of Zn-treated bacteria = http://www.youtube.com/embed/8pw1BTQ1MJg
Image #4 is from the same sample as the video.
All other samples (JM109 transformed with pET28b plasmid and treated with IPTG, ZnCl2 and sodium sulfide or JM109 transformed with pET28b/CDS7 plasmid treated as above but with either no IPTG, no CdCl2 or no Na2S) showed no fluorescence. Image #5 is a typical example of control images. It is JM109 transformed with pET28b/CDS7 plasmid treated as above but with no IPTG.
Future
We plan to continue conducting experiments even after the iGEM has ended. We will optimize the quantum dot synthesis protocol and determine conclusively whether or not we are making quality quantum dots. Our goal is to complete at least one of the quantum dot producing systems using these short metal binding peptides for future iGEM projects.

