Difference between revisions of "Part:BBa K592100"
| (51 intermediate revisions by 8 users not shown) | |||
| Line 13: | Line 13: | ||
Quantum Yield: 0.63. | Quantum Yield: 0.63. | ||
| − | |||
===Usage and Biology=== | ===Usage and Biology=== | ||
| + | This part is useful as a reporter. | ||
| + | |||
| + | [[Image:A14 UU.JPG|400px]] | ||
| + | [[Image:A16 UU.jpg|400px]] | ||
| + | |||
| + | '''iGEM11_Uppsala-Sweden'''. Fluorescence on UV table. The images above show ''E coli'' constitutively expressing mTagBFP <partinfo>K592100</partinfo> (blue) and YFP <partinfo>K592101</partinfo> (yellow) illuminated on a UV table. | ||
| + | |||
| + | ===References=== | ||
| + | |||
| + | [http://www.ncbi.nlm.nih.gov/pubmed/18940671] Subach, O. M., I. S. Gundorov, et al. (2008). "Conversion of red fluorescent protein into a bright blue probe." Chem Biol 15(10): 1116-24. | ||
| + | |||
| + | |||
| + | ==Jiangsu_High_School 2019’s Characterisation== | ||
| + | |||
| + | ===BBa_K592100 Blue Fluorescent Protein (mTagBFP)=== | ||
| + | <p>The E. coli expressing blue fluorescent protein(mTagBFP) were cultured at 28 °C and the overnight bacterial solution was collected for subsequent measurement.</p> | ||
| + | <p>After ultrasonically disruption of the above bacterial solution ,5 ul of each was added to 4 kinds of 45 ul solution having a pH of 3, 5, 7, and 9, and the fluorescence was measured using varioskan flash of Thermo Scientific. The excitation wavelength/emission wavelength corresponding to each fluorescent protein is: BFP:402/457.</p> | ||
| + | |||
| + | [[Image:FluorescenceofBFP.png|400px|center]] | ||
| + | |||
| + | <p>Figure Fluorescence of BFP under different pH. There were two kinds of BFP expressing in E.coli(BFP) and expressing in E.coli after ultrasonically disruption(BFP-UC). Under the same pH, the fluorescence of BFP was higher than BFP-UC. With increasing of pH( among pH3, pH5, pH7,), the fluorescence of BFP and BFP-UC all raised. When the pH increased from pH7 to pH9, the fluorescence of BFP and BFP-UC were all down. </p> | ||
| + | |||
| + | <p>The results showed that the fluorescent value of each fluorescent protein did not change significantly in acid and alkali circumstance before sonication, but after sonication, each fluorescent protein showed the highest fluorescent value at pH 7, and the fluorescent value decreased as the environment became more acidic.</p> | ||
| + | |||
| + | ==Shanghai_HS_United 2019's characterization== | ||
| + | ===BBa_K592100 Blue Fluorescent Protein (mTagBFP)=== | ||
| + | |||
| + | <p>When the fluorescent protein is excited, an emission spectrum is generated, and the emitted light has different fluorescence intensities at different wavelengths. To explore this, we designed a full-wavelength scan of the blue fluorescent protein.</p> | ||
| + | <p>1. We transformed the plasmid contanining BBa_K592100-mTagBFP into bacterial competent cells separately, plated and cultured overnight at 37 °C. </p> | ||
| + | <p>2. On the evening of the next day, we picked single clone into a tube containing 5 ml LB which is called 0h. At the same time, we also inoculated competent DH5α strain into a tube containing 5 ml LB as a blank control.We culture bacterial cells at 37 ° C, 220 rpm. The sampling time point is 24h.</p> | ||
| + | <p>3. We took 100ul of the bacteria culture and measured the total fluorescence with a Thermo fluorescence microplate reader. We took 200ul of the ten-fold diluted bacterial solution and measured the OD600 with BioTek optical microplate reader. Total fluorescence is divided by OD600 to obtain fluorescence value per OD600.</p> | ||
| + | [[Image:K592100-S1.png|400px|Characterization of popular BioBrick RBSs]] | ||
| + | |||
| + | <strong>Figure1. TagBFP containing strain RFU/OD600 at different emission Wavelength.</strong> | ||
| + | <p>The K592100-mTagBFP RFU/OD600 of the strain varies with the emission wavelength. The overall curve showed a normal distribution and the RFU/OD600 of the strain reachs its maximum at 456 nm. The absorbance value of the blank control DH5α is close to zero.</p> | ||
| + | |||
| + | <p>These results indicate that the absorbance value of the strain is produced by the BFP protein expressed in the cell instead of other factors in the cell, and the BFP protein has the optimal excitation light wavelength 402nm and emission light wavelength 456nm.</p> | ||
| + | |||
| + | ==Toulouse_INSA-UPS’s 2022 Use of a constitutive promoter for the expression of mTagBFP== | ||
| + | ===BBa_K4197014 ihfb800 promoter for an efficient expression of mTagBFP. === | ||
| + | |||
| + | Toulouse_INSA_UPS_2022 contributed to the characterization of this part, the team showed this year that it is functionally | ||
| + | expressed when placed under the control of the constitutive <i>E. coli</i> promoter <i>ihfB800</i> (<partinfo>BBa_K4197014</partinfo>). To do this, the promoter | ||
| + | was placed upon the mTagBFP gene (<partinfo>BBa_K4197013</partinfo>), allowing the production of a bright blue fluorescent protein detectable, by epifluorescence microscopy and FACS. Check part <partinfo>BBa_K4197001</partinfo> of the full construction for more result details. | ||
| + | |||
| + | <html><img src="https://static.igem.wiki/teams/4197/wiki/results/facs/fig-47-bfp-micro.png" width="800px"/></html> | ||
| + | <p>'''Figure 1: Observation on microscope of pET-21 b (+)_OmpA_DARPin strain with ihfb800-BFP (A) pET-21 b (+)_OmpA_DARPin strain with ihfb800-BFP were used a negative control (B).''' | ||
| + | Colonies showed significant blue fluorescence. Observations were made in phase contrast (left of each panel) and at the microscope parameters for BFP (right of each | ||
| + | panel). </p> | ||
| + | <br/> | ||
| + | |||
| + | <html> | ||
| + | <p>More information about the project for which the part was created:<a href="https://2022.igem.wiki/toulouse-insa-ups/index.html"> DAISY (INSA-UPS 2022)</a> </p> | ||
| + | </html> | ||
| + | |||
<!-- --> | <!-- --> | ||
| Line 25: | Line 79: | ||
<partinfo>BBa_K592100 parameters</partinfo> | <partinfo>BBa_K592100 parameters</partinfo> | ||
<!-- --> | <!-- --> | ||
| + | |||
| + | ==NAU-CHINA 2024’s Characterisation== | ||
| + | ===BBa_K592100 Blue Fluorescent Protein (mTagBFP)=== | ||
| + | |||
| + | For the contribution part of our project, we undertook a systematic characterization of the fluorescence signal-to-noise ratio and thermal stability of the blue fluorescent protein mTagBFP. | ||
| + | We inserted the BBa_K592100 part into the pET-29a(+) vector, and then transformed the recombinant plasmid into <i>E. coli</i> DH5α for amplification, followed by transformation into BL21(DE3) for protein expression. We measured the fluorescence signal-to-noise ratio and thermal stability of mTagBFP both in vivo within <i>E. coli</i> and in vitro. | ||
| + | |||
| + | <p><b>1.Gene Activation and Cloning:</b> The BBa_K592100 construct was activated from the distribution kit and the <i>mTagBFP</i> gene was homologously recombined into the pET-29a(+) vector. This recombinant vector was then transformed into <i>E. coli</i> DH5α strain, which were cultured overnight at 37℃. Two single colonies were selected and inoculated into 5 mL of LB medium for 12 hours. Since the plasmid was expressed in the pET-29a(+) vector, both LB agar plates and media were supplemented with Kanamycin at 50 μg/mL.</p> | ||
| + | |||
| + | <html> | ||
| + | <center><img src="https://static.igem.wiki/teams/5398/mtagbfp/pet29a-mtagbfp-map.webp" with="1000" height="" width="300" height=""/></center> | ||
| + | </html> | ||
| + | <p style="text-align: center!important;"><b>Fig. 1 | The Plasmid Map of pET29a(+)-mTagBFP.</b></p> | ||
| + | |||
| + | <p><b>2.Plasmid Extraction and Protein Expression: </b>The plasmid was extracted and transformed into <i>E. coli</i> BL21(DE3). After growing in 5 mL LB medium at 37℃ for 12 hours, the bacteria culture was transferred into 50 mL LB medium until the optical density at 600 nm (OD<sub>600</sub>) reached 0.6-0.8. IPTG was then added to induce protein expression, and the culture was further incubated at 16℃ for 20 hours. Protein extraction was performed using an ultrasonic cell disruptor.</p> | ||
| + | |||
| + | <p><b>3.Preliminary Fluorescence Measurements:</b> A pre-experiment was conducted using a microplate reader to determine the excitation and emission wavelengths of the expressed blue fluorescent protein. | ||
| + | We transferred 200 μL of bacterial culture or protein sample into a black opaque 96-well plate. Using a PerkinElmer Ensight multimode plate reader, we varied the excitation wavelength to measure the fluorescence emission intensity of the samples in order to determine the optimal excitation wavelength for mTagBFP. Subsequently, we fixed the excitation wavelength and measured the emission spectra of the samples.</p> | ||
| + | |||
| + | <p><b>4.Fluorescence Signal-to-Noise Ratio Measurement: </b>Based on preliminary results, we quantified the fluorescence intensity of the blue fluorescent protein mTagBFP expressed in <i>E. coli</i> BL21(DE3) and the background fluorescence of the <i>E. coli</i> BL21(DE3) cells themselves. The signal-to-noise ratio of mTagBFP expressed in <i>E. coli</i> BL21(DE3) were then calculated and evaluated.</p> | ||
| + | |||
| + | <p><b>5.Thermal Stability Characterization:</b> Building on preliminary findings, we used the Thermo Fisher QuantStudio<sup>™</sup> 5 real-time PCR system to assess the thermal stability of mTagBFP both in vivo and in vitro, across a temperature range of 25℃ to 90℃. Fluorescence changes were continuously monitored as the temperature gradually increased during the experiment.</p> | ||
| + | |||
| + | ===<b>Result</b>=== | ||
| + | <p>1.Based on our characterization, the excitation wavelength of mTagBFP blue fluorescent protein in <i>E. coli</i> BL21(DE3) is 401 nm and the emission wavelength is 474 nm. Under excitation at 401 nm, the emission in the 450 nm-480 nm range is significantly more pronounced compared to background fluorescence, making it more easily distinguishable as a reporter signal.</p> | ||
| + | |||
| + | <html> | ||
| + | <center><img src="https://static.igem.wiki/teams/5398/mtagbfp/excitation-emission-wavelength-of-mtagbfp.jpg" with="1000" height="" width="600" height=""/></center> | ||
| + | </html> | ||
| + | <p style="text-align: center!important;"><b>Fig. 2 | Excitation/emission wavelength of mTagBFP in <i>E. coli</i> BL21(DE3).</b></p> | ||
| + | |||
| + | <p>2.<i>In vitro</i>, the excitation wavelength is 403 nm and the emission wavelength is 471 nm. The emission intensity in the 450 nm-485 nm range is relatively high and stable.</p> | ||
| + | |||
| + | <html> | ||
| + | <center><img src="https://static.igem.wiki/teams/5398/mtagbfp/excitation-emission-wavelength-of-mtagbfp-in-vitro.jpg" with="1000" height="" width="600" height=""/></center> | ||
| + | </html> | ||
| + | <p style="text-align: center!important;"><b>Fig. 3 | Excitation/emission wavelength of mTagBFP in vitro.</b></p> | ||
| + | |||
| + | <p>3.Using the fluorescence signal-to-noise ratio formula <b>SNR = <i>I</i><sub>noise</sub> / <i>I</i><sub>signal</sub></b>, we observed that the signal-to-noise ratio of mTagBFP emission in <i>E. coli</i> BL21(DE3) increased steadily under excitation at 401 nm. The SNR rose from approximately 420 nm to 450 nm, reaching a peak of 3.48 at 453 nm. After this point, it slowly declined but remained at a relatively high level.</p> | ||
| + | |||
| + | <html> | ||
| + | <center><img src="https://static.igem.wiki/teams/5398/mtagbfp/mtagbfp-snr-1.webp" with="1000" height="" width="400" height=""/></center> | ||
| + | </html> | ||
| + | <p style="text-align: center!important;"><b>Fig. 4 | The emission signal-to-noise ratio of mTagBFP in <i>E. coli</i> BL21(DE3).</b></p> | ||
| + | |||
| + | <p>4.We assessed the thermal stability of the mTagBFP blue fluorescent protein using the Thermo Fisher QuantStudio<sup>™</sup> 5 real-time PCR system. We added 20 μL of bacterial culture or protein sample to each well of a 96-well plate. The experiment was conducted with a temperature range from 25℃ to 90℃, with a heating rate of 0.5℃/s. The melting curve of mTagBFP was measured to ensure a comprehensive evaluation of the protein's thermal stability. Fluorescence changes were continuously monitored as the temperature gradually increased during the experiment.</p> | ||
| + | |||
| + | <html> | ||
| + | <center><img src="https://static.igem.wiki/teams/5398/mtagbfp/melt-curve-plot.webp" with="1000" height="" width="400" height=""/></center> | ||
| + | </html> | ||
| + | <center> | ||
| + | <b>Fig. 5 | The melting curve mTagBFP <i>in vivo</i>.</b> | ||
| + | </center> | ||
| + | |||
| + | <p>5.By analyzing the melting curve of the mTagBFP blue fluorescent protein, we obtained its average Tm value of <b>57.32℃(±2.68℃)</b>. This Tm value reflects the temperature at which the protein begins to significantly unfold during heating, providing an important indicator of the thermal stability of mTagBFP.</p> | ||
| + | <html> | ||
| + | <br/> | ||
| + | |||
| + | <p>More information about the project for which the part was created:<a href="https://2024.igem.wiki/nau-china/contribution"> SAMUS (NAU-CHINA 2024)</a> </p> | ||
| + | </html> | ||
Latest revision as of 13:32, 2 October 2024
Blue Fluorescent Protein (mTagBFP)
This part codes for the bright blue fluorescent protein mTagBFP. mTagBFP is a monomeric protein with a narrow fluorescence emission spectrum with a maximum at 456 nm. It has a tyrosine-based chromophore, giving it substantially higher brightness, faster chromophore maturation and higher pH stability than blue fluorescent proteins with a histidine in the chromophore. Subach et. al. started with a red fluorescent protein (TagRFP) and converted it to a bright blue monomeric protein. See the article listed in source. The sequence has been codon optimized for expression in E coli by DNA 2.0.
Subach et. al. reported the following data:
Excitation peak: 399 nm. Emission peak: 456 nm. Maturation Half-Time (min): 13. Relative brightness to EBFP2: 1.82. Extinction Coefficient (M-1 cm-1): 52000. Quantum Yield: 0.63.
Usage and Biology
This part is useful as a reporter.
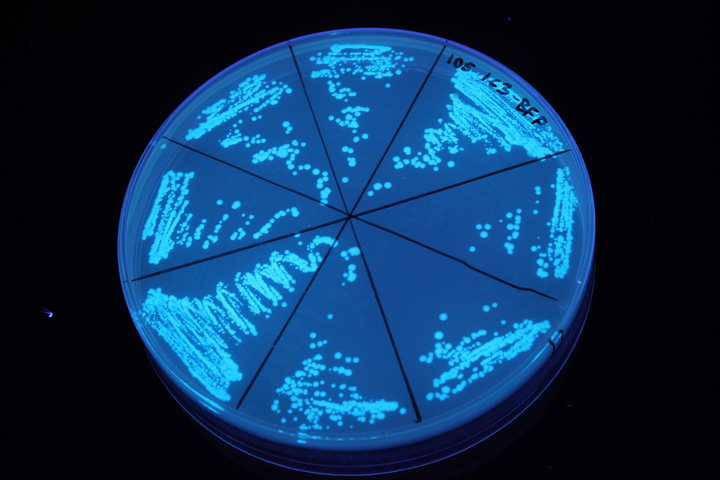
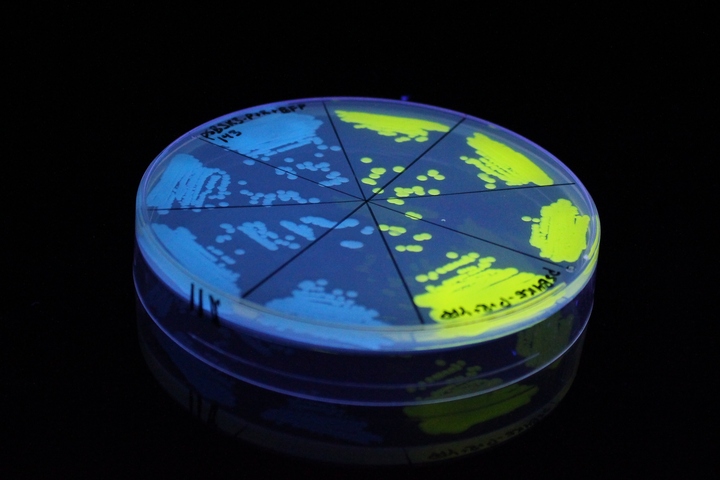
iGEM11_Uppsala-Sweden. Fluorescence on UV table. The images above show E coli constitutively expressing mTagBFP BBa_K592100 (blue) and YFP BBa_K592101 (yellow) illuminated on a UV table.
References
[http://www.ncbi.nlm.nih.gov/pubmed/18940671] Subach, O. M., I. S. Gundorov, et al. (2008). "Conversion of red fluorescent protein into a bright blue probe." Chem Biol 15(10): 1116-24.
Jiangsu_High_School 2019’s Characterisation
BBa_K592100 Blue Fluorescent Protein (mTagBFP)
The E. coli expressing blue fluorescent protein(mTagBFP) were cultured at 28 °C and the overnight bacterial solution was collected for subsequent measurement.
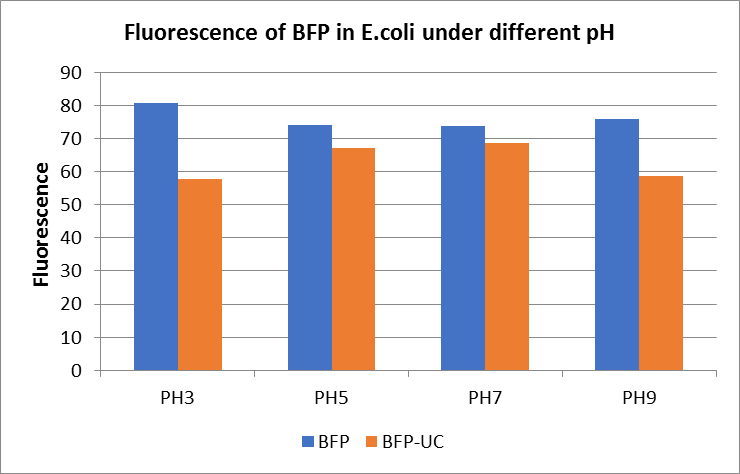
After ultrasonically disruption of the above bacterial solution ,5 ul of each was added to 4 kinds of 45 ul solution having a pH of 3, 5, 7, and 9, and the fluorescence was measured using varioskan flash of Thermo Scientific. The excitation wavelength/emission wavelength corresponding to each fluorescent protein is: BFP:402/457.
Figure Fluorescence of BFP under different pH. There were two kinds of BFP expressing in E.coli(BFP) and expressing in E.coli after ultrasonically disruption(BFP-UC). Under the same pH, the fluorescence of BFP was higher than BFP-UC. With increasing of pH( among pH3, pH5, pH7,), the fluorescence of BFP and BFP-UC all raised. When the pH increased from pH7 to pH9, the fluorescence of BFP and BFP-UC were all down.
The results showed that the fluorescent value of each fluorescent protein did not change significantly in acid and alkali circumstance before sonication, but after sonication, each fluorescent protein showed the highest fluorescent value at pH 7, and the fluorescent value decreased as the environment became more acidic.
Shanghai_HS_United 2019's characterization
BBa_K592100 Blue Fluorescent Protein (mTagBFP)
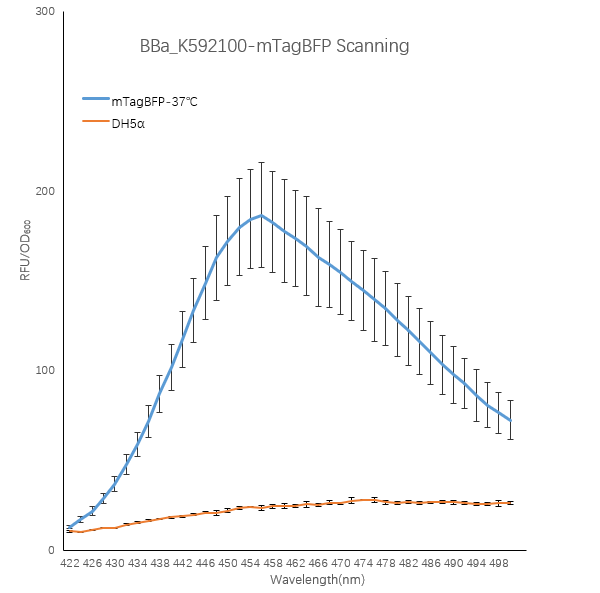
When the fluorescent protein is excited, an emission spectrum is generated, and the emitted light has different fluorescence intensities at different wavelengths. To explore this, we designed a full-wavelength scan of the blue fluorescent protein.
1. We transformed the plasmid contanining BBa_K592100-mTagBFP into bacterial competent cells separately, plated and cultured overnight at 37 °C.
2. On the evening of the next day, we picked single clone into a tube containing 5 ml LB which is called 0h. At the same time, we also inoculated competent DH5α strain into a tube containing 5 ml LB as a blank control.We culture bacterial cells at 37 ° C, 220 rpm. The sampling time point is 24h.
3. We took 100ul of the bacteria culture and measured the total fluorescence with a Thermo fluorescence microplate reader. We took 200ul of the ten-fold diluted bacterial solution and measured the OD600 with BioTek optical microplate reader. Total fluorescence is divided by OD600 to obtain fluorescence value per OD600.
Figure1. TagBFP containing strain RFU/OD600 at different emission Wavelength.
The K592100-mTagBFP RFU/OD600 of the strain varies with the emission wavelength. The overall curve showed a normal distribution and the RFU/OD600 of the strain reachs its maximum at 456 nm. The absorbance value of the blank control DH5α is close to zero.
These results indicate that the absorbance value of the strain is produced by the BFP protein expressed in the cell instead of other factors in the cell, and the BFP protein has the optimal excitation light wavelength 402nm and emission light wavelength 456nm.
Toulouse_INSA-UPS’s 2022 Use of a constitutive promoter for the expression of mTagBFP
BBa_K4197014 ihfb800 promoter for an efficient expression of mTagBFP.
Toulouse_INSA_UPS_2022 contributed to the characterization of this part, the team showed this year that it is functionally expressed when placed under the control of the constitutive E. coli promoter ihfB800 (BBa_K4197014). To do this, the promoter was placed upon the mTagBFP gene (BBa_K4197013), allowing the production of a bright blue fluorescent protein detectable, by epifluorescence microscopy and FACS. Check part BBa_K4197001 of the full construction for more result details.

Figure 1: Observation on microscope of pET-21 b (+)_OmpA_DARPin strain with ihfb800-BFP (A) pET-21 b (+)_OmpA_DARPin strain with ihfb800-BFP were used a negative control (B). Colonies showed significant blue fluorescence. Observations were made in phase contrast (left of each panel) and at the microscope parameters for BFP (right of each panel).
More information about the project for which the part was created: DAISY (INSA-UPS 2022)
Sequence and Features
- 10COMPATIBLE WITH RFC[10]
- 12COMPATIBLE WITH RFC[12]
- 21COMPATIBLE WITH RFC[21]
- 23COMPATIBLE WITH RFC[23]
- 25COMPATIBLE WITH RFC[25]
- 1000COMPATIBLE WITH RFC[1000]
NAU-CHINA 2024’s Characterisation
BBa_K592100 Blue Fluorescent Protein (mTagBFP)
For the contribution part of our project, we undertook a systematic characterization of the fluorescence signal-to-noise ratio and thermal stability of the blue fluorescent protein mTagBFP. We inserted the BBa_K592100 part into the pET-29a(+) vector, and then transformed the recombinant plasmid into E. coli DH5α for amplification, followed by transformation into BL21(DE3) for protein expression. We measured the fluorescence signal-to-noise ratio and thermal stability of mTagBFP both in vivo within E. coli and in vitro.
1.Gene Activation and Cloning: The BBa_K592100 construct was activated from the distribution kit and the mTagBFP gene was homologously recombined into the pET-29a(+) vector. This recombinant vector was then transformed into E. coli DH5α strain, which were cultured overnight at 37℃. Two single colonies were selected and inoculated into 5 mL of LB medium for 12 hours. Since the plasmid was expressed in the pET-29a(+) vector, both LB agar plates and media were supplemented with Kanamycin at 50 μg/mL.

Fig. 1 | The Plasmid Map of pET29a(+)-mTagBFP.
2.Plasmid Extraction and Protein Expression: The plasmid was extracted and transformed into E. coli BL21(DE3). After growing in 5 mL LB medium at 37℃ for 12 hours, the bacteria culture was transferred into 50 mL LB medium until the optical density at 600 nm (OD600) reached 0.6-0.8. IPTG was then added to induce protein expression, and the culture was further incubated at 16℃ for 20 hours. Protein extraction was performed using an ultrasonic cell disruptor.
3.Preliminary Fluorescence Measurements: A pre-experiment was conducted using a microplate reader to determine the excitation and emission wavelengths of the expressed blue fluorescent protein. We transferred 200 μL of bacterial culture or protein sample into a black opaque 96-well plate. Using a PerkinElmer Ensight multimode plate reader, we varied the excitation wavelength to measure the fluorescence emission intensity of the samples in order to determine the optimal excitation wavelength for mTagBFP. Subsequently, we fixed the excitation wavelength and measured the emission spectra of the samples.
4.Fluorescence Signal-to-Noise Ratio Measurement: Based on preliminary results, we quantified the fluorescence intensity of the blue fluorescent protein mTagBFP expressed in E. coli BL21(DE3) and the background fluorescence of the E. coli BL21(DE3) cells themselves. The signal-to-noise ratio of mTagBFP expressed in E. coli BL21(DE3) were then calculated and evaluated.
5.Thermal Stability Characterization: Building on preliminary findings, we used the Thermo Fisher QuantStudio™ 5 real-time PCR system to assess the thermal stability of mTagBFP both in vivo and in vitro, across a temperature range of 25℃ to 90℃. Fluorescence changes were continuously monitored as the temperature gradually increased during the experiment.
Result
1.Based on our characterization, the excitation wavelength of mTagBFP blue fluorescent protein in E. coli BL21(DE3) is 401 nm and the emission wavelength is 474 nm. Under excitation at 401 nm, the emission in the 450 nm-480 nm range is significantly more pronounced compared to background fluorescence, making it more easily distinguishable as a reporter signal.

Fig. 2 | Excitation/emission wavelength of mTagBFP in E. coli BL21(DE3).
2.In vitro, the excitation wavelength is 403 nm and the emission wavelength is 471 nm. The emission intensity in the 450 nm-485 nm range is relatively high and stable.

Fig. 3 | Excitation/emission wavelength of mTagBFP in vitro.
3.Using the fluorescence signal-to-noise ratio formula SNR = Inoise / Isignal, we observed that the signal-to-noise ratio of mTagBFP emission in E. coli BL21(DE3) increased steadily under excitation at 401 nm. The SNR rose from approximately 420 nm to 450 nm, reaching a peak of 3.48 at 453 nm. After this point, it slowly declined but remained at a relatively high level.

Fig. 4 | The emission signal-to-noise ratio of mTagBFP in E. coli BL21(DE3).
4.We assessed the thermal stability of the mTagBFP blue fluorescent protein using the Thermo Fisher QuantStudio™ 5 real-time PCR system. We added 20 μL of bacterial culture or protein sample to each well of a 96-well plate. The experiment was conducted with a temperature range from 25℃ to 90℃, with a heating rate of 0.5℃/s. The melting curve of mTagBFP was measured to ensure a comprehensive evaluation of the protein's thermal stability. Fluorescence changes were continuously monitored as the temperature gradually increased during the experiment.

Fig. 5 | The melting curve mTagBFP in vivo.
5.By analyzing the melting curve of the mTagBFP blue fluorescent protein, we obtained its average Tm value of 57.32℃(±2.68℃). This Tm value reflects the temperature at which the protein begins to significantly unfold during heating, providing an important indicator of the thermal stability of mTagBFP.
More information about the project for which the part was created: SAMUS (NAU-CHINA 2024)


