Difference between revisions of "Part:BBa K4275041"
(→Characterisation of the Cellulosome Complex) |
|||
| Line 16: | Line 16: | ||
<h3>Mini-scaffold construction of cellulosome</h3> | <h3>Mini-scaffold construction of cellulosome</h3> | ||
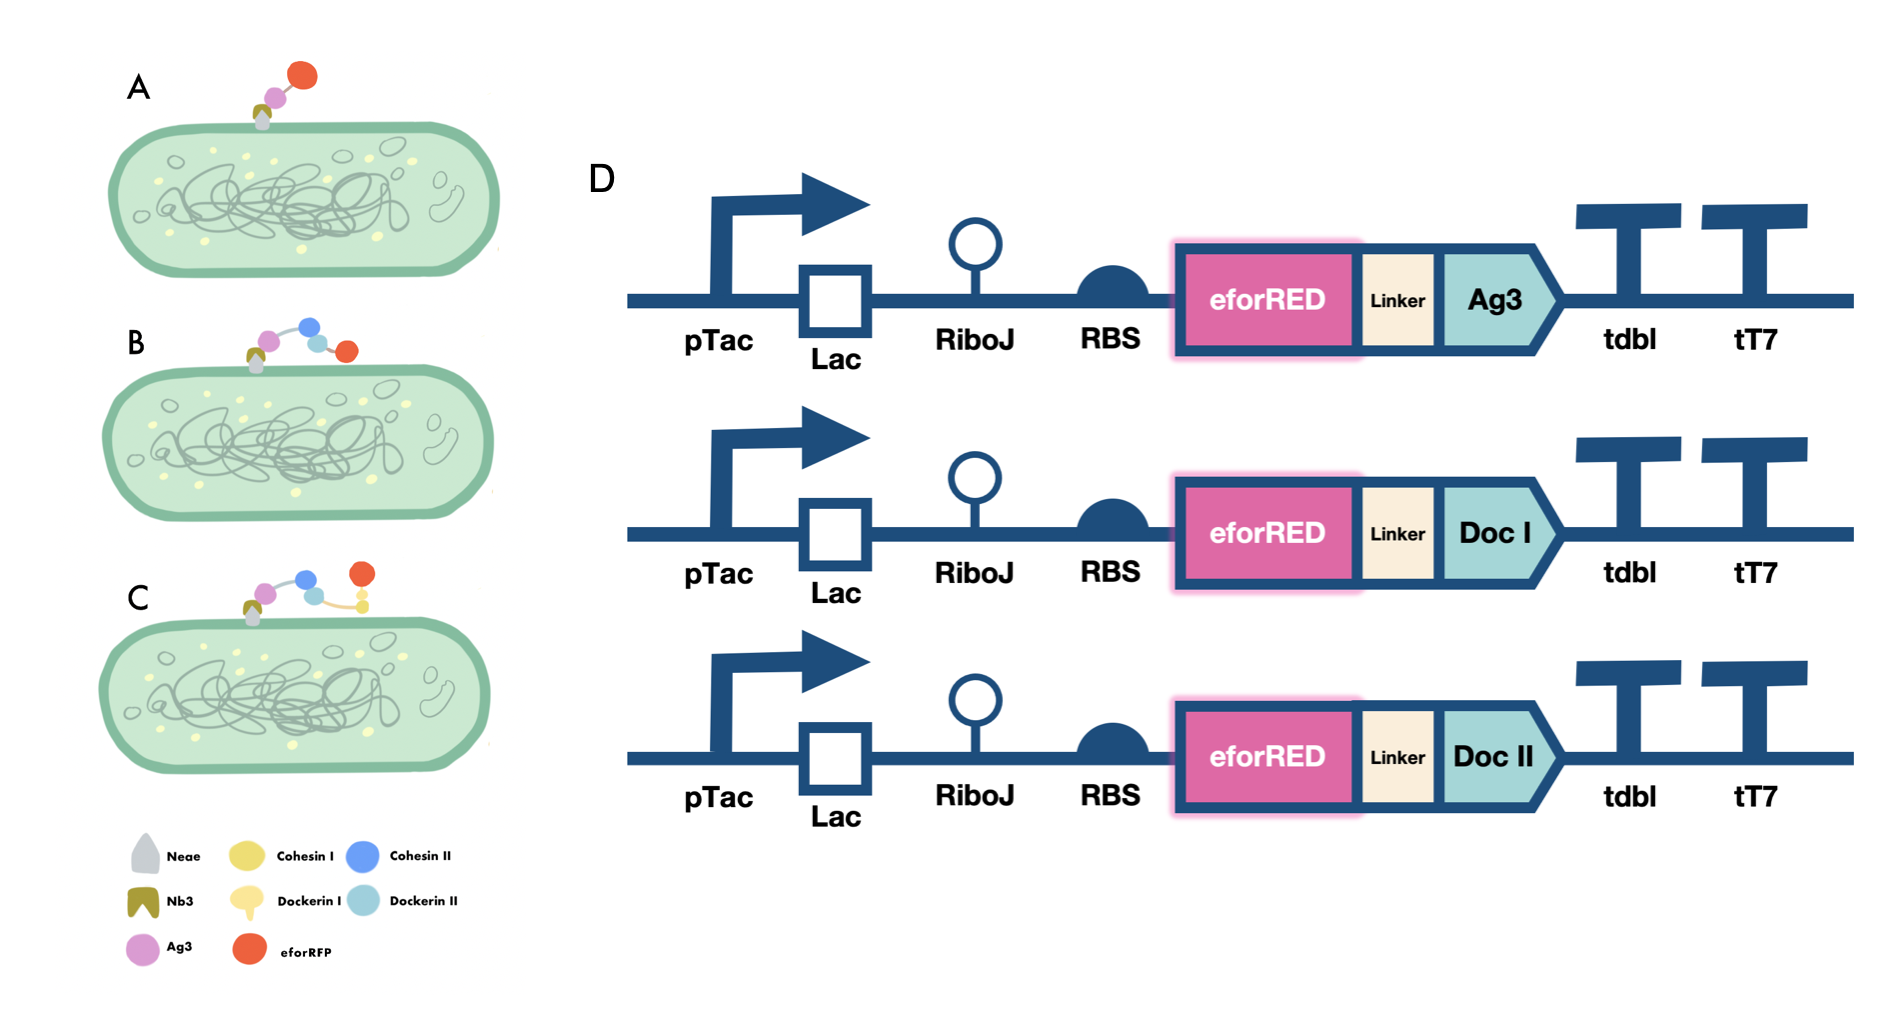
| − | We constructed E.coli expression vectors for the mini-scaffold protein subunits. The scaffoldin components of the wild-type cellulosome subunits are large protein scaffolds that would bring a massive protein burden to the bacterial host secreting them. We modified the coding sequences for the wild-type cellulosome protein scaffold, as shown in (Fig. | + | We constructed E.coli expression vectors for the mini-scaffold protein subunits. The scaffoldin components of the wild-type cellulosome subunits are large protein scaffolds that would bring a massive protein burden to the bacterial host secreting them. We modified the coding sequences for the wild-type cellulosome protein scaffold, as shown in (Fig.2A and Fig.2B) |
| − | The mini-scaffolds were successfully expressed by our host, verified by the SDS-PAGE analysis shown in (Fig. | + | The mini-scaffolds were successfully expressed by our host, verified by the SDS-PAGE analysis shown in (Fig.2C and Fig.2D) |
| − | [[Image:GreatBay SCIE--Part Fig4.png|thumbnail|850px|center|'''Figure | + | [[Image:GreatBay SCIE--Part Fig4.png|thumbnail|850px|center|'''Figure 1:''' |
Mini-scaffold expression in E. coli BL21. (A) Construction of primary scaffold CipA1B2C (i.e., 1 CBM3 and 2 type I cohesin) (B) Construction of anchorage scaffold OlpB-Ag3 (i.e., 3 type II cohesin). (C) SDS-page analysis for CipA1B2C. (D) SDS-page analysis for OlpB-Ag3.]] | Mini-scaffold expression in E. coli BL21. (A) Construction of primary scaffold CipA1B2C (i.e., 1 CBM3 and 2 type I cohesin) (B) Construction of anchorage scaffold OlpB-Ag3 (i.e., 3 type II cohesin). (C) SDS-page analysis for CipA1B2C. (D) SDS-page analysis for OlpB-Ag3.]] | ||
| Line 28: | Line 28: | ||
<h3>Functionality testing of our mini-scaffold</h3> | <h3>Functionality testing of our mini-scaffold</h3> | ||
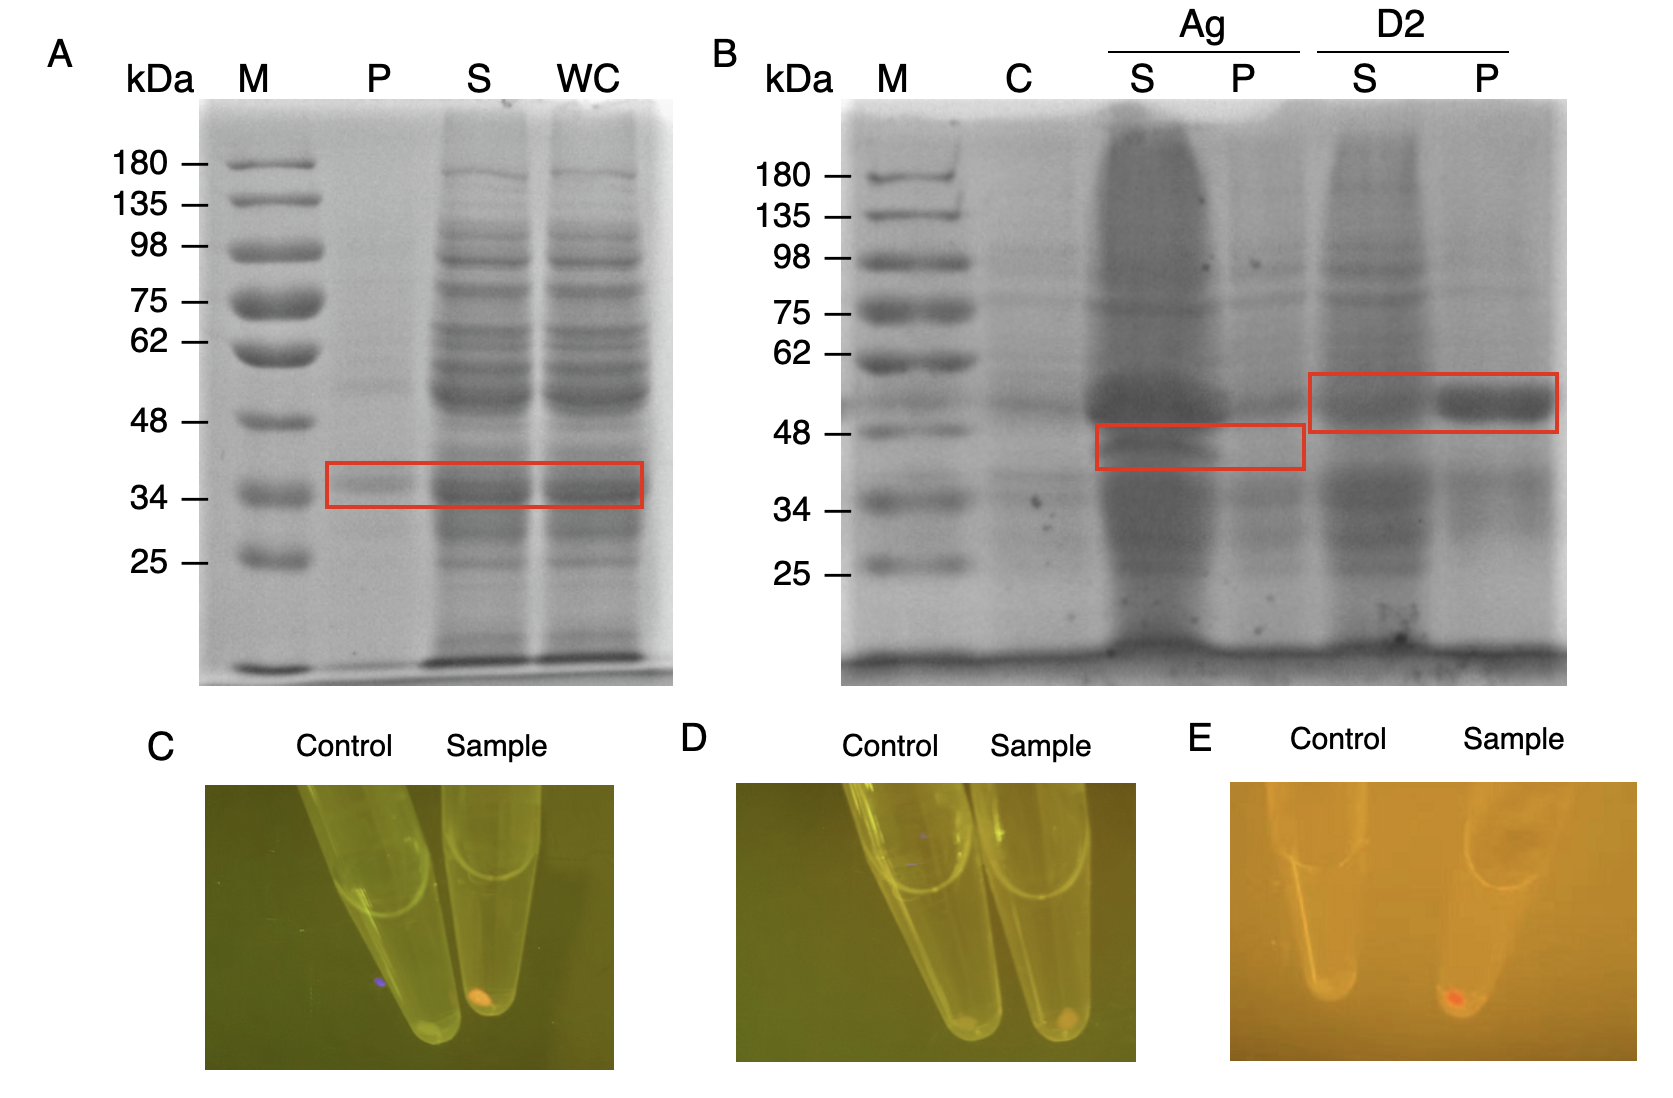
| − | In order to verify the three levels of protein-protein interaction that assembles our cellulosome complex, Ag3-eforRED, DocI-eforRED, and DocII-eforRED vectors were constructed and cultured for IPTG-inducible expression (Fig. | + | In order to verify the three levels of protein-protein interaction that assembles our cellulosome complex, Ag3-eforRED, DocI-eforRED, and DocII-eforRED vectors were constructed and cultured for IPTG-inducible expression (Fig. 2D). SDS-page analysis was performed with lysed cells and all three targeted proteins were identified in both whole cell and supernatant (Fig. 3A and 3B). |
| − | The nanobody-antigen interaction was verified by mixing intact E. coli cells displaying Neae-Nb3 with the supernatant of Ag3-eforRED (Fig. | + | The nanobody-antigen interaction was verified by mixing intact E. coli cells displaying Neae-Nb3 with the supernatant of Ag3-eforRED (Fig. 2A). Red fluorescent characteristics were observed in the pellets after resuspending the centrifuged mixture, which is absent in the control group that only contains Neae-Nb3 (Fig. 3C). |
| − | After that, the type II cohesin-dockerin interaction was tested using the mixture of Neae-Nb3, OlpB-Ag3, and the type II dokerin fused with eforRED (Fig. | + | After that, the type II cohesin-dockerin interaction was tested using the mixture of Neae-Nb3, OlpB-Ag3, and the type II dokerin fused with eforRED (Fig. 2B). A negative control lacking OlpB-Ag3 was set up for result comparison. Centrifugation was used to remove supernatant and the red fluorescence was only identified in pellets of the sample group, confirming the type II cohesin-dockerin interaction (Fig. 3D). |
| − | Finally, the association between type I cohesin and type I dockerin was validated using the mixture of Neae-Nb3, OlpB-Ag3, CipA1B2C, and DocI-eforRED (Fig. | + | Finally, the association between type I cohesin and type I dockerin was validated using the mixture of Neae-Nb3, OlpB-Ag3, CipA1B2C, and DocI-eforRED (Fig. 2C), red fluorescence was detected in the resuspended mixture while it was not observed in the control group lacking the primary scaffold CipA1B2C (Fig. 3E), verifying the type I cohesin-dockerin interaction. |
| − | [[Image:GreatBay SCIE--Part Fig5.png|thumbnail|850px|center|'''Figure | + | [[Image:GreatBay SCIE--Part Fig5.png|thumbnail|850px|center|'''Figure 2:''' |
Cellulosomal scaffold system construct (A) Antigen-nanobody interaction between Nb3 and Ag3 domain reported by the ligated eforRed fluorescent domain (B) Type II cohesin -dockerin interaction between a fixed secondary scaffoldin component and a type II dockerin domain reported by the ligated eforRed fluorescent domain (C) Type I cohesin-dockerin interaction between a fixed primary scaffoldin component and a type I dockerin domain reported by a ligated eforRed fluorescent domain (D) Genetic circuit designed for the expression of ligated form of Ag3, type I dockerin and type II dockerin domains fused with an eforRed fluorescent domain at N terminus for reporting the adhesive functions of those domains.]] | Cellulosomal scaffold system construct (A) Antigen-nanobody interaction between Nb3 and Ag3 domain reported by the ligated eforRed fluorescent domain (B) Type II cohesin -dockerin interaction between a fixed secondary scaffoldin component and a type II dockerin domain reported by the ligated eforRed fluorescent domain (C) Type I cohesin-dockerin interaction between a fixed primary scaffoldin component and a type I dockerin domain reported by a ligated eforRed fluorescent domain (D) Genetic circuit designed for the expression of ligated form of Ag3, type I dockerin and type II dockerin domains fused with an eforRed fluorescent domain at N terminus for reporting the adhesive functions of those domains.]] | ||
| Line 44: | Line 44: | ||
| − | [[Image:GreatBay SCIE--Part Fig6.png|thumbnail|850px|center|'''Figure | + | [[Image:GreatBay SCIE--Part Fig6.png|thumbnail|850px|center|'''Figure 3:''' |
Production and assay of the scaffold proteins (A) SDS-PAGE analysis for the presence of type I dockerin-eforRed (B) SDS-PAGE analysis of Ag3-eforRed and type II dockerin -eforRed containing type II dockerin fused with an eforRed domain (C) The fluorescence indication for antigen-nanobody interaction for E. Coli surface display with an Ag3 control group and a sample group (D) The fluorescence indication for type II cohesin-dockerin interactions with a type II dockerin control group and a sample group (E ) The fluorescence indication for type I cohesin-dockerin interactions with a type I dockerin control group and a sample group.]] | Production and assay of the scaffold proteins (A) SDS-PAGE analysis for the presence of type I dockerin-eforRed (B) SDS-PAGE analysis of Ag3-eforRed and type II dockerin -eforRed containing type II dockerin fused with an eforRed domain (C) The fluorescence indication for antigen-nanobody interaction for E. Coli surface display with an Ag3 control group and a sample group (D) The fluorescence indication for type II cohesin-dockerin interactions with a type II dockerin control group and a sample group (E ) The fluorescence indication for type I cohesin-dockerin interactions with a type I dockerin control group and a sample group.]] | ||
| Line 58: | Line 58: | ||
| − | [[Image:GreatBay SCIE--Part Fig9.png|thumbnail|850px|center|'''Figure | + | [[Image:GreatBay SCIE--Part Fig9.png|thumbnail|850px|center|'''Figure 4:''' |
The Benedict’s quantitative and qualitative tests for reducing sugar produced by the enzymatic or cellulosomal degradation of cellulose (A) Benedict’s qualitative test result for reducing sugar production through 24h of cellulose degradation by cellulosome, cellulosome without boosters, nanobody presenting cell+free cellulases+cellulase boosters, nanobody presenting cell+cellulases and nanobody presenting cell control from left to right (B) Benedict’s quantitative test for absorbance of the samples obtained from the Benedict’s qualitative test at 635 nm wavelength.]] | The Benedict’s quantitative and qualitative tests for reducing sugar produced by the enzymatic or cellulosomal degradation of cellulose (A) Benedict’s qualitative test result for reducing sugar production through 24h of cellulose degradation by cellulosome, cellulosome without boosters, nanobody presenting cell+free cellulases+cellulase boosters, nanobody presenting cell+cellulases and nanobody presenting cell control from left to right (B) Benedict’s quantitative test for absorbance of the samples obtained from the Benedict’s qualitative test at 635 nm wavelength.]] | ||
Revision as of 14:06, 12 October 2022
pT7-RBS-CipA1B2C-tT7
Strong promoter and terminator are used for high production.The protein produced has the ability to interact with 2 enzymatic subunits that are fused with a type I dockerin because the primary scaffoldin contains 2 type I cohesin domain. The cohesin-dockerin interaction fixes the subunits onto the primary scaffold allowing the enzymes to work synergetically to perform a cascade of catalytical reactions. One CBM ensures the cellulose or PET in the surrounding are attracted to the domains and allows them to be digested.
Usage and Biology
The protein scaffold of the mimic primary scaffoldin component contains 2 type I cohesin domain that interacts with the type I dockerin domain fused on other fusion protein to fix them onto the scaffold as a complex, the CBM domain on the protein attracts PET and cellulose in the surrounding, generating close proximity between the fixed enzyme on the scaffold and the substrate in the case of cellulose and PET degradation[1], for the catalytical reactions to happen faster. The primary scaffold can also be assembled to the secondary scaffold as it contains a type II dockerin domain to construct larger cellulosome-like complexes. And the paired strong promoter and terminator grants efficient production of the protein.
Characterisation of the Cellulosome Complex
Mini-scaffold construction of cellulosome
We constructed E.coli expression vectors for the mini-scaffold protein subunits. The scaffoldin components of the wild-type cellulosome subunits are large protein scaffolds that would bring a massive protein burden to the bacterial host secreting them. We modified the coding sequences for the wild-type cellulosome protein scaffold, as shown in (Fig.2A and Fig.2B) The mini-scaffolds were successfully expressed by our host, verified by the SDS-PAGE analysis shown in (Fig.2C and Fig.2D)
Functionality testing of our mini-scaffold
In order to verify the three levels of protein-protein interaction that assembles our cellulosome complex, Ag3-eforRED, DocI-eforRED, and DocII-eforRED vectors were constructed and cultured for IPTG-inducible expression (Fig. 2D). SDS-page analysis was performed with lysed cells and all three targeted proteins were identified in both whole cell and supernatant (Fig. 3A and 3B).
The nanobody-antigen interaction was verified by mixing intact E. coli cells displaying Neae-Nb3 with the supernatant of Ag3-eforRED (Fig. 2A). Red fluorescent characteristics were observed in the pellets after resuspending the centrifuged mixture, which is absent in the control group that only contains Neae-Nb3 (Fig. 3C).
After that, the type II cohesin-dockerin interaction was tested using the mixture of Neae-Nb3, OlpB-Ag3, and the type II dokerin fused with eforRED (Fig. 2B). A negative control lacking OlpB-Ag3 was set up for result comparison. Centrifugation was used to remove supernatant and the red fluorescence was only identified in pellets of the sample group, confirming the type II cohesin-dockerin interaction (Fig. 3D).
Finally, the association between type I cohesin and type I dockerin was validated using the mixture of Neae-Nb3, OlpB-Ag3, CipA1B2C, and DocI-eforRED (Fig. 2C), red fluorescence was detected in the resuspended mixture while it was not observed in the control group lacking the primary scaffold CipA1B2C (Fig. 3E), verifying the type I cohesin-dockerin interaction.


Cellulosome construction
We assembled the cellulose-like complex on the surface of E.coli by adding primary scaffold proteins, cellulases and cellulase boosters onto E.coli expressing secondary scaffold proteins. The mixture was centrifuged and resuspended in tris-HCl. The mixture underwent centrifugation and resuspension using tris-HCl, and cellulose was added to the mixture.
After 24h, the mixture was filtered and tested for glucose by Benedict's test. From the result, we determined that the cellulosome-like complexes are able to degrade cellulose at a higher efficiency than cell-free cellulases mixture. The overall success in engineering our project was verified by the successful construction of cellulosome complex and degrading cellulose to reducing sugars.

Sequence and Features
- 10COMPATIBLE WITH RFC[10]
- 12INCOMPATIBLE WITH RFC[12]Illegal NheI site found at 2073
- 21INCOMPATIBLE WITH RFC[21]Illegal BglII site found at 354
Illegal XhoI site found at 1277 - 23COMPATIBLE WITH RFC[23]
- 25INCOMPATIBLE WITH RFC[25]Illegal NgoMIV site found at 583
Illegal AgeI site found at 365
Illegal AgeI site found at 709
Illegal AgeI site found at 908
Illegal AgeI site found at 1579 - 1000COMPATIBLE WITH RFC[1000]
References
1. Anandharaj, Marimuthu et al. "Constructing A Yeast To Express The Largest Cellulosome Complex On The Cell Surface". Proceedings Of The National Academy Of Sciences, vol 117, no. 5, 2020, pp. 2385-2394. Proceedings Of The National Academy Of Sciences, https://doi.org/10.1073/pnas.1916529117.

