Difference between revisions of "Part:BBa K4140002"
Ahmed A Rezk (Talk | contribs) |
Ahmed Mattar (Talk | contribs) (→Experimental Characterization) |
||
| (12 intermediate revisions by 2 users not shown) | |||
| Line 7: | Line 7: | ||
==Part Description== | ==Part Description== | ||
Sequence upstream of the start codon is crucial for the recruitment of a ribosome during the initiation of translation, which influences the rate and efficiency at which a certain Open Reading Frame (ORF) is translated by the following mechanisms: | Sequence upstream of the start codon is crucial for the recruitment of a ribosome during the initiation of translation, which influences the rate and efficiency at which a certain Open Reading Frame (ORF) is translated by the following mechanisms: | ||
| + | <br> | ||
-the rate of ribosomal recruitment to RBS | -the rate of ribosomal recruitment to RBS | ||
| + | <br> | ||
-the speed at which a recruited ribosome is able to start translation (i.e. the translation initiation efficiency) | -the speed at which a recruited ribosome is able to start translation (i.e. the translation initiation efficiency) | ||
| + | <br> | ||
-The ideal spacing of the RBS from the start codon | -The ideal spacing of the RBS from the start codon | ||
==Usage== | ==Usage== | ||
| + | We use this part to increase the expression of TyrR by increasing the rate of ribosomal recruitment and the ability to start and influences the precision and effectiveness with which the mRNA translation process codon. as shown in figure 1. | ||
| + | [[File:trbs.png|thumb|Right|Figure 1. (shows the usage of TyrR RBS in our circuit design) ]] | ||
| + | <br><br><br><br><br><br> | ||
| + | ==Characterization by mathematical modeling== | ||
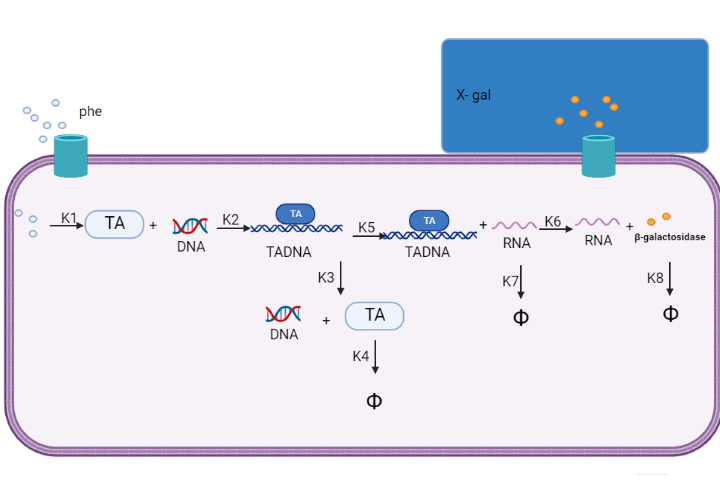
| + | We are using mathematical modeling to detect the increased level of phenylalanine (phe) in phenylketonuria patients in our diagnostic platform. It depends on a whole cell-based biosensor through a cascade of reactions to finally end by formation of β-galactosidase that turns the color into blue once bound to its substrate (X-gal) as mentioned in figure (2) and graph (1). | ||
| − | == | + | [[File:modell1.png|Right|]] |
| + | <br> | ||
| + | Figure (2) represents the cascade of reactions in whole cell-based biosensor model. | ||
| + | [[File:modell11.png|Right|]] | ||
| + | <br><br><br> | ||
| + | Graph(1) illustrates a direct relation between biomarker and beta-galactosidase ,so as the biomarker increases, the released amount of beta-galactosidase increases till it reaches constant value after about 30 time units. Therefore, the maximum amount of the biomarker releases the maximum amount of beta-galactosidase. | ||
| + | ==Experimental Characterization== | ||
| + | [[File:capture7.png|right|]] | ||
| + | <br><br><br><br><br> | ||
| + | This figure shows an experimental characterization of this part as it's validated through gel electrophoresis as it is in lane 6 (the last one). The running part (ordered from IDT) included T7P - TyrR RBS - TyrR - TyrPromoter. | ||
| + | <br><br><br><br><br><br><br><br><br><br><br><br> | ||
| − | + | <!-- Add more about the biology of this part here | |
| − | + | ||
| − | |||
| − | |||
| − | |||
| − | |||
===Usage and Biology=== | ===Usage and Biology=== | ||
Latest revision as of 17:05, 10 October 2022
TyrR RBS
Part Description
Sequence upstream of the start codon is crucial for the recruitment of a ribosome during the initiation of translation, which influences the rate and efficiency at which a certain Open Reading Frame (ORF) is translated by the following mechanisms:
-the rate of ribosomal recruitment to RBS
-the speed at which a recruited ribosome is able to start translation (i.e. the translation initiation efficiency)
-The ideal spacing of the RBS from the start codon
Usage
We use this part to increase the expression of TyrR by increasing the rate of ribosomal recruitment and the ability to start and influences the precision and effectiveness with which the mRNA translation process codon. as shown in figure 1.
Characterization by mathematical modeling
We are using mathematical modeling to detect the increased level of phenylalanine (phe) in phenylketonuria patients in our diagnostic platform. It depends on a whole cell-based biosensor through a cascade of reactions to finally end by formation of β-galactosidase that turns the color into blue once bound to its substrate (X-gal) as mentioned in figure (2) and graph (1).

Figure (2) represents the cascade of reactions in whole cell-based biosensor model.

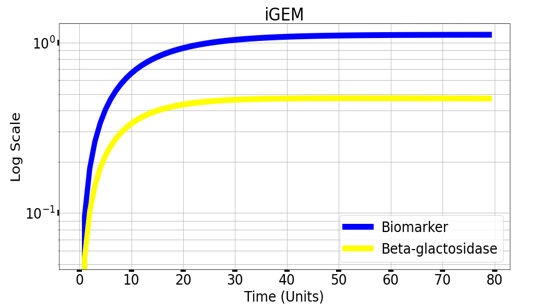
Graph(1) illustrates a direct relation between biomarker and beta-galactosidase ,so as the biomarker increases, the released amount of beta-galactosidase increases till it reaches constant value after about 30 time units. Therefore, the maximum amount of the biomarker releases the maximum amount of beta-galactosidase.
Experimental Characterization
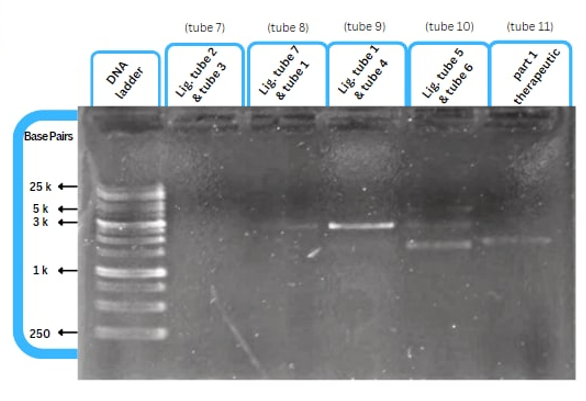
This figure shows an experimental characterization of this part as it's validated through gel electrophoresis as it is in lane 6 (the last one). The running part (ordered from IDT) included T7P - TyrR RBS - TyrR - TyrPromoter.
Sequence and Features
- 10COMPATIBLE WITH RFC[10]
- 12COMPATIBLE WITH RFC[12]
- 21COMPATIBLE WITH RFC[21]
- 23COMPATIBLE WITH RFC[23]
- 25COMPATIBLE WITH RFC[25]
- 1000COMPATIBLE WITH RFC[1000]


