Difference between revisions of "Part:BBa K4140001"
Ahmed Mattar (Talk | contribs) |
Ahmed Mattar (Talk | contribs) |
||
| Line 29: | Line 29: | ||
==Characterization by mathematical modeling== | ==Characterization by mathematical modeling== | ||
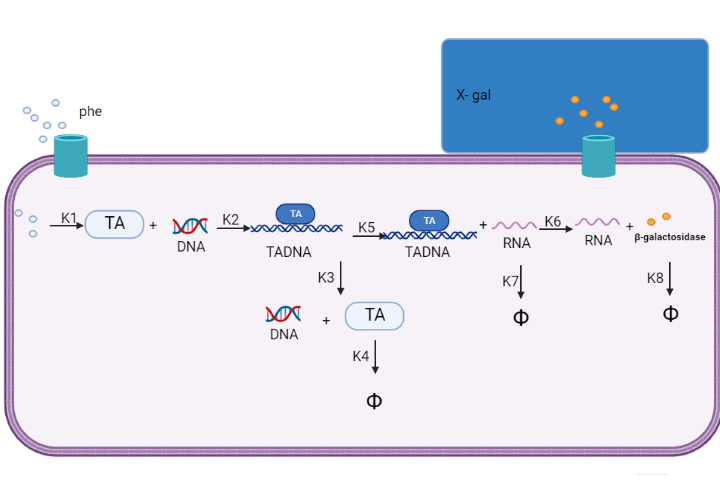
We are using mathematical modeling to detect the increased level of phenylalanine (phe) in phenylketonuria patients in our diagnostic platform. It depends on a whole cell-based biosensor through a cascade of reactions to finally end by formation of β-galactosidase that turns the color into blue once bound to its substrate (X-gal) as mentioned in figure (4) and graph (1). | We are using mathematical modeling to detect the increased level of phenylalanine (phe) in phenylketonuria patients in our diagnostic platform. It depends on a whole cell-based biosensor through a cascade of reactions to finally end by formation of β-galactosidase that turns the color into blue once bound to its substrate (X-gal) as mentioned in figure (4) and graph (1). | ||
| + | |||
[[File:modell1.png|Right|]] | [[File:modell1.png|Right|]] | ||
| + | <br><br><br> | ||
Figure (4) represents the cascade of reactions in whole cell-based biosensor model. | Figure (4) represents the cascade of reactions in whole cell-based biosensor model. | ||
[[File:modell11.png|Right|]] | [[File:modell11.png|Right|]] | ||
| + | <br><br><br> | ||
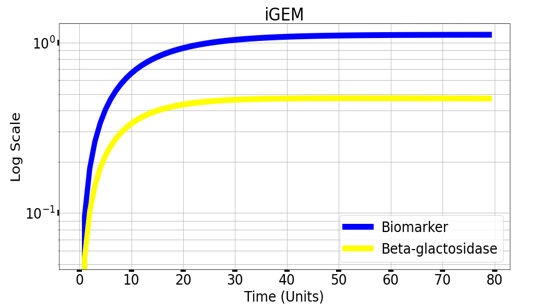
Graph(1) illustrates a direct relation between biomarker and beta-galactosidase ,so as the biomarker increases, the released amount of beta-galactosidase increases till it reaches constant value after about 30 time units. Therefore, the maximum amount of the biomarker releases the maximum amount of beta-galactosidase. | Graph(1) illustrates a direct relation between biomarker and beta-galactosidase ,so as the biomarker increases, the released amount of beta-galactosidase increases till it reaches constant value after about 30 time units. Therefore, the maximum amount of the biomarker releases the maximum amount of beta-galactosidase. | ||
Revision as of 16:20, 7 October 2022
TyrR
Part Description
The TyrR protein in Escherichia coli has the ability to both activate and repress the transcription operons necessary for the production and intake of aromatic amino acids (tyrosine, phenylalanine, and tryptophan). As an illustration, the TyrR dimer activates the promoter of the tyrP gene, which codes for a transporter specific to tyrosine, when tyrosine is present
Usage
We took advantage of The TyrR protein properties and it’s ability to control the biosynthesis and intake of aromatic amino acids (tyrosine, phenylalanine, and tryptophan). So we employ it to control the activity of the paroF promoter and TyrP promoter as TyrR dimer activates the TyrP promoter and paroF promoter in the presence of phenylalanine , when tyrosine is more abundant the induction effect on paroF is lost as shown in figure 1.
Literature Characterization
ATPase activity of tyrR:
In this study, TyrR has poor ATPase activity that ranges between 12 and 400 mmol of ATP mol−1 monomer min−1. TyrR-(188–467) posess a specific ATPase activity of 105 mmol of ATP mol−1 monomer min−1, about five times the value for TyrR, which was found in this study to be 20 mmol of ATP mol−1 monomer min−1. As shown in figure 1, the flow dialysis demonstrates that TyrR binds to ATP with a half saturation value of 3.1 m. TyrR-(188-467) binds to ATP with a half saturation value of 7.6 m. TyrR-(188-467) had a 1.4 m dissociation constant when it coupled to rhodamine-ATP. These findings demonstrate that TyrR-(188-467) had a 2- to 5-fold reduced affinity for binding ATP and rhodamine-ATP than TyrR.
Dixon, M. P., Pau, R. N., Howlett, G. J., Dunstan, D. E., Sawyer, W. H., & Davidson, B. E. (2002). The central domain of Escherichia coli TyrR is responsible for hexamerization associated with tyrosine-mediated repression of gene expression. Journal of Biological Chemistry, 277(26), 23186-23192.
Characterization of Mutational Landscape
After creating a multiple sequence alignment of the protein sequence and predicting mutational landscapes, the effect of these mutations on the evolutionary fitness of the protein is tested. The prediction of the mutational landscape by saturation mutagenesis of the TyrR protein. The (C374R) mutation, as depicted in the chart, had the greatest score when compared to other mutations. On the other hand, it's clear that the (K399Q) had the least evolutionary fitness for TyrR protein. As displayed in Figure(3)
Characterization by mathematical modeling
We are using mathematical modeling to detect the increased level of phenylalanine (phe) in phenylketonuria patients in our diagnostic platform. It depends on a whole cell-based biosensor through a cascade of reactions to finally end by formation of β-galactosidase that turns the color into blue once bound to its substrate (X-gal) as mentioned in figure (4) and graph (1).

Figure (4) represents the cascade of reactions in whole cell-based biosensor model.

Graph(1) illustrates a direct relation between biomarker and beta-galactosidase ,so as the biomarker increases, the released amount of beta-galactosidase increases till it reaches constant value after about 30 time units. Therefore, the maximum amount of the biomarker releases the maximum amount of beta-galactosidase.
References
1. Dixon, M. P., Pau, R. N., Howlett, G. J., Dunstan, D. E., Sawyer, W. H., & Davidson, B. E. (2002). The central domain of Escherichia coli TyrR is responsible for hexamerization associated with tyrosine-mediated repression of gene expression. Journal of Biological Chemistry, 277(26), 23186-23192.
Sequence and Features
- 10COMPATIBLE WITH RFC[10]
- 12COMPATIBLE WITH RFC[12]
- 21INCOMPATIBLE WITH RFC[21]Illegal BglII site found at 720
Illegal BglII site found at 1062 - 23COMPATIBLE WITH RFC[23]
- 25INCOMPATIBLE WITH RFC[25]Illegal AgeI site found at 526
- 1000COMPATIBLE WITH RFC[1000]


