Difference between revisions of "Part:BBa K515105"
(→Team iBowu-China 2021 Contribution) |
(→Team iBowu-China 2021 Contribution) |
||
| (2 intermediate revisions by the same user not shown) | |||
| Line 119: | Line 119: | ||
<p> | <p> | ||
| − | We used this | + | We used this part as a positive comparison for control group in the measurement of green fluorescence. Carried on a pSB1C3 plasmid, this part can effectively produce green fluorescence, together with a constitutive promoter. Our contribution includes |
| + | # We transformed both DH5a and BL21(DE3) and produced green fluorescence without any addition of induction reagents such as IPTG. | ||
| + | # In both cases, the light intensity is much stronger than the background by about 100 fold. | ||
| + | |||
<br> | <br> | ||
| Line 128: | Line 131: | ||
<b>Results:</b> | <b>Results:</b> | ||
<br> | <br> | ||
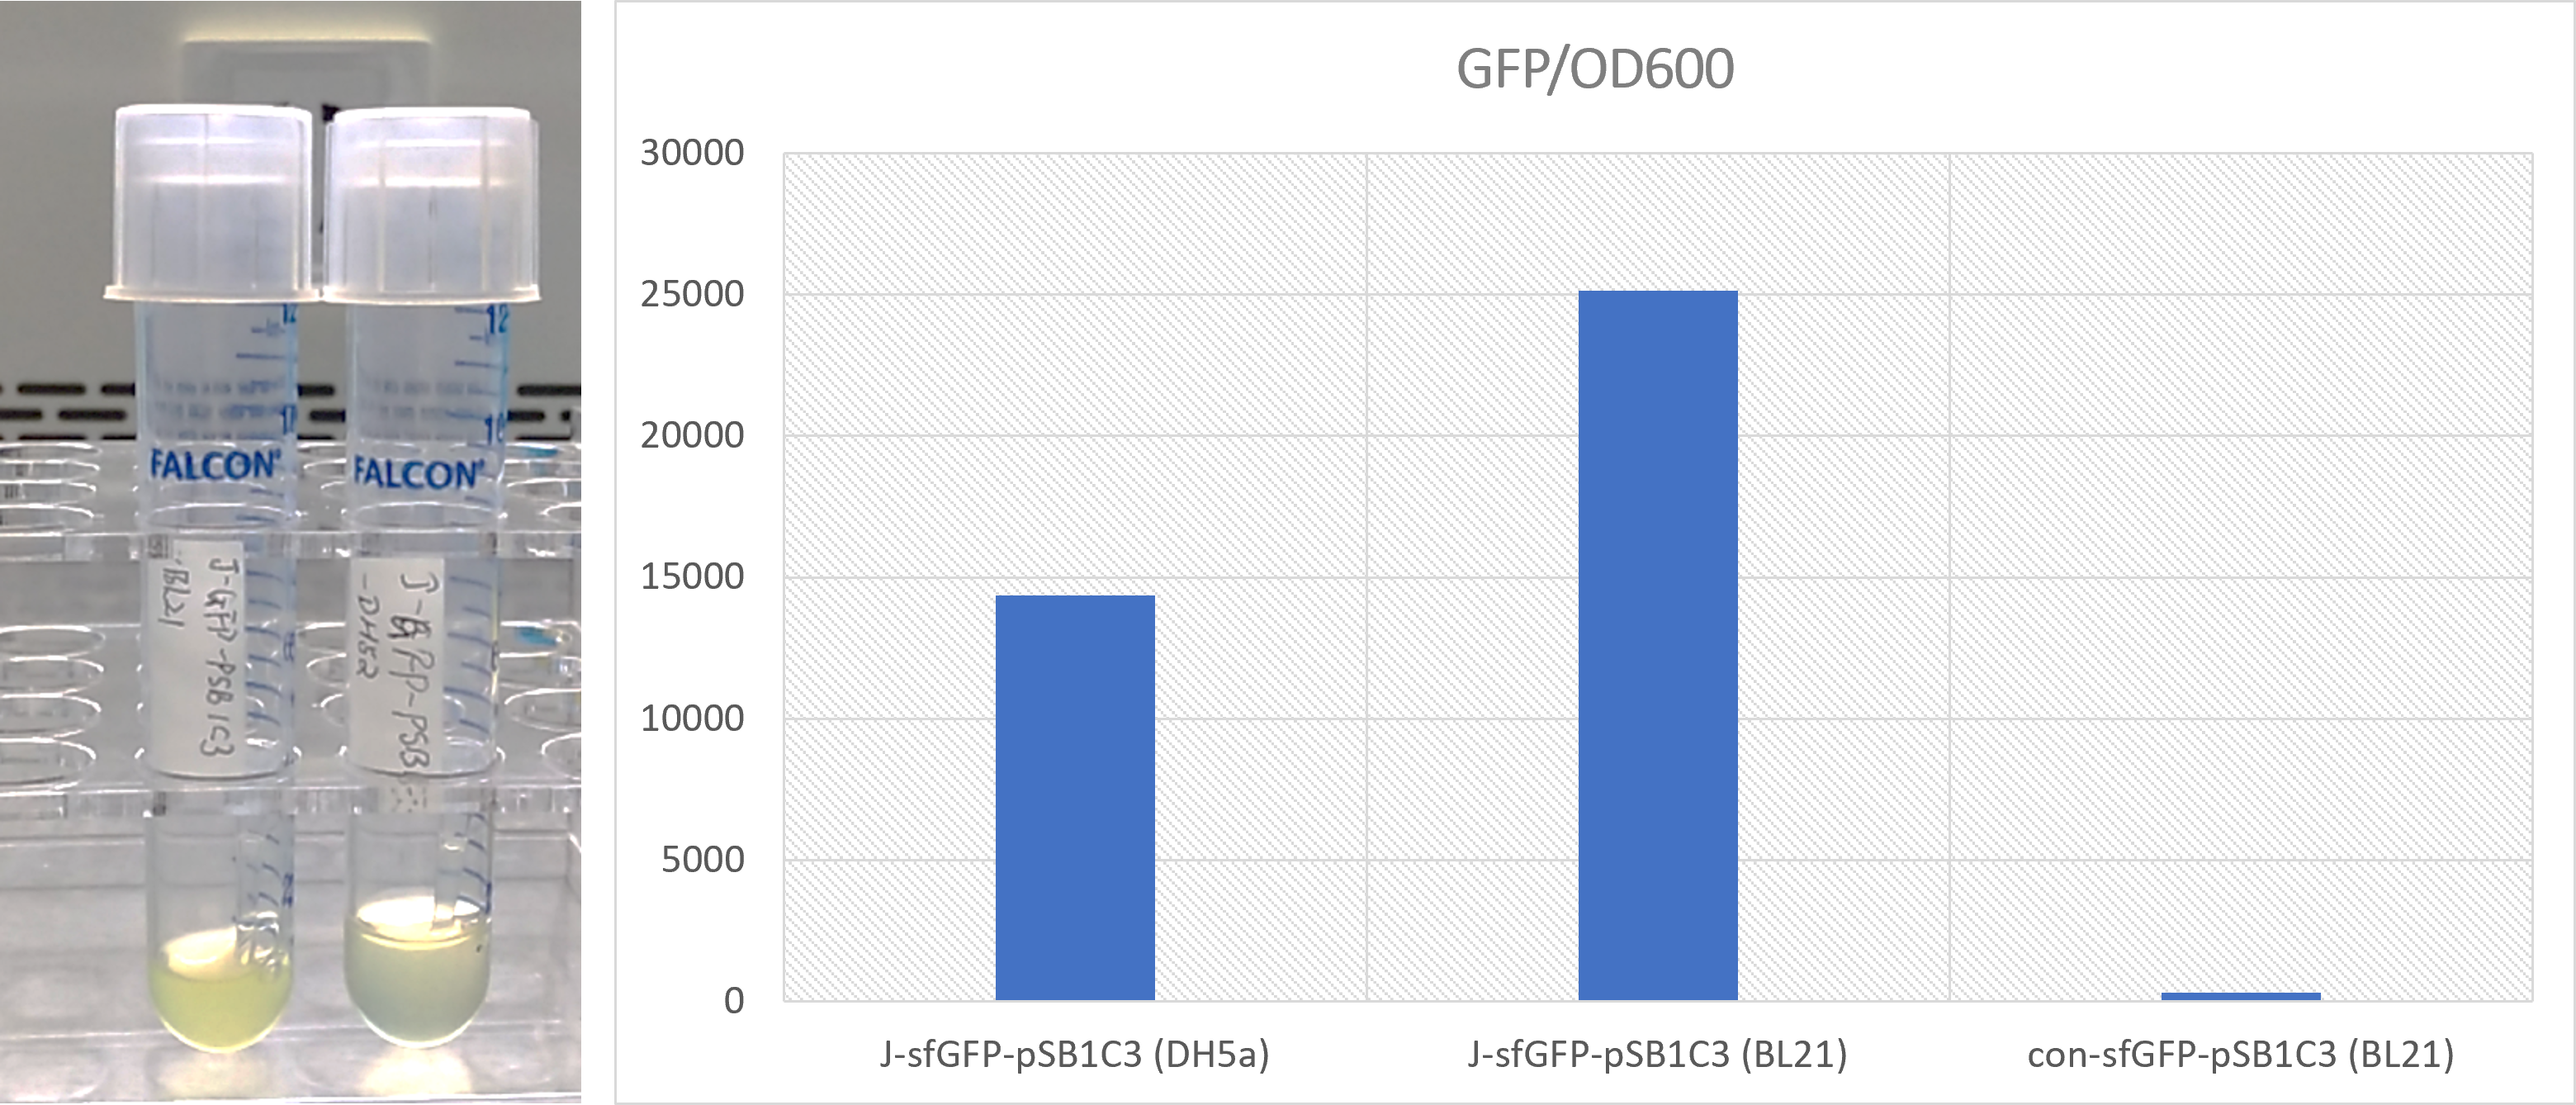
| − | [[File: T--iBowu-China--2021gfp1.png | | + | [[File: T--iBowu-China--2021gfp1.png |800px|thumb|center| Figure 1. Green fluorescence protein expressed by <i>E. coli</i> DH5a and BL21(DE3) under visible light and their measured intensity normalized by their concentration (OD600). The third column was the control group where the E. coli BL21(DE3) without this plasmid was used. ]] |
<br> | <br> | ||
Latest revision as of 03:57, 20 October 2021
J23100 promoter - sfGFP
A composite part between J23100 and superfolder GFP (sfGFP).
Sequence and Features
- 10COMPATIBLE WITH RFC[10]
- 12INCOMPATIBLE WITH RFC[12]Illegal NheI site found at 7
Illegal NheI site found at 30 - 21COMPATIBLE WITH RFC[21]
- 23COMPATIBLE WITH RFC[23]
- 25INCOMPATIBLE WITH RFC[25]Illegal AgeI site found at 215
- 1000COMPATIBLE WITH RFC[1000]
Background
This part is superfolder GFP, a very brightly fluorescent protein under the control of the constitutive promoter J23100. This BioBrick has been sequence verified.Thermostability
This test is to show the thermostability of sfGFP, by identifying the temperature at which the protein denatures. Stock solutions of sfGFP were prepared by extracting the protein from cell lysate, and then 50 μl aliquots of the solution were heated in a PCR thermocycler with temperature gradient.
After two hours, 30 μl was removed from each aliquot and diluted with 170 μl of 20 mM Tris buffer to give 200 μl samples. The samples were then measured by fluorescence on a 96-well plate. The corresponding curve was plotted on a graph and the curve was used to calculate the denaturation temperature (see Figure 1).

Figure 1: Results of the heat denaturation experiment. The temperature at which half the proteins are denatured was studied by measuring fluorescence (PTm50) mRFP1: 82.2°C; GFPmut3b: 61.6°C; Dendra2: 89.1°C; sfGFP: 75.0°C.

Soil survivability and plasmid retainment testing
To test for the survivability of E. coli in soil, we set up an experiment. We initially transformed chemically competent DH5alpha cells with superfolder GFP. These cells were inoculated on small (about 0.5 cm diameter) filter discs, which were placed in autoclaved and non-autoclaved soil. We periodically grew up cultures from these filter discs over the course of six weeks.
After six weeks, we were able to recover fluorescent bacteria from sterilised soil. Colonies appearing to be Figure 2. Colonies recovered from filter discs after 6 weeks of growth in soil and grown on LB plates containing selective antibiotics imaged using a LAS-3000 gel imager. a) Sample taken from non-sterilised soil b) Sample taken from sterilised soil. (Data by Imperial College London iGEM team 2011). Figure 3. Gel digests of bacteria displaying colony morphology typical of E. coli recovered from non-sterilised and sterilised soil. These bacteria exhibited colony morphologies typical of E. coli. (Data by Imperial College iGEM team 2011). As is visible from these plates, fluorescence was detected in bacteria recovered from sterile but was much reduced in bacteria from non-sterile soil. The control plate showed that there was no contamination with other fluorescent lab bacteria. In order to investigate whether the fluorescence observed was due to the presence of the original sfGFP construct and whether the E. coli-like colonies from the non-sterile sample had retained a plasmid we extracted plasmid DNA using a miniprep kit and did a digest with EcoRI and PstI and with EcoRI on its own to check for presence of the original insert and size of the unfolded vector, respectively (Fig. 3). The insert is very clearly visible at just below 2 kb. This confirms the presence of superfolder GFP in both cultures. Sequencing of the GFP insert revealed that a single frameshift mutation had taken place in the colonies grown up from non-sterile soil. No mutations were observed in the superfolder GFP gene contained in the bacteria inoculated in non-sterile soil. This explains the absence and presence of fluorescence in the respective colonies. However, the bacteria were still resistant to the antibiotics and contained the plasmid. We will be replicating these results with other samples to ensure this is representative.
In addition, small colonies appeared on the non-sterile plate that had very different colony morphology. We grew one of these colonies up in LB medium containing selective antibiotic and subsequently performed a separate miniprep. No DNA was yielded in this miniprep. It is therefore likely that the plasmid was not transferred to these bacteria but that they either possess natural antibiotic resistance or were able to survive on plates that whose antibiotics had already been depleted by the presence of resistant engineered bacteria.
As described by Paungfoo-Lonhienne et al. (2010)[1], plants are able to actively take up microbes. We replicated these findings using E. coli DH5alpha cells expressing sfGFP. Bacteria were grown into exponential phase, spun down and resuspended in 5 mM MES to OD 30. 2, 4, and 8 ml of these bacteria were added to 100 ml half-MS cultures containing three-week old Arabidopsis thaliana Columbia strain wild type plants. Subsequently, the roots were washed in PBS to avoid imaging of any false positives - bacteria on the outside of rather than inside the roots. The sfGFP allowed us to very clearly identify bacteria inside the roots (Figure 4).
Figure 4. Escherichia coli cells expressing superfolder GFP (sfGFP) can be seen inside an Arabidopsis thaliana root using confocal microscopy after overnight incubation of the plants with bacteria. Roots were washed in PBS prior to imaging to avoid "false positives" of bacteria adhering to the outside of the root (data and imaging by Imperial College iGEM 2011). [1] Paungfoo-Lonhienne, C. et al. (2010) Turning the table: plants consume microbes as a source of nutrients. PLoS One, 5(7), e11915.

Plant uptake of E. coli

References:
Newcastle 2019 characterisation
The Newcastle iGEM team aimed to develop a suite of biosensors using fluorescence proteins as a reporter. Our goal was to investigated if we can measure fluorescence level correctly when fluorescence proteins are combined. We investigate whether mixing cultures of cells expressing different fluorescent proteins would affect the fluorescence intensity of the individual fluorescent proteins. The fluorescent proteins we chose were sfGFP (BBa_K515105) and mCherry (BBa_J04450).
We obtained sfGFP and mCherry into pSB1AT3 from iGEM distribution kits. The resuspended DNA was transformed into E. coli DH5 alpha cells. Cells were inoculated in LB media and grown to an optical density 600 (OD600) of 0.6. Half of the culture was diluted to OD600 0.3 and the individual fluorescence levels were measured at: sfGFP - excitation 480nm and emission 507 nm and mCherry – excitation 580 nm, emission 610 nm. The sfGFP and mCherry cultures at OD600 0.6 were mixed together in equal amounts and the fluorescence level of the combined mixture was measured in a BioTek Synergy H1 Microplate Reader with a gain of 100.
The sfGFP and mCherry cultures at OD600 0.6 were mixed together in equal amounts and the fluorescence level of the combined mixture was measured. Theoretically, the OD600 of each fluorescence protein in the mixture will be 0.3. By comparing the individual fluorescence level at OD600 of 0.3 to the fluorescence level of the equivalent fluorescence protein minus the opposing fluorescent protein, the effect of mixing fluorescent proteins can be observed.
The emission spectra for sfGFP ranges from 469 nm to 628 nm and the emission spectra for mCherry ranges from 551 nm to 800 nm. There is an overlap of 77 nm in the emission spectra of the two fluorescent proteins. This small overlap suggests that there will not be much effect on the fluorescence intensity of the individual fluorescent proteins as the overlap will be at an emission with a low percentage emission.
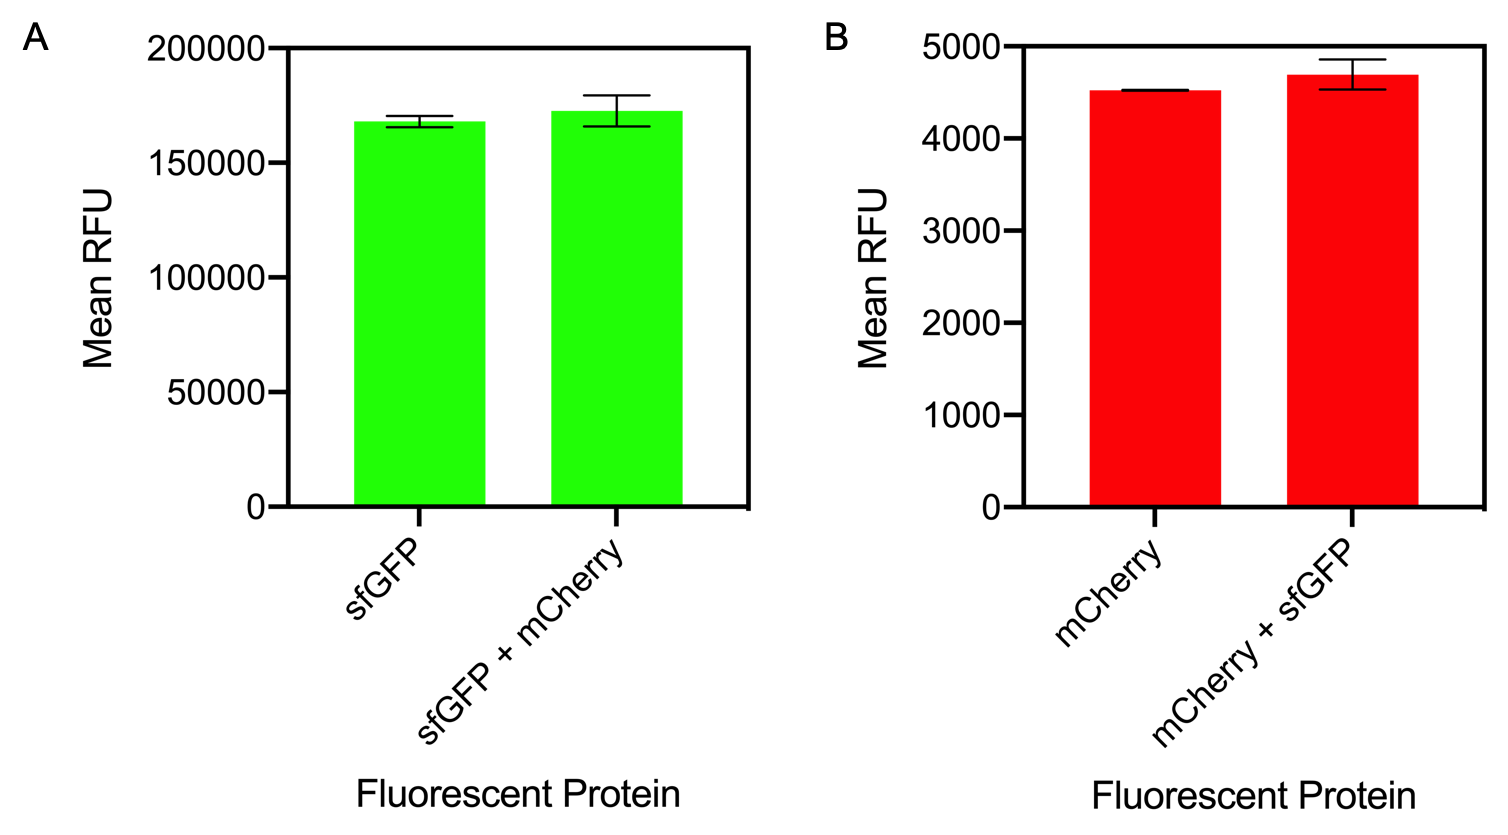
Figure 1. A) Bar chart showing the mean fluorescence intensity of E. coli DH5 alpha cells expressing sfGFP individually at an OD600 of 0.3 with standard deviations compared to the mean fluorescence intensity when mixed with cells expressing the fluorescent protein mCherry Excitation 480 nm, emission 507. B) Bar chart showing the mean fluorescence intensity of E. coli DH5 alpha cells expressing mCherry individually at an OD600 of 0.3 with standard deviations compared to the mean fluorescence intensity when mixed with cells expressing the fluorescent protein sfGFP. Excitation 580 nm, emission 610 nm.
The results of mixing sfGFP and mCherry at sfGFP excitation and emission (Figure 1A) showed that there was no significant difference in fluorescence intensity of sfGFP when mixed with mCherry (Figure 13A). The mean fluorescence of sfGFP individually was 168008 ± 2503.4 compared to the mean fluorescence of sfGFP mixed with mCherry at 172678.2 ± 6826.9. Similarly, at mCherry excitation and emission, similar results were observed and there was no significant difference in fluorescence intensity (Figure 1B). The mean fluorescence of mCherry individually was 4524.8 ± 5.1 compared to the mean fluorescence of mCherry mixed with sfGFP at 4693.6 ± 162.5.
In conclusion, mixing of sfGFP and mCherry did not significantly alter the fluorescence intensity of each individual fluorescent protein. It can be concluded that despite the mixing of fluorescent proteins, when measuring fluorescence intensity, it can be confidently assumed that the results for each fluorescent protein is accurate.
For more detail see - https://2019.igem.org/Team:Newcastle/Results/bronzecharacterisation
Team iBowu-China 2021 Contribution
Group: iBowu-China 2021
Author: Rachel Chen
Introduction:
We used this part as a positive comparison for control group in the measurement of green fluorescence. Carried on a pSB1C3 plasmid, this part can effectively produce green fluorescence, together with a constitutive promoter. Our contribution includes
- We transformed both DH5a and BL21(DE3) and produced green fluorescence without any addition of induction reagents such as IPTG.
- In both cases, the light intensity is much stronger than the background by about 100 fold.
Protocol: The plasmid was obtained from BNDS-China 2021 team. It was then expressed both in E. coli DH5a and E. coli BL21(DE3) with Cm resistance. The bacteria culture was incubated without addition of any iPTG in both cases overnight at 37 degree Celsius. GFP was measured with a microplate reader and OD600 was taken for normalization of the concentration. A control group was also measured for background light intensity where the E. coli BL21(DE3) without this plasmid was cultured. A picture was taken to show the effect of green fluorescence protein expression.
Results:
The results show this part can produce green fluorescence protein highly effectively. In BL21(DE3), the expression is stronger than in DH5a. The intensity of the GFP light in BL21(DE3) is about 2x the intensity in DH5a. In both cases, the light intensity is much stronger than the background by about 100 fold.
Summary:
This part can be used for effective expression of green fluorescence protein. It is an ideal choice for control group, and it can also be engineered to express other sequences.


