Difference between revisions of "Part:BBa K3962340"
| Line 3: | Line 3: | ||
<partinfo>BBa_K3962340 short</partinfo> | <partinfo>BBa_K3962340 short</partinfo> | ||
| − | This construct is | + | This construct is composed of arabinose-inducible promoter pBAD and fluorescent protein mCherry. In our project, we used it to characterize the inducibility of arabinose on pBAD activity. |
<!-- Add more about the biology of this part here | <!-- Add more about the biology of this part here | ||
| Line 9: | Line 9: | ||
<!-- --> | <!-- --> | ||
| + | |||
| + | <h2><span class="mw-headline" id="2021 Team Leiden">2021 Team Leiden</span><span class="mw-editsection"></span></h2> | ||
| + | |||
| + | The promoter p2547 from the Anderson family of promoters ([https://parts.igem.org/Part:BBa_J23100 BBa_J23100]) was used because it provides a series constitutive with various expression levels. | ||
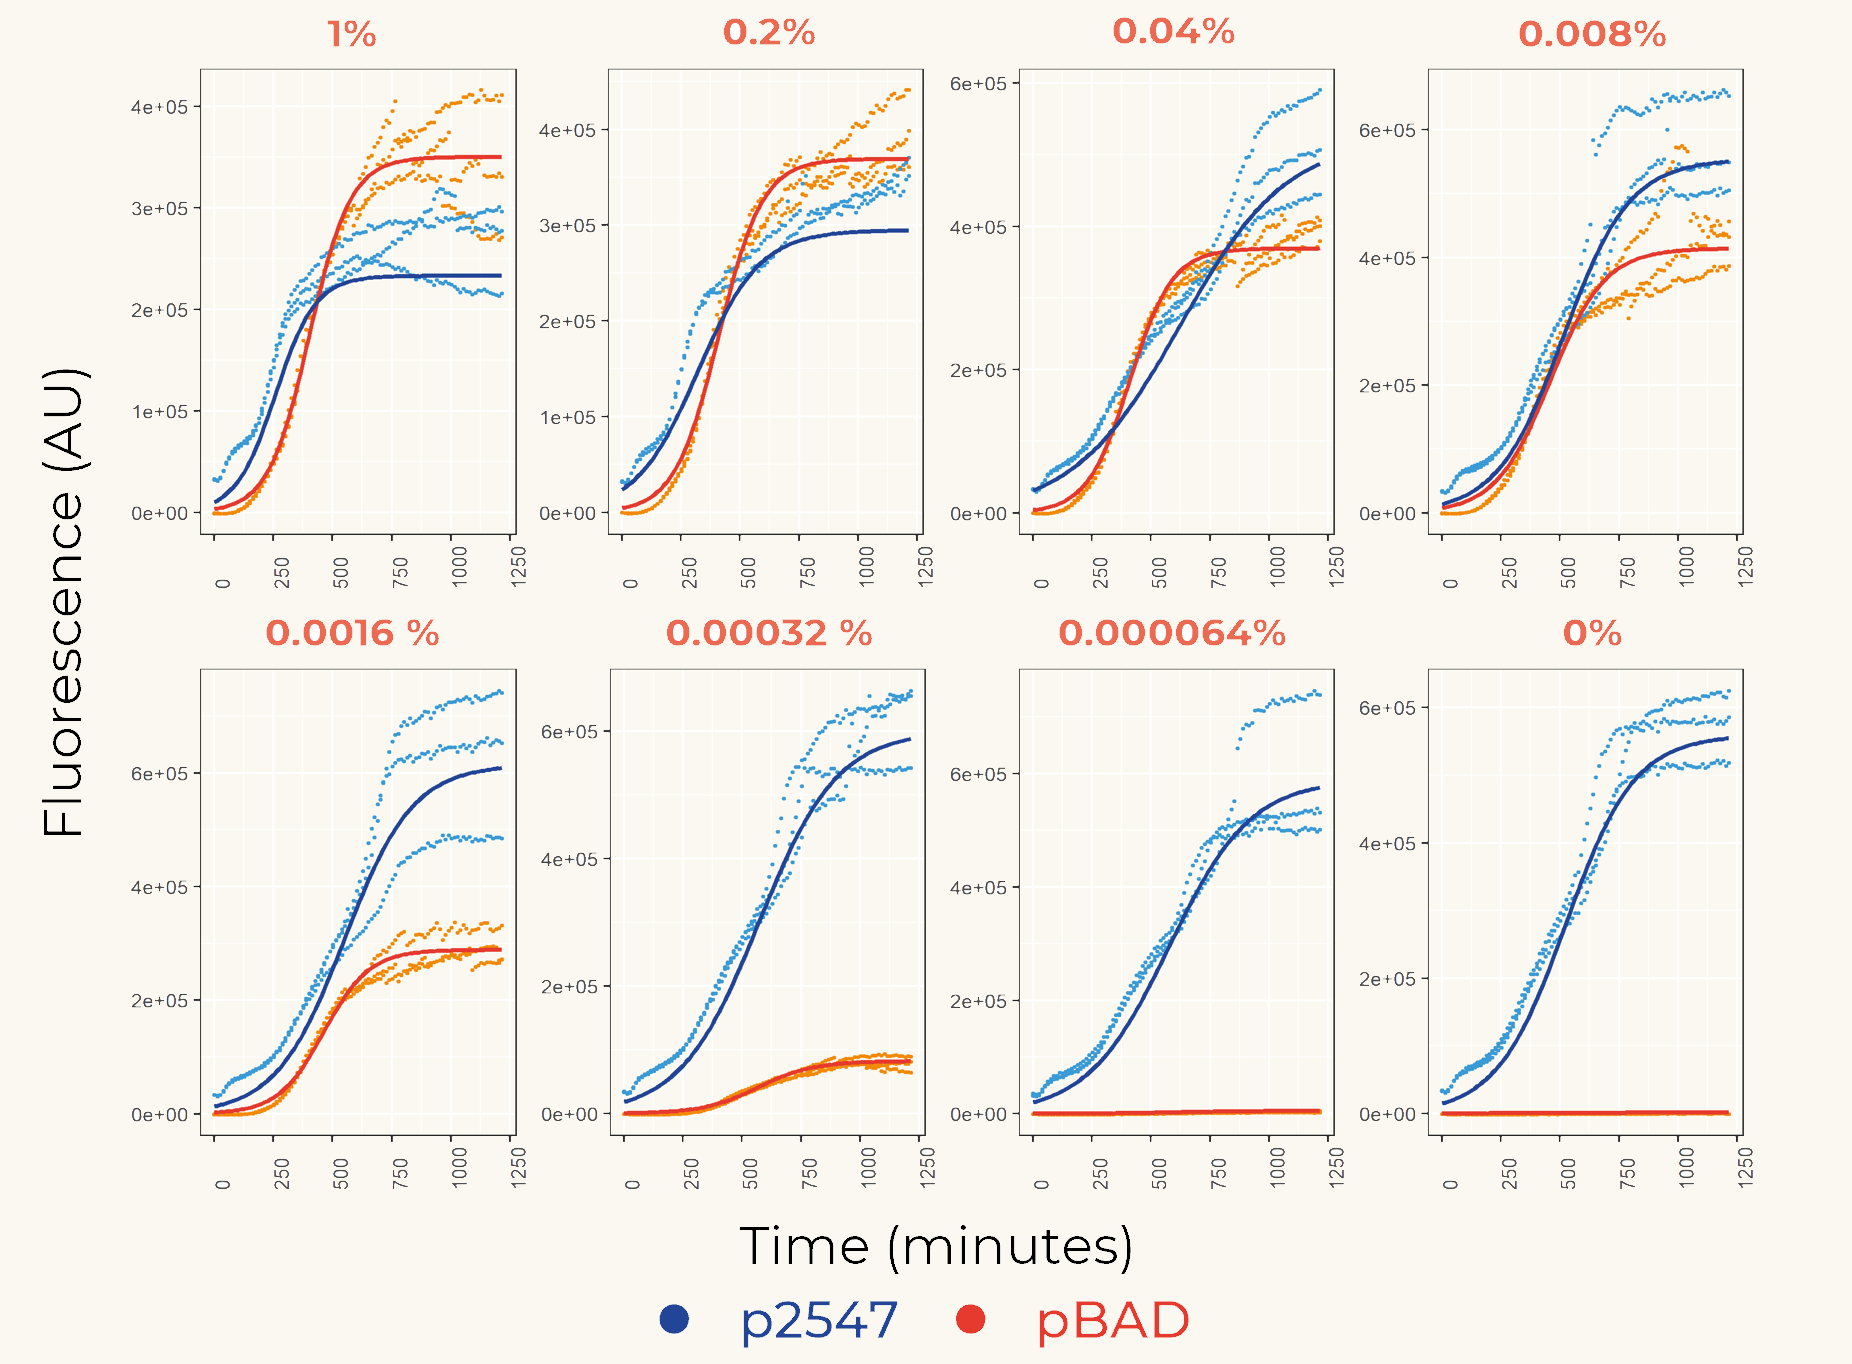
| + | Use in biology: To calibrate the expression of pBAD to this promoter, the mCherry fluorescent protein was used (Fig. 1). | ||
| + | |||
| + | [[Image:T-Leiden-parts-Figuer1.png|500px]] | ||
| + | |||
| + | '''''Figure 1.''''' ''The fluorescence intensity of strains carrying our construct under different arabinose concentration. The measurement was carried out for 20 h. The x-axis shows the time of each measurement. The y-axis shows the fluorescence of mCherry in the arbitrary unit (AU). The blue data points represent the fluorescent intensity of p2547::mCherry strain, red data points represent the pBAD::mCherry strain. The arabinose concentration is shown at the top of each graph. '' | ||
| + | |||
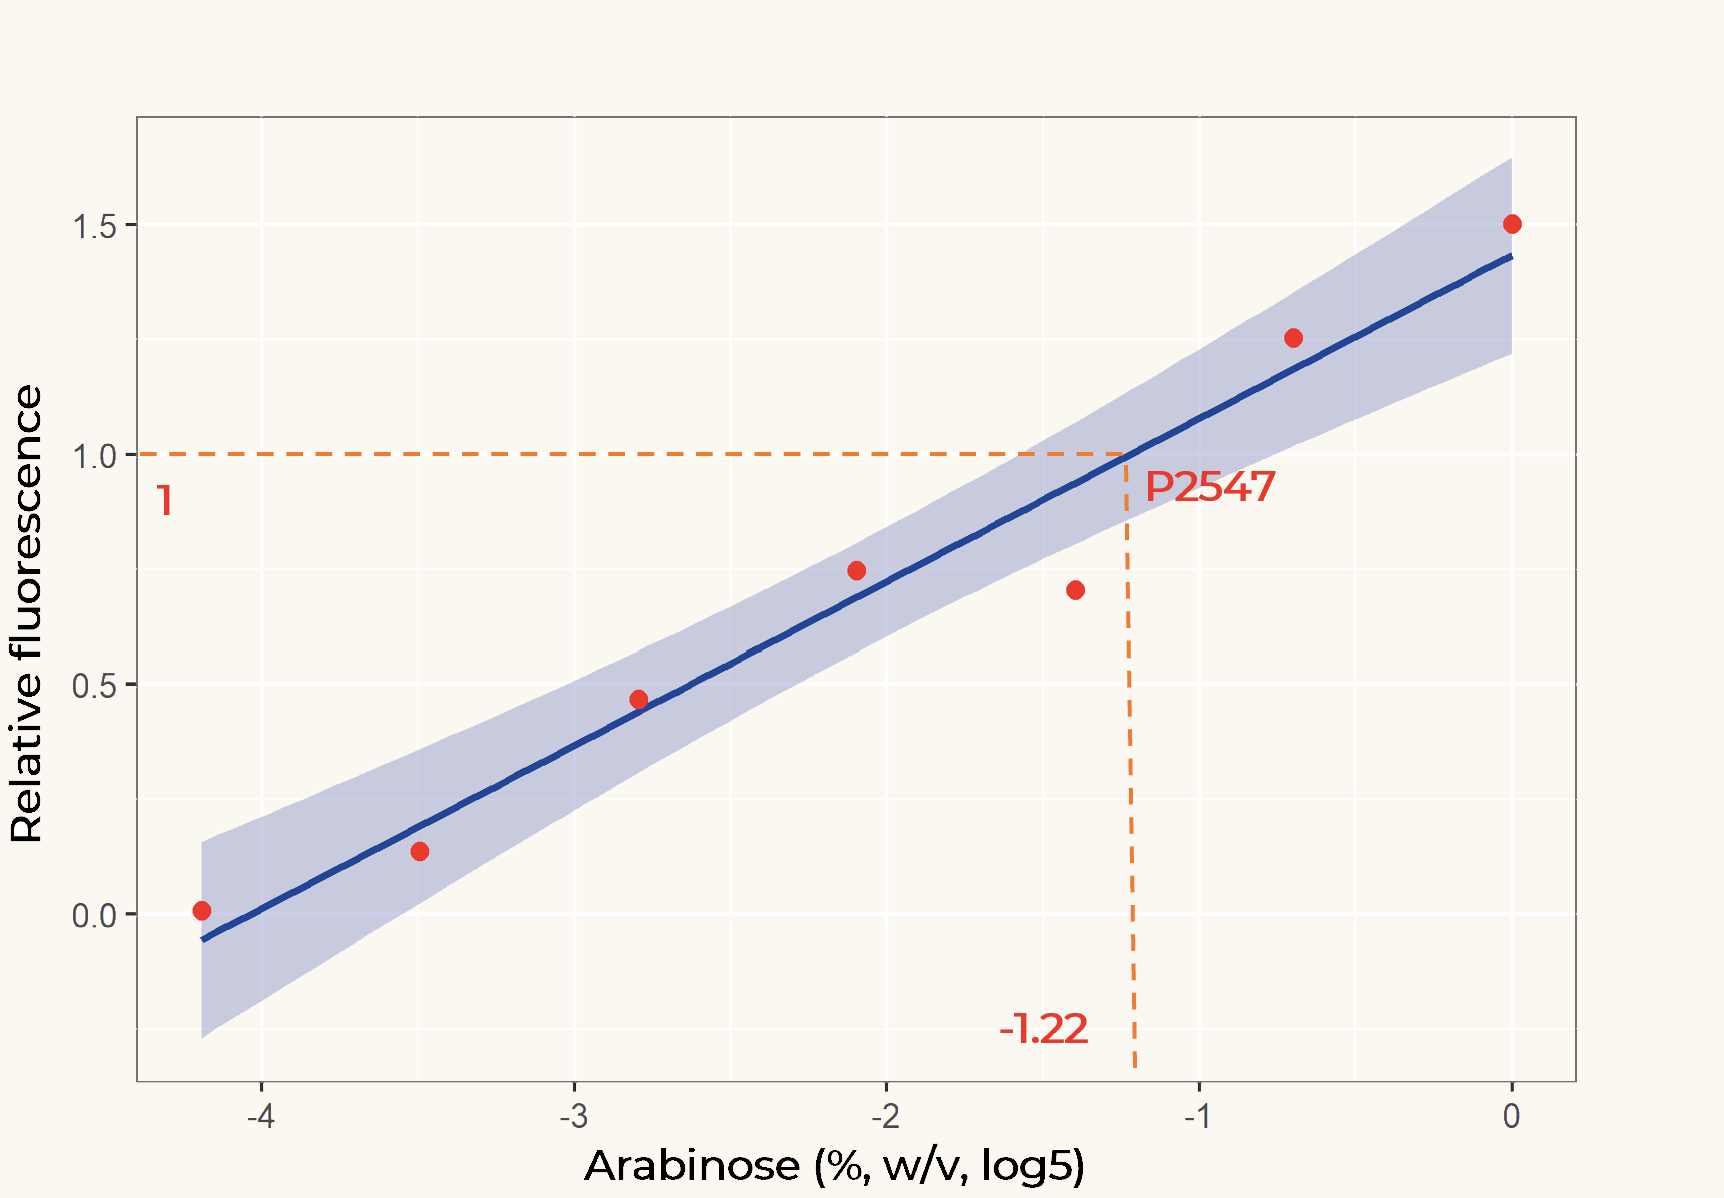
| + | The results of the plate reader assay show that the inducible promoter pBAD gave varying levels of expression depending on L-arabinose concentration and constitutive promoter p2547 gave constant expression. At higher concentrations, the expression of pBAD is higher than the activity of p2547, and it is lower at concentrations approaching zero. We used this data to fit a linear regression model to determine at which concentration the level of pBAD equals p2547 expression (Fig. 2). | ||
| + | |||
| + | [[Image:T-Leiden-parts-Figuer2.png|500px]] | ||
| + | |||
| + | '''''Figure 2.''''' ''Linear regression of arabinose concentration relative fluorescence of pBAD compared with p2547. The orange dash lines showed how p2547 related to pBAD transcriptional activity at the arabinose concentration of 0.14% (log5-1.22).'' | ||
| + | |||
| + | The linear regression model showed that at a L-arabinose concentration of 0.14% (w/v), the expression of genes under pBAD is the same as under p2547. | ||
| + | |||
<span class='h3bb'>Sequence and Features</span> | <span class='h3bb'>Sequence and Features</span> | ||
<partinfo>BBa_K3962340 SequenceAndFeatures</partinfo> | <partinfo>BBa_K3962340 SequenceAndFeatures</partinfo> | ||
Revision as of 14:16, 15 October 2021
pBAD promoter with mCherry for inducible expression of reporter
This construct is composed of arabinose-inducible promoter pBAD and fluorescent protein mCherry. In our project, we used it to characterize the inducibility of arabinose on pBAD activity.
2021 Team Leiden
The promoter p2547 from the Anderson family of promoters (BBa_J23100) was used because it provides a series constitutive with various expression levels. Use in biology: To calibrate the expression of pBAD to this promoter, the mCherry fluorescent protein was used (Fig. 1).
Figure 1. The fluorescence intensity of strains carrying our construct under different arabinose concentration. The measurement was carried out for 20 h. The x-axis shows the time of each measurement. The y-axis shows the fluorescence of mCherry in the arbitrary unit (AU). The blue data points represent the fluorescent intensity of p2547::mCherry strain, red data points represent the pBAD::mCherry strain. The arabinose concentration is shown at the top of each graph.
The results of the plate reader assay show that the inducible promoter pBAD gave varying levels of expression depending on L-arabinose concentration and constitutive promoter p2547 gave constant expression. At higher concentrations, the expression of pBAD is higher than the activity of p2547, and it is lower at concentrations approaching zero. We used this data to fit a linear regression model to determine at which concentration the level of pBAD equals p2547 expression (Fig. 2).
Figure 2. Linear regression of arabinose concentration relative fluorescence of pBAD compared with p2547. The orange dash lines showed how p2547 related to pBAD transcriptional activity at the arabinose concentration of 0.14% (log5-1.22).
The linear regression model showed that at a L-arabinose concentration of 0.14% (w/v), the expression of genes under pBAD is the same as under p2547.
Sequence and Features
- 10COMPATIBLE WITH RFC[10]
- 12INCOMPATIBLE WITH RFC[12]Illegal NheI site found at 1205
- 21INCOMPATIBLE WITH RFC[21]Illegal BamHI site found at 1144
- 23COMPATIBLE WITH RFC[23]
- 25INCOMPATIBLE WITH RFC[25]Illegal AgeI site found at 979
- 1000INCOMPATIBLE WITH RFC[1000]Illegal SapI site found at 961


