Difference between revisions of "Part:BBa K1131000"
(→BJU-China 2021 iGEM TEAM) |
(→BJU-China 2021 iGEM TEAM) |
||
| Line 154: | Line 154: | ||
==BJU-China 2021 iGEM TEAM== | ==BJU-China 2021 iGEM TEAM== | ||
| − | + | ===Description=== | |
In order to produce Tyrian purple,our team used flavin-containing monooxygenase (FMO) documented by BBa_1131000 in <i>E.coli</i> BL21(DE3). | In order to produce Tyrian purple,our team used flavin-containing monooxygenase (FMO) documented by BBa_1131000 in <i>E.coli</i> BL21(DE3). | ||
| + | |||
| + | MaFMO is flavin-containing monooxygenase from Methylophaga aminisulfidivorans, which could produce indigo dye in E.coli. In our project, we used MaFMO as part of the tyrian purple ( 6,6'-dibromoindigo, 6BrIG) metabolic pathway. During the production from Trp to 6BrIG, the MaFMO enzyme oxidizes 6Br-Indole to 6,6-dibromoindigo. | ||
| + | [[File:T--BJU_China--Fig.1 contribution1.png|600px|thumb|center]] | ||
| + | <p class="figure-description"><b><center>Fig.1 Catalysis of MaFMO</center></b></p> | ||
| + | |||
| + | ===Experiment=== | ||
| + | We designed MaFMO to be expressed under the control of T7-LacO inducible promoters(Fig.2). The sequence of MaFMO was obtained by cloning from iGEM kit using PCR (Fig.3), and we constructed the gene into pET28b plasmid initiated with IPTG induction. | ||
| + | [[File:T--BJU_China--Fig.2 contribution2.png|600px|thumb|center]] | ||
| + | <p class="figure-description"><b><center>Fig.1 Gene circuit of MaFMO</center></b></p> | ||
| + | |||
| + | [[File:T--BJU_China--Fig.3 contribution3.png|600px|thumb|center]] | ||
| + | <p class="figure-description"><b><center>Fig.3 Construction of MaFMO plasmid</center></b></p> | ||
| + | |||
| + | The constructed plasmid was transformed to E. coli BL21(DE3)for protein expression as the following protocols. | ||
| + | 1. Single colony was inoculated into LB medium, and cultivated vernight at 37° as seed culture. | ||
| + | 2. The seed culture was inoculated into LB medium as 1:100, and IPTG were added at 0h respectively. The concentration of IPTG was 0, 0.1, 1, 5mM. | ||
| + | 3. The mixtures above were incubated in different temperatures (18℃,30℃,37℃) for MaFMO expression. | ||
| + | 4. The cells were collected by centrifugation at 4000g for 10min and resuspended in lysis buffer after 20 h induction. | ||
| + | 5. The cell soup was disrupted by ultrasonication in ice-chilled water. | ||
| + | 6. The soluble fractions were collected by centrifugation of the cells lysate at 10000g for 30min. | ||
| + | 7. The soluble fraction of lysates were loaded for SDS-PAGE detection. | ||
| + | |||
| + | ===Results and analysis=== | ||
| + | The following image (Fig.4) shows the results obtained from the SDS-PAGE. From the results, we can clearly observe the MaFMO protein band (the position indicated by the arrow, about 53.1 kDa). The uninduced controls (0mM) without IPTG were expected not to show bands if the promoter lacked leakiness; however, a faint band can be seen for all controls. | ||
| + | Bands corresponding to 0.1 and 1 mM IPTG for all temperatures show stronger bands compared to 1mM, that may due to high IPTG concentration affect cell growth. When comparing temperatures, incubation at 30°C and 37°C clearly yield a slightly more protein expression amount of MaFMO, but yields similar amounts of expression between IPTG concentrations. | ||
| + | [[File:T--BJU_China--Fig.4 contribution4.png|600px|thumb|center]] | ||
| + | <p class="figure-description"><b><center>Fig.4 SDS-GAGE of MaFMO protein</center></b></p> | ||
| + | |||
| + | After induction, we performed the 6Br-Indole reaction to synthesize 6BrIG. | ||
| + | We mixed the induced TnaA-MaFMO E. coli into NPB (50mM pH=8.0) buffer after centrifugation, added glucose to 0.6% (ω/V) resuspended until the OD600=2.0 of the solution, added 6Br-Indole to a concentration of 1mM in the solution, and shaken the bacteria at 30℃, 200rpm for 6h. The final 6BrIG production was obtained. solution 1. | ||
| + | [[File:T--BJU_China--Fig.5 contribution5.png|600px|thumb|center]] | ||
| + | <p class="figure-description"><b><center>Fig.5 6BrIG production by MaFMO catalysis</center></b></p> | ||
| + | |||
| + | From the figure, it can be found that the solution after the reaction has a distinct purple color compared to the unreacted E. coli solution. | ||
| + | |||
| + | |||
<br> | <br> | ||
Reference from: BRENDA database | Reference from: BRENDA database | ||
Revision as of 12:19, 13 October 2021
Flavin-containing monooxygenase (FMO); M. aminisulfidivorans
This Flavin-containing monooxygenase (FMO) from M. aminisulfidivorans can be expressed in many strains of E. Coli to produce indigo dye. In the presence of indole and oxygen, FMO can catalyze the addition of a hydroxyl group to indole generating the intermediate indoxyl. Indoxyl then naturally oxidizes to generate indigo which, due to its hydrophobicity, crashes out of solution. The part submitted is the ORF of FMO only.
Sequence and Features
- 10COMPATIBLE WITH RFC[10]
- 12COMPATIBLE WITH RFC[12]
- 21INCOMPATIBLE WITH RFC[21]Illegal BamHI site found at 1369
- 23COMPATIBLE WITH RFC[23]
- 25COMPATIBLE WITH RFC[25]
- 1000COMPATIBLE WITH RFC[1000]
SZU-China 2020 iGEM TEAM
1.Species Source
In order to better characterize the bacterial flavin-containing monooxygenase (bFMO) documented by BBa_1131000, we found many literature about FMO that are also from M. aminisulfidivorans. The species’current name is Methylophaga aminisulfidivorans MP, and in some early literature it may be named as Methylophaga aminisulfidivorans SK1. Its taxonomy ID in NCBI is 1026882.
2.Experimental Characterization
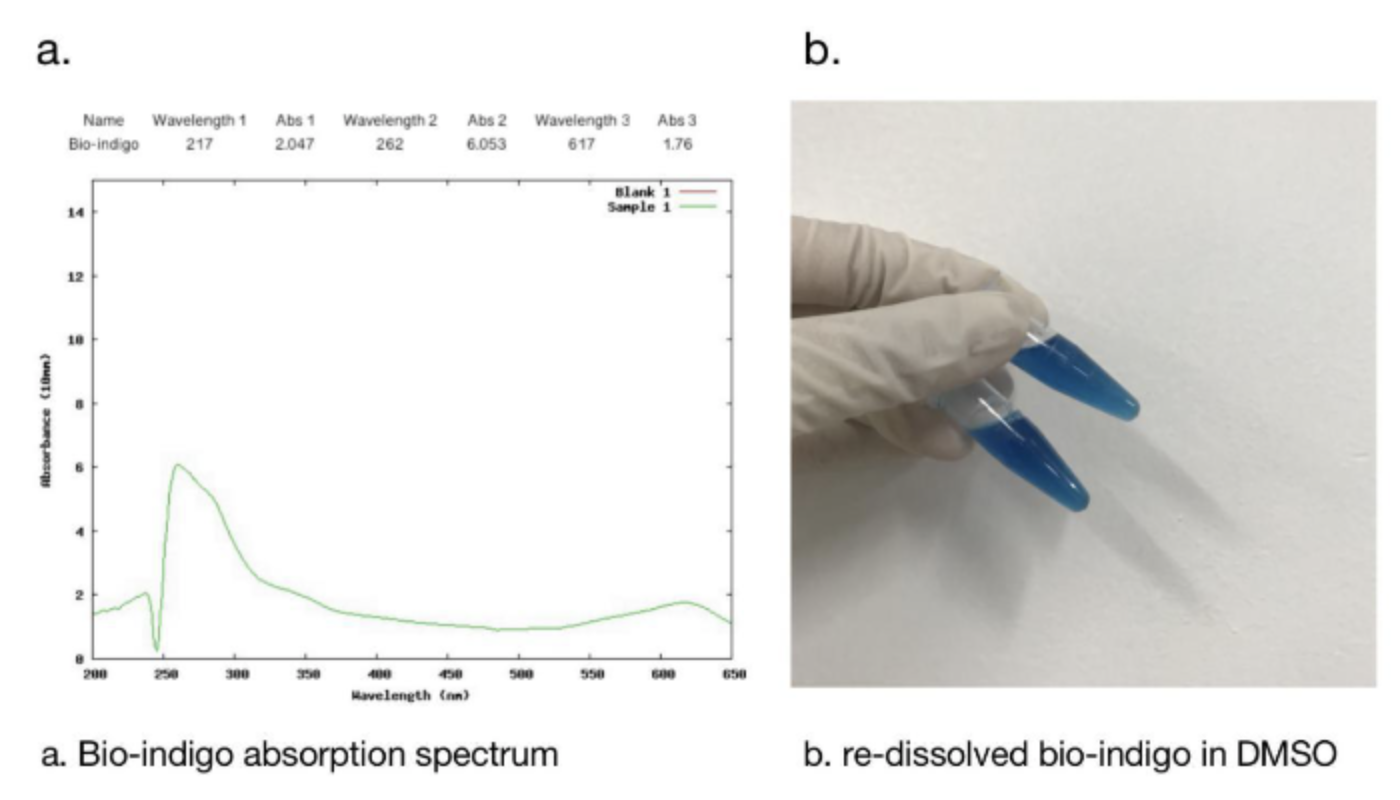
2.1 Bio-indingo Absorption Spectrum
We used DMSO for resolubilization, and bio-indigo had an obvious absorption peak at 617nm, which was the same as that recorded in the literature. And the pigment is clearly blue in daylight.
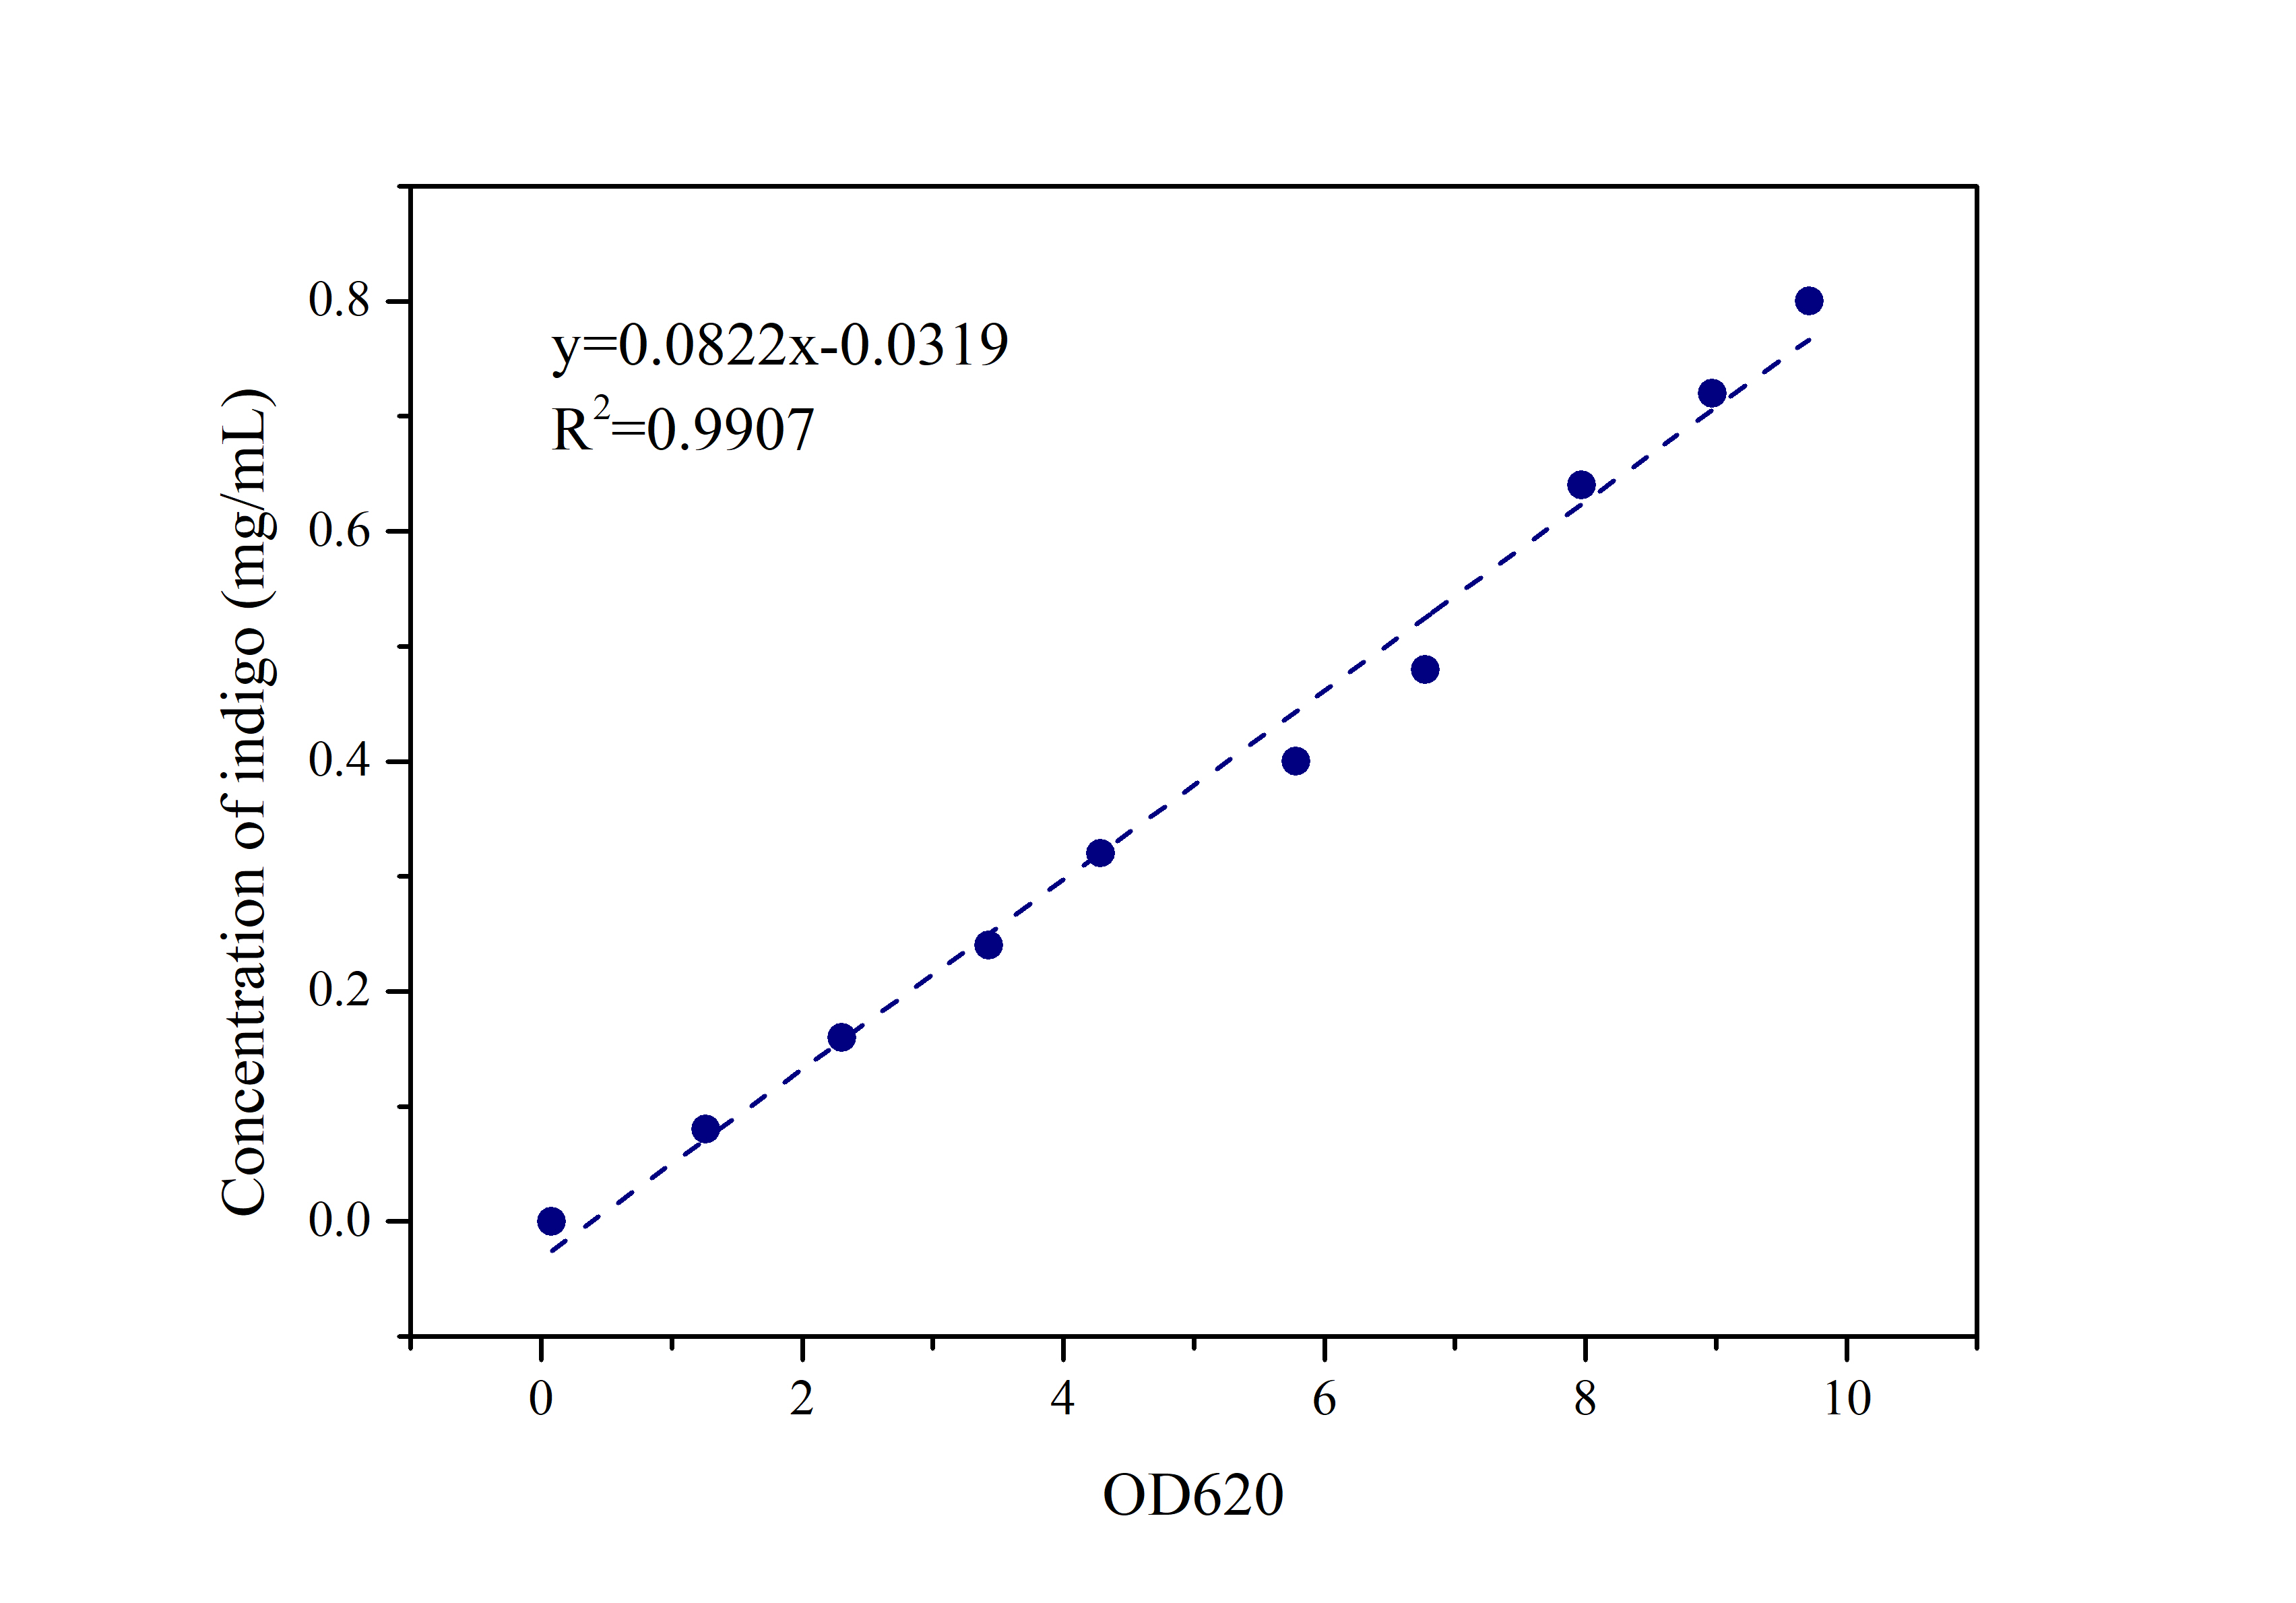
2.2 Standard Curve of Indigo
Prepare indigo standard samples with sample concentrations of 0.8mg/ml, 0.72mg/ml, 0.64mg/ml, 0.48mg/ml, 0.4mg/ml 0.32mg/ml, 0.24mg/ml, 0.16mg/ml, 0.08mg /ml, 0mg/ml, measure the absorbance at 620 nm with an ultraviolet-visible spectrophotometer, and draw a standard curve.
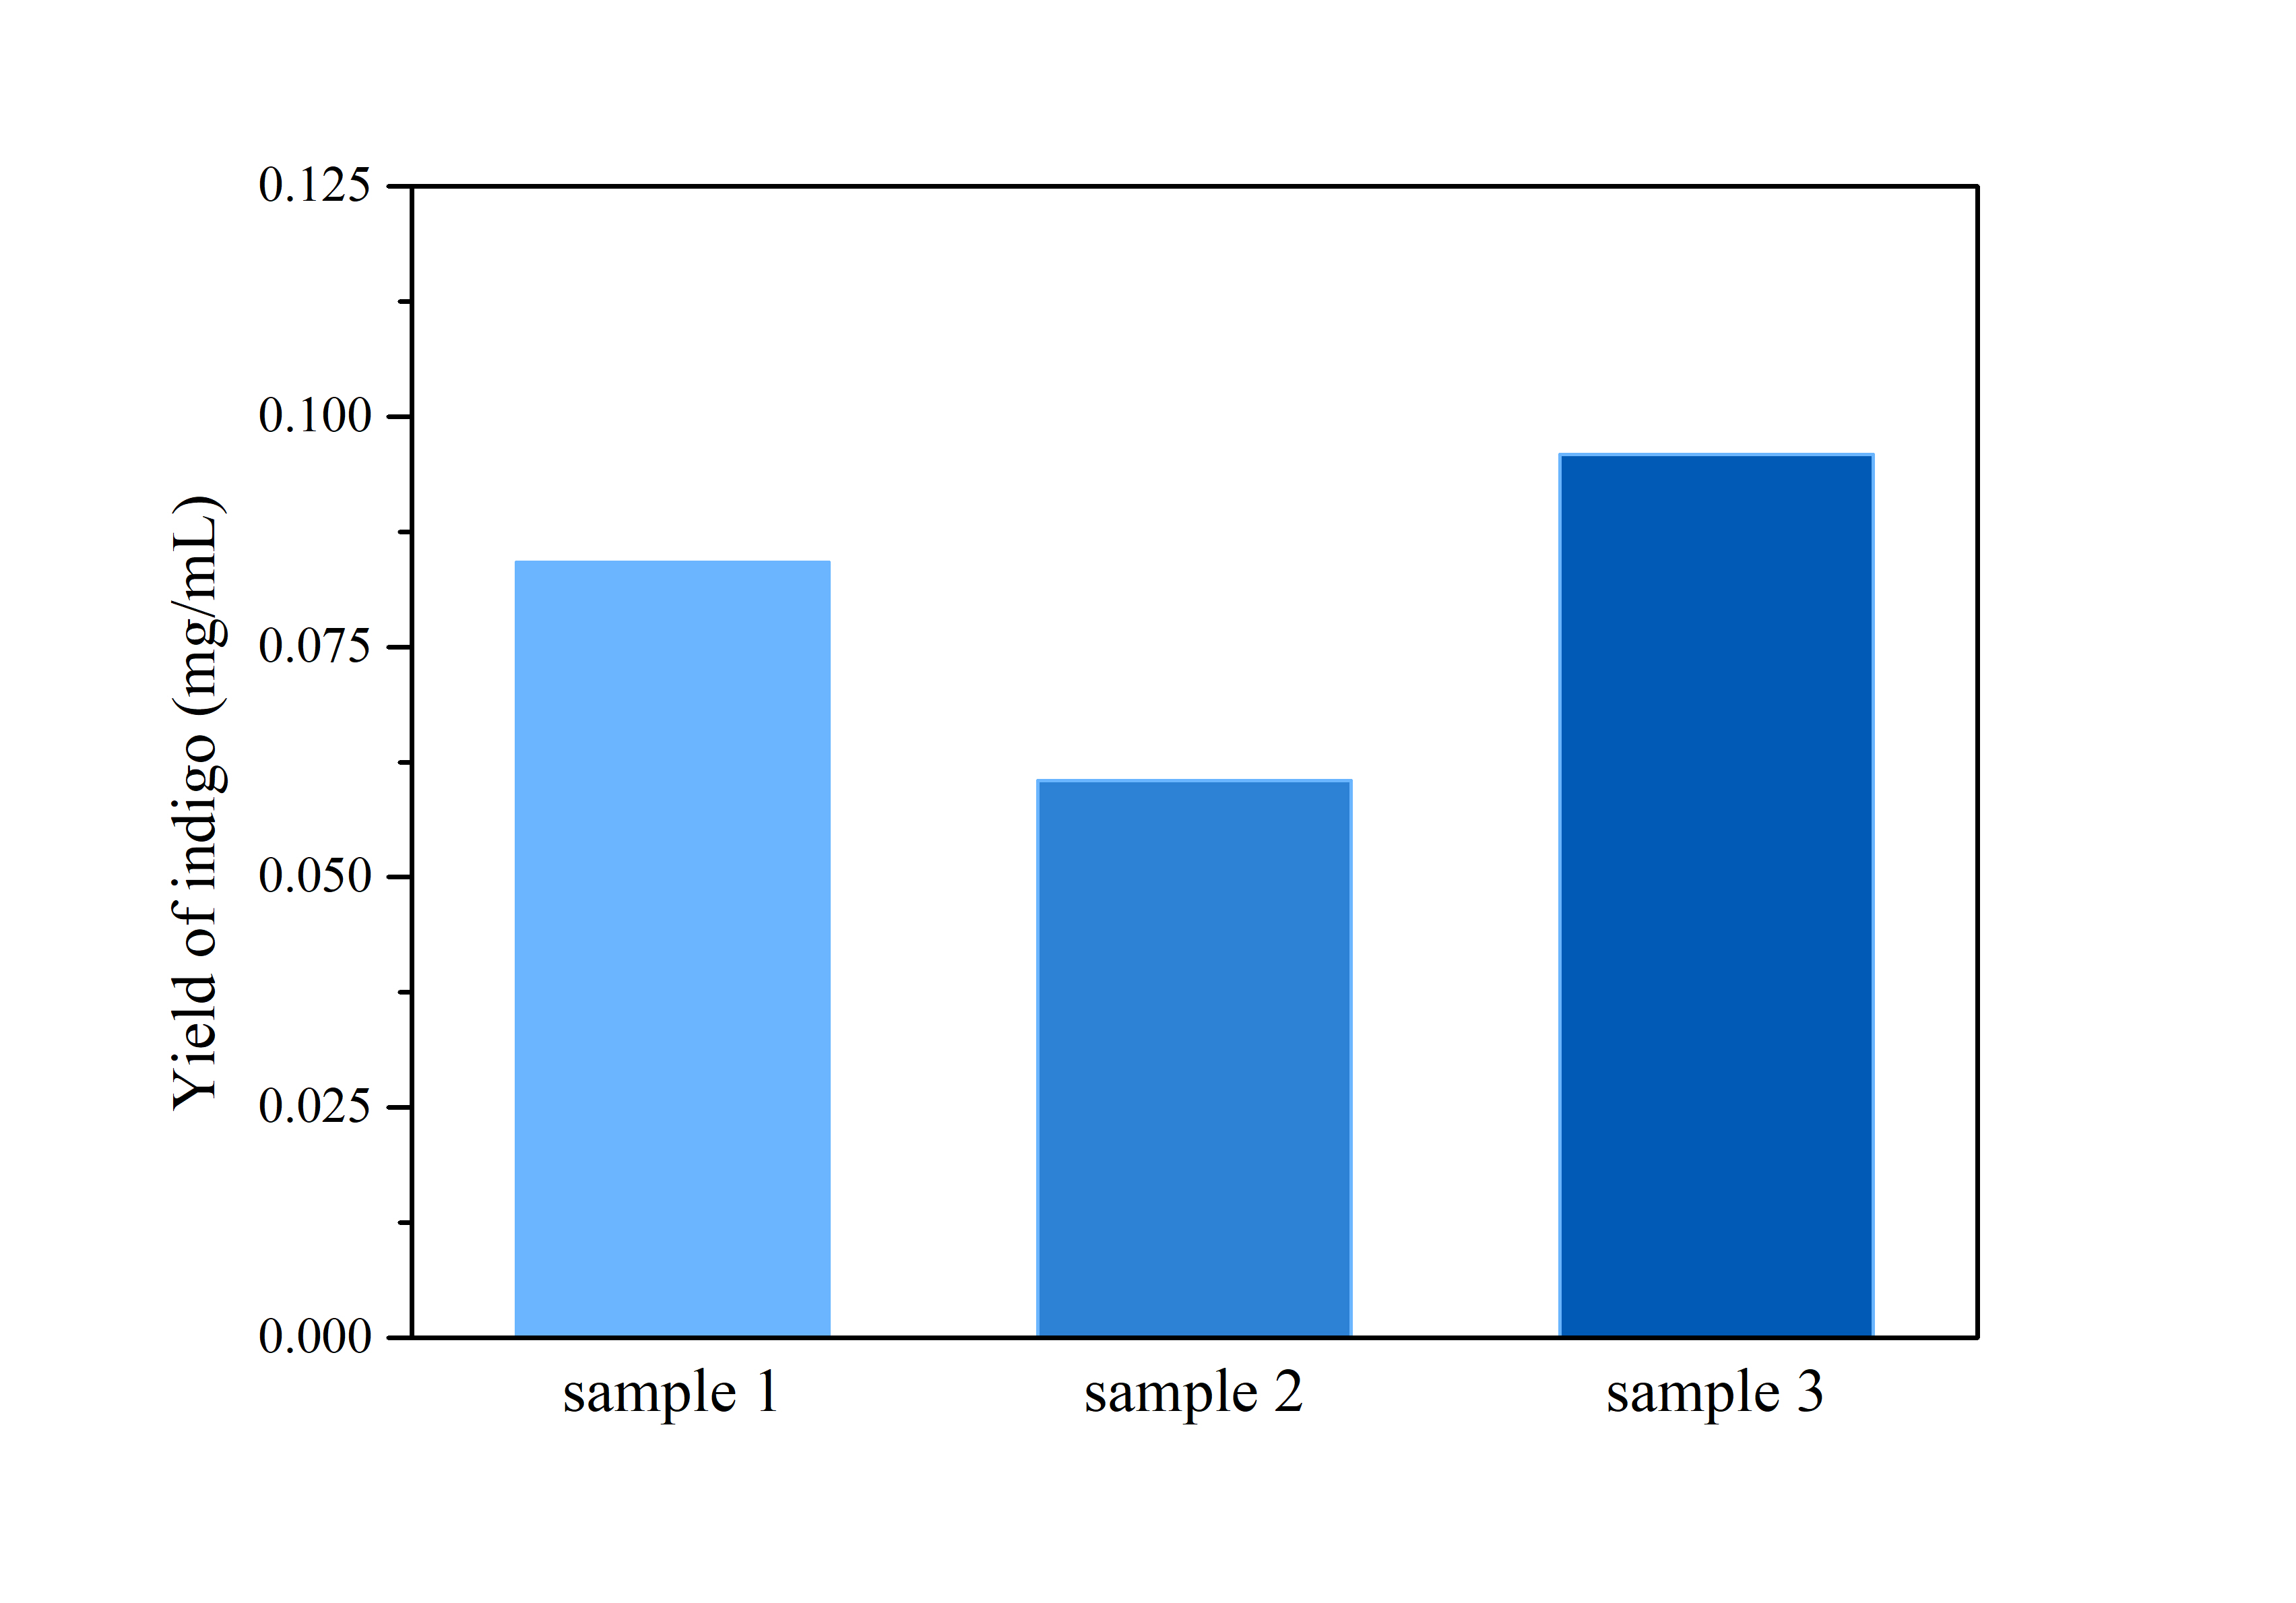
2.3 Determination of Bio-indigo
ProductionThe cells were harvested by centrifugation at 110,000 rpm for 5 mins, after which the supernatant was removed and the precipitation was rinsed by distilled water twice.
Then, the cell pellet was resuspended by dimethyl sulfoxide (DMSO), and tested by ultraviolet-visible spectrophotometer UV-2250 for optical density at 620 nm.
Compare the data obtained in the experiment with the standard curve of the indigo sample to determine the indigo production.
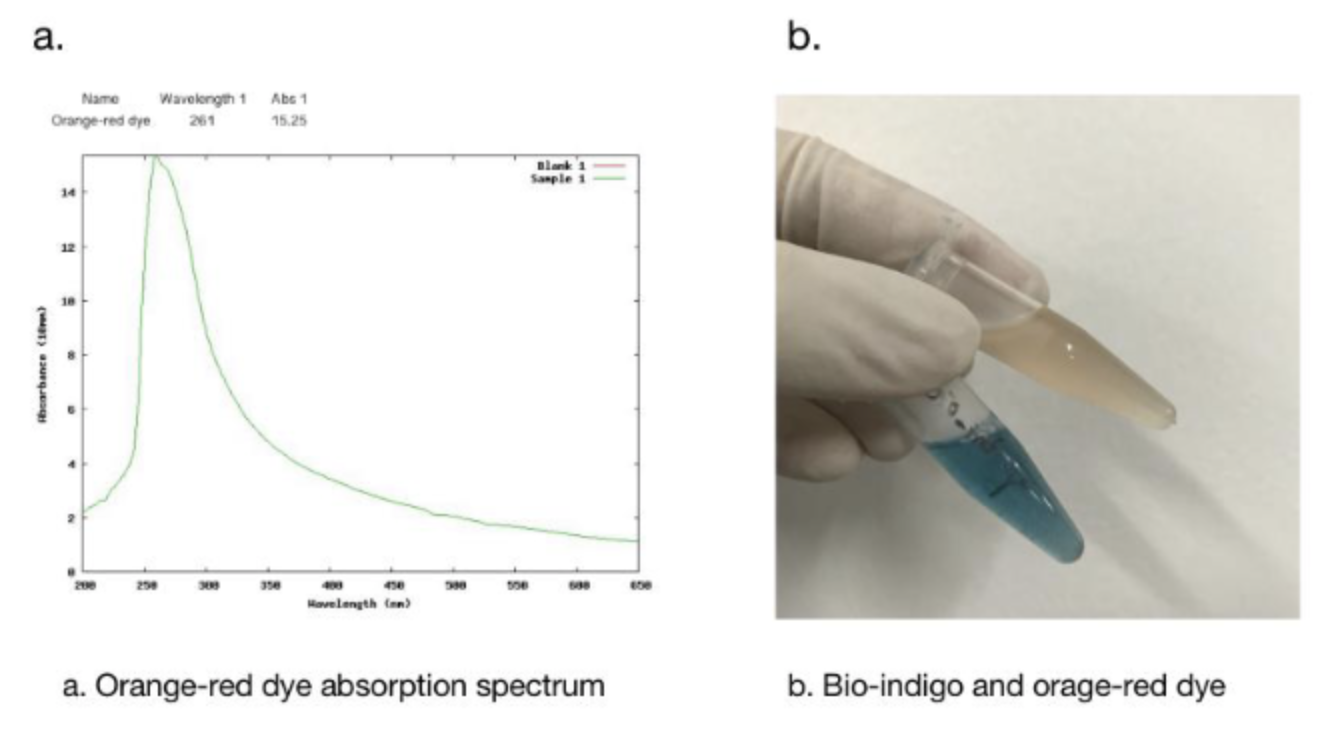
In addition, we got the unexpected orange-red dye in the fermentation product. After we contacted with SHANGHAI_SFLS_SPBS, we found that this phenomenon also happened in their experiments. After consulting the literature, we found that this may be due to the production of isatin, which is obtained by oxidation of indigo. It is preliminarily speculated that this is due to the overexpression of FMO, which caused the indigo to be further oxidized into isatin.
3.Documentary Characterization
3.1 Background
FMO
Flavin-containing monoocygenases (FMOs) are first discovered in rat liver microsomes, and are usually found in eukaryotes. The amount of enzyme present in different tissues varies with species and sex, but the highest concentration is usually found in the liver. FMOs are involved in a wide range of oxidative biological processes, including drug detoxification, xenobiotic metabolism and bio-catalytic synthesis by catalyzation of the oxygenation of many nitrogen-, sulfur-, phosphorous-, selenium-, and other nucleophilic heteroatom.
In the literature in 2003, Choi, H.S.et alcloned the first discovered bacterial FMO from a methylotrophic bacterium they isolated from the seawater at Mokpo, Korea [1]. And they named the new species Methylophaga aminisulfidivorans SK1. It grows on methanol, methylated amines, and dimethylsulfide but not on methane. Fructose and glucose are the only multicarbon compounds tested that can be used as growth substrates.
They isolated and cloned a gene of Methylophaga aminisulfidivorans SK1 whose presence in E.coli produced blue dye indigo. The deduced amino acid sequence from the gene showed approximately 30% identities with FMOs of human (FMO1-FMO5). Its biochemical properties such as substrate specificities and absorption spectra were similar to the eukaryotic FMO families. Thus, Hack Sun Choi et al assigned the enzyme to be a bacterial FMO. And the nucleotide sequence of the bacterial fmo gene has been deposited in the GenBank database under Accession No. AF494423.
We used Clustal X to compare the nucleotide and amino acid sequence of FMOfrom the reference with that from BBa_1131000. We found that they have the same amino acid sequence, except for the redundant two amino acids, GS, on the C terminus of bFMO from BBa_1131000. But they have different DNA sequence with 77% identities.
Indigo
The use of indigo can date back to 6,000 years ago. It has been a prevalent dye contributing to the signature tone of blue denim. Indigo have a special way for dying. As indigo is insoluble, it have to be reduced to leuco-indigo for dying. And leuco-indigo can absorbs into fabric while diping and then rapidly oxidized to insoluble indigo after aeration. Thus, indigo can dye cotton without covalent bonds. Indigo as a dye has its own unique properties that’s irreplaceable. While absorbed indigo is robust to detergent for laundering contributing to durability, it is also susceptible to abrasion generating special fraying effect.
Historically, indigo was extracted form dye-producing plants, such as Indigofera sp.and Polygonum tinctorium. Due to the limited production of indigo extracted from plants, traditional extraction technology was rapidly replaced by the emergent chemical synthethic way in 19th. However, chemical synthetic way of indigo pose a serious threat to the environment, as it need toxic raw materials like aniline derived from petroleum, and hazardous chemical for processing, like reducing agent, formaldehyde, hydrogen cyanide, sodamide, and strong base.
Enduring high demand for indigo stimulate the emergence of the much more sustainable way for generating indigo, which appears to be synthesizing heterologous bio-indigo via fermentation.
3.2 bFMO Characteristics
3.2.1 Catalytic Mechanism of FMO
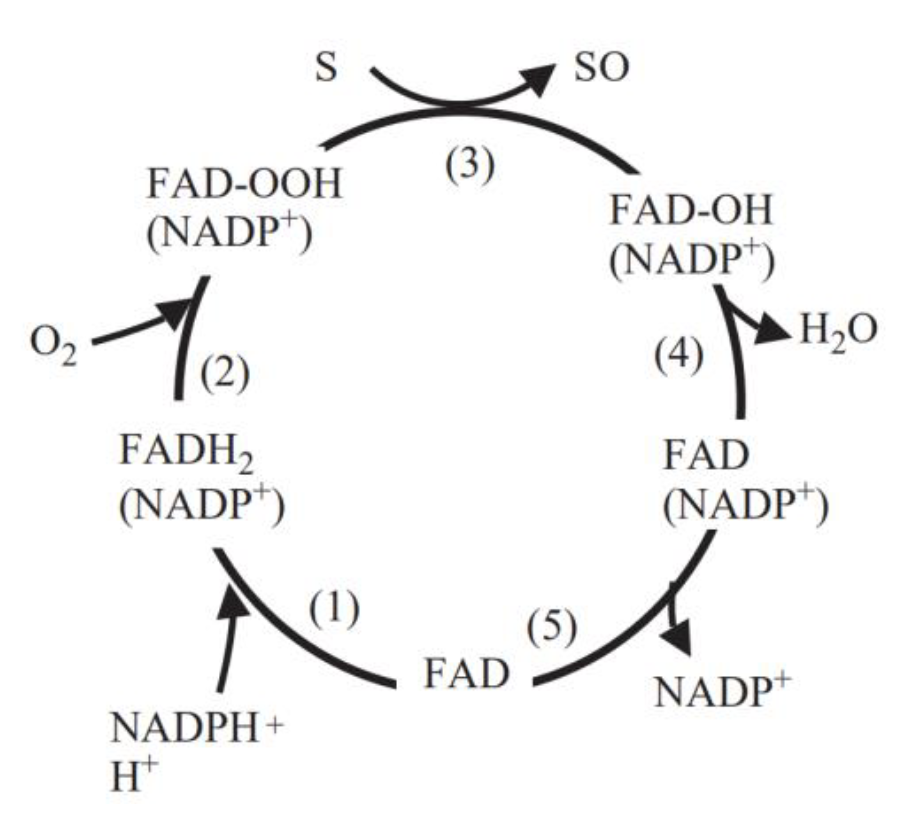
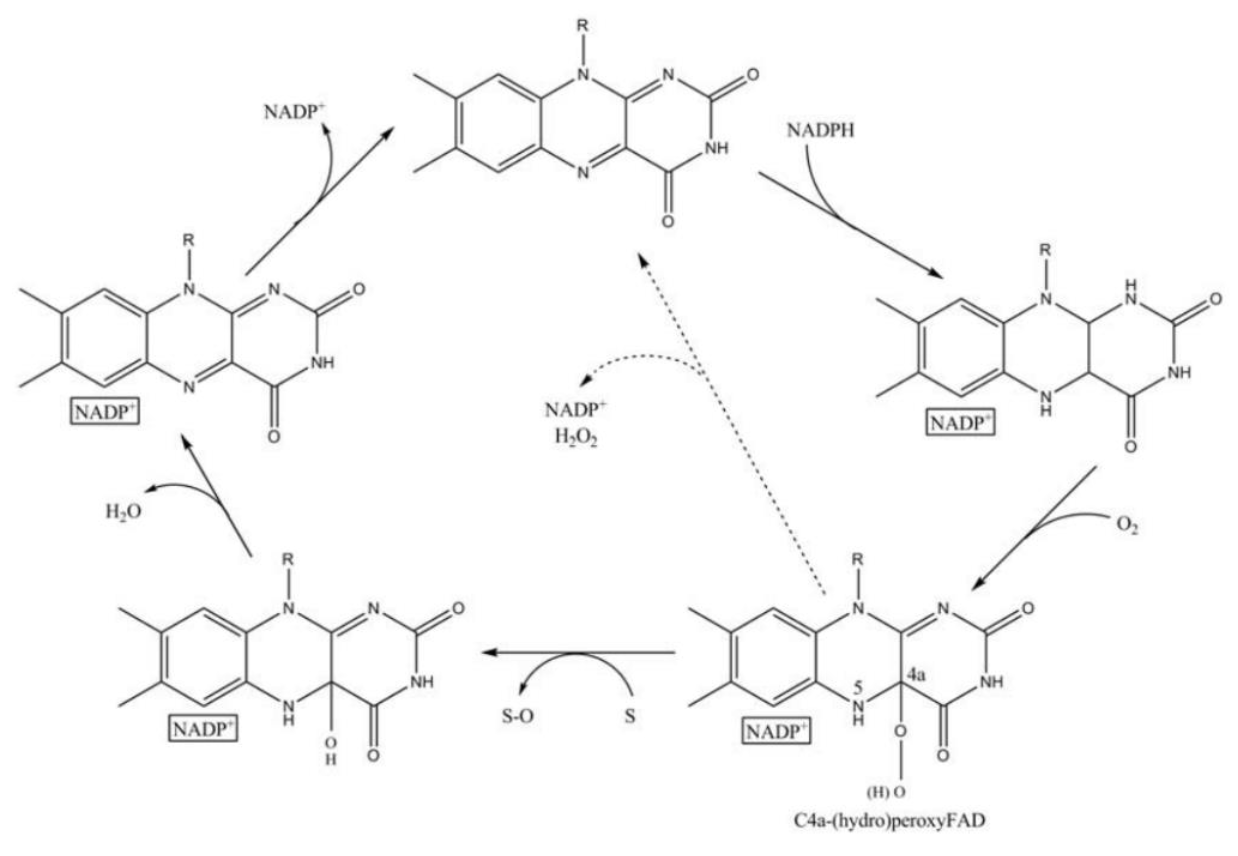
FMO belongs to a class of monooxygenases capable of generating a stable C4a peroxyflavin intermediate. In the first step of the catalytic cycle, FAD undergoes 2-electron reduction by NADPH (Fig. 5). The reduced flavin reacts rapidly with molecular oxygen to form the peroxyflavin and it is in this state, that FMO may exist predominantly in the cell, waiting for a suitable nucleophile with which to react. The nucleophilic attack by the substrate on the FADOOH results in 1 atom of molecular oxygen being transferred to the substrate and 1 atom to form water. The rate-limiting steps in the catalytic cycle are thought to be the breakdown of the FADOH psuedobase or the release of NADP+ . In either case, it is important to note that, unlike the CYP monooxygenase system, substrate binding has no influence on Vmax[2].
And the most special aspect in this catalytic cycle is that the presence of NADP+ is of critical importance to the stability of the intermediate, and it can keep binding to the enzyme before it finally release at the final step[3]. Binding of NADP can prevent enzyme from being oxidized by NADPH oxidase (Fig. 6).
3.2.2 Biochemical Characteristics of bFMO
In terms of substrate specificity, many substances can serve as good substrates of FMO, including trimethylamine, methiazole, nicotine, N, N-dimethylaniline and indoles, among which the substrate trimethylamine has the highest catalytic efficiency.
The gene encodingthe first discovered bacterial FMO was originally cloned from Methylophaga aminisulfidivorans SK1 [1], and was responsible for producing, the blue pigments, the blue indigo. The complete reading frame was1371bp long, which encodes a protein of 456 amino acids. The molecular mass of the encoded protein was 105 kDa, consisting of homodimer of 54kDa with an isoeletric point of 5.14. It contained 3characteristic sequence motifs of FMOs: FAD binding domain, FMO-identifying suquence motif, and NADPH binding domain.
FMOs of all mammals have strong binding to the cell membrane, and have low water solubility. Thus, up to now no mammalian FMO crystal structure has been obtained. Compared to eukaryotic FMOs, prokaryotic FMOs are more suitable for the construction of genetically engineered strains and can be better used in biocatalytic production. So its beyond dispute that bFMO has a promising future in bio-synthetic fiel.
3.2.3 Involvement in Bio-indigo Synthesis
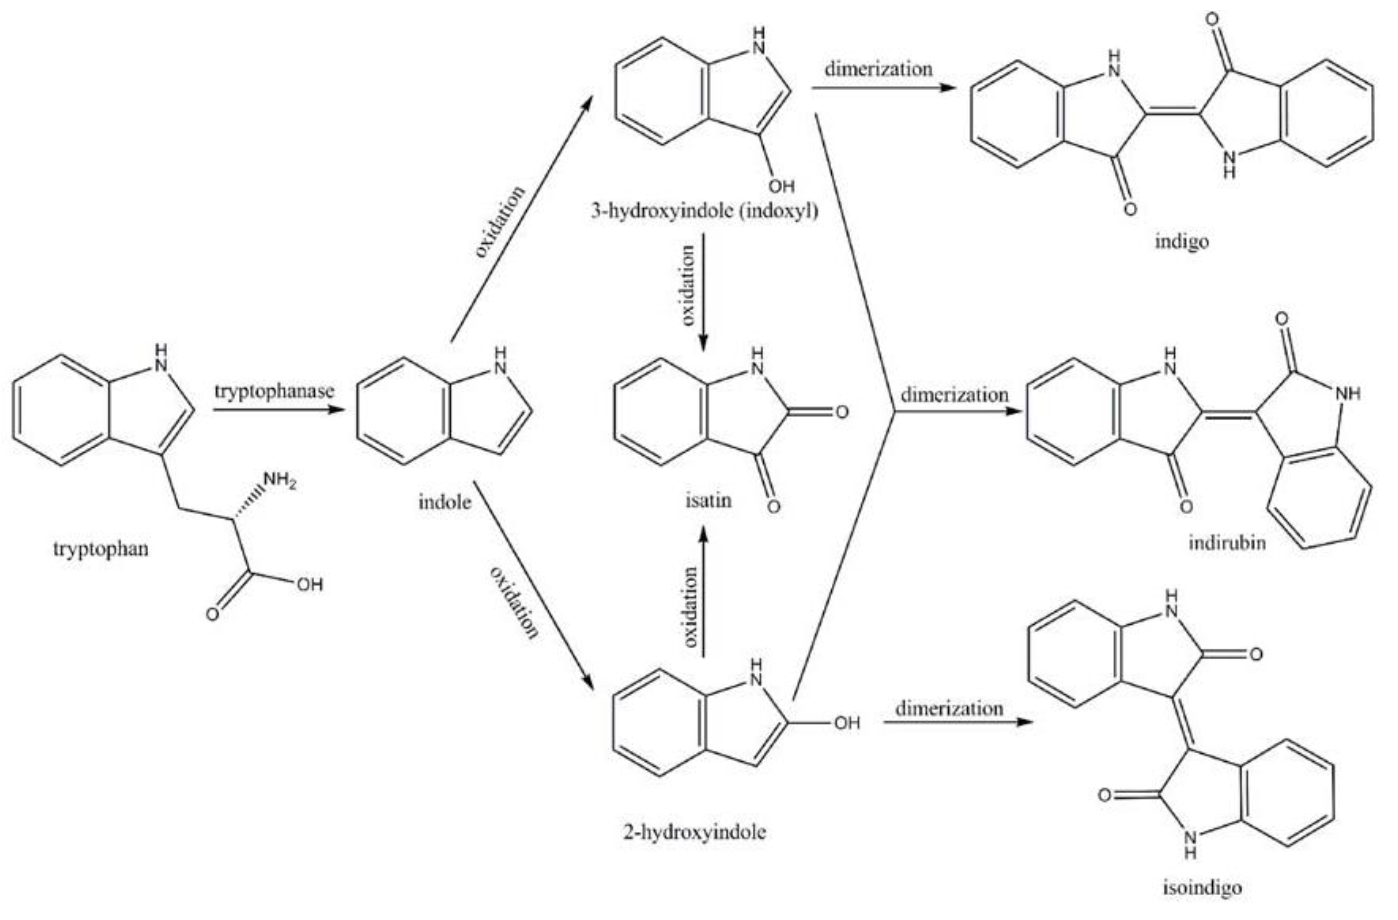
Amodifiedsyntheticpathway for severalindigoidcompounds inthe recombinant E. coli containing FMO(AF494423)is representedin Fig. 7. In a tryptophan rich condition, extracellular tryptophanis transported into the cell by tryptophan permease and thereafterconverted into indole, pyruvate, and ammonia by tryptophanase(TnaA; EC4.1.99.1). FMO catalyzes thehydroxylation of indole to 2-hydroxyindole and 3-hydroxyindoleby using the reducing power of NADPH in the presence of oxygen. In the non-enzymatic reaction, indigo is producedfrom the combination of two 3-hydroxyindole molecules, whereasindirubin is made from the dimerization of 2-hydroxyindole and3-hydroxyindole[4].
3.3 Relevant Documentary Experiment
Optimization to Increase Yield of Indigo
After finding the gene encoding bFMO in Methylophaga aminisulfidivorans MPT, the members in the team of Chosun University, including Si Wouk Kim, keep moving on to optimize the condition of fermentation for increasing bio-indigo production by recombinant E.coli harboring fmo gene.
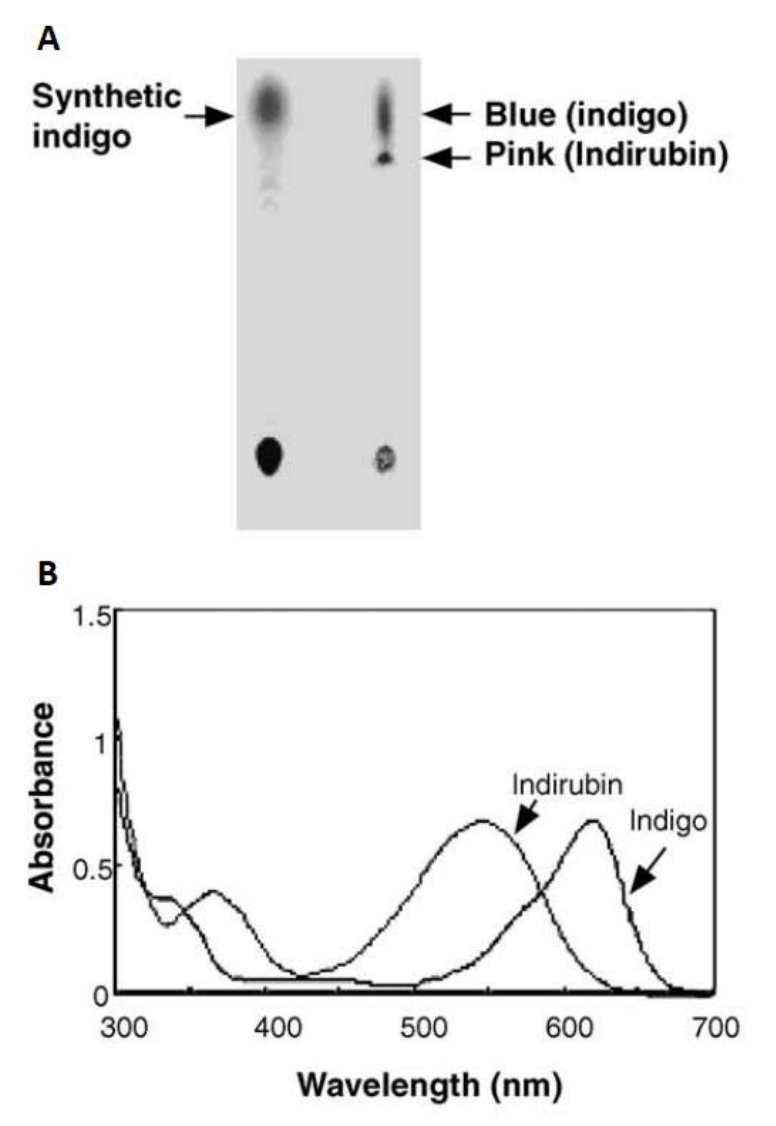
Initially in 2003, they constructed a plasmid pBlue 2.0 to express the fmo gene in E.coli, and achieved 160mg of indigo per liter in the trytophan medium (5 g yeast extract, 10 g NaCl, 2 g tryptophan per liter)supplementedwith ampicillin (50 lg/ml)after 12h cultivation at 37°C. The column purifiedblue pigments were analyzed by silica gel thin layer chromatography, and after migration the bacterial pigments separated into a predominant blue spot and a light pink spot (Fig. 8). To separate them, the mixture was injected into the HPLC (Waters) and fractionated by every 1 min at the wavelength of 620 nm. Two major active fractions were obtained with retention times of 8-11 and 15-18 min, respectively. The absorption spectra of blue and red fractions showed the highest absorption peaks at 620 and 540 nm (Fig. 8), corresponding to indigo and indirubin, respectively[1].
According to the literature of Si Wouk Kim et al in 2008, plasmid pBlue 2.0 consisted of a 2024 bp DNA fragments from Methylophaga aminisulfidivorans MPT, containing 651 bp upstream sequencesof fmo gene. To increase the production of indigo, they delete some of the upstream sequence and generate pBlue1.7 plasmid (1686bp) which proved to produce 575% increase in production of indigo, which is 920 mg per liter in optimum medium after 24h cultivation in fermentor. And the optimal medium was determined by using the response surface methodology, with tryptophan 2.4g/l, yeast extract 4.5 g/l and sodium chloride 11.4 g/l[5].
Protecting Group for Stabilizing Indoxyl
Even though microbial production of indigo can circumvents the use of harmful chemicals for synthesis, but a reducing agent is still required to reduce the insoluble indigo to the soluble form for dyeing.
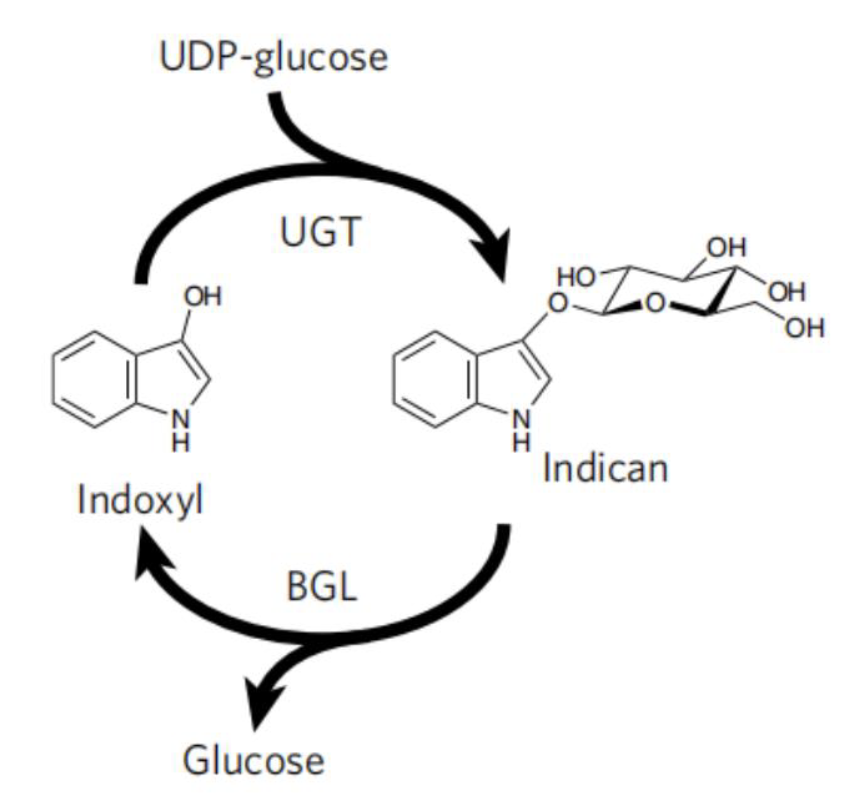
To avoid the use of reducing agent for dye solubilization, Tammy M.H. et al of University of California mimics the strategy employed by plant P.tinctorium[6]. This strategy utilize UDP-glycosyltransferase to glucosylates bio-synthetic indoxyl at the C3 hydroxyl group to form indican before its spontaneousair oxidation to indigo (Fig. 9). This glucoside, with glucose moiety as a biochemical protecting group is stable in air and can be stored. When dying, the protecting group canbe easily removed by using of beta-glucosidase, and generate indoxyl that can be oxidized to crystalline indigo in fibers after aeration. This brilliant strategy is a promising way for making up the deficiency in the sustainable scheme for bio-indigo production.
BJU-China 2021 iGEM TEAM
Description
In order to produce Tyrian purple,our team used flavin-containing monooxygenase (FMO) documented by BBa_1131000 in E.coli BL21(DE3).
MaFMO is flavin-containing monooxygenase from Methylophaga aminisulfidivorans, which could produce indigo dye in E.coli. In our project, we used MaFMO as part of the tyrian purple ( 6,6'-dibromoindigo, 6BrIG) metabolic pathway. During the production from Trp to 6BrIG, the MaFMO enzyme oxidizes 6Br-Indole to 6,6-dibromoindigo.
Experiment
We designed MaFMO to be expressed under the control of T7-LacO inducible promoters(Fig.2). The sequence of MaFMO was obtained by cloning from iGEM kit using PCR (Fig.3), and we constructed the gene into pET28b plasmid initiated with IPTG induction.
The constructed plasmid was transformed to E. coli BL21(DE3)for protein expression as the following protocols.
 1. Single colony was inoculated into LB medium, and cultivated vernight at 37° as seed culture.
 2. The seed culture was inoculated into LB medium as 1:100, and IPTG were added at 0h respectively. The concentration of IPTG was 0, 0.1, 1, 5mM.
 3. The mixtures above were incubated in different temperatures (18℃,30℃,37℃) for MaFMO expression.
 4. The cells were collected by centrifugation at 4000g for 10min and resuspended in lysis buffer after 20 h induction.
 5. The cell soup was disrupted by ultrasonication in ice-chilled water.
 6. The soluble fractions were collected by centrifugation of the cells lysate at 10000g for 30min.
 7. The soluble fraction of lysates were loaded for SDS-PAGE detection.
Results and analysis
The following image (Fig.4) shows the results obtained from the SDS-PAGE. From the results, we can clearly observe the MaFMO protein band (the position indicated by the arrow, about 53.1 kDa). The uninduced controls (0mM) without IPTG were expected not to show bands if the promoter lacked leakiness; however, a faint band can be seen for all controls. Bands corresponding to 0.1 and 1 mM IPTG for all temperatures show stronger bands compared to 1mM, that may due to high IPTG concentration affect cell growth. When comparing temperatures, incubation at 30°C and 37°C clearly yield a slightly more protein expression amount of MaFMO, but yields similar amounts of expression between IPTG concentrations.
After induction, we performed the 6Br-Indole reaction to synthesize 6BrIG. We mixed the induced TnaA-MaFMO E. coli into NPB (50mM pH=8.0) buffer after centrifugation, added glucose to 0.6% (ω/V) resuspended until the OD600=2.0 of the solution, added 6Br-Indole to a concentration of 1mM in the solution, and shaken the bacteria at 30℃, 200rpm for 6h. The final 6BrIG production was obtained. solution 1.
From the figure, it can be found that the solution after the reaction has a distinct purple color compared to the unreacted E. coli solution.
Reference from: BRENDA database
Reference
[1]Choi, H.S., et al., A novel flavin-containing monooxygenase from Methylophaga sp. strain SK1 and its indigo synthesis in Escherichia coli. Biochemical and Biophysical Research Communications, 2003. 306(4): p. 930-936.
[2]Krueger, S.K. and D.E. Williams, Mammalian flavin-containing monooxygenases: structure/function, genetic polymorphisms and role in drug metabolism. Pharmacol Ther, 2005. 106(3): p. 357-87.
[3]Zhenxuan, W., Cloning, expression and the catalytic mechanism research of a bacterial flavin-containing monooxygenase. Shanghai Jiao Tong University, 2011.
[4]Han, G.H., et al., Enhanced indirubin production in recombinant Escherichia coli harboring a flavin-containing monooxygenase gene by cysteine supplementation. J Biotechnol, 2012. 164(2): p. 179-87.
[5]Han, G.H., H.-J. Shin, and S.W. Kim, Optimization of bio-indigo production by recombinant E. coli harboring fmo gene. Enzyme and Microbial Technology, 2008. 42(7): p. 617-623.
[6]Hsu, T. M.et al., Employing a biochemical protecting group for a sustainable indigo dyeing strategy. Nat Chem Biol, 2018. 14(3):p. 256-261

