Difference between revisions of "Part:BBa K2571005"
Farnazsedghi (Talk | contribs) (→gshF Gene and GSH Biosynthesis) |
|||
| (27 intermediate revisions by 2 users not shown) | |||
| Line 3: | Line 3: | ||
<partinfo>BBa_K2571005 short</partinfo> | <partinfo>BBa_K2571005 short</partinfo> | ||
| − | + | <!-- Add more about the biology of this part here --> | |
| + | |||
| + | ===Usage and Biology=== | ||
Glutathione (GSH) is an important antioxidant that has a sulfur compound; a tripeptide composed of three amino acids (cysteine, glycine and glutamic acid) and a non-protein thiol (Pizzorno, 2014; Lu, 2013). GSH is generally found in the thiol-reduced from which is crucial for detoxification of ROS and free radicals which cause oxidative stress (Lu, 2013; Burton & Jauniaux, 2011). | Glutathione (GSH) is an important antioxidant that has a sulfur compound; a tripeptide composed of three amino acids (cysteine, glycine and glutamic acid) and a non-protein thiol (Pizzorno, 2014; Lu, 2013). GSH is generally found in the thiol-reduced from which is crucial for detoxification of ROS and free radicals which cause oxidative stress (Lu, 2013; Burton & Jauniaux, 2011). | ||
| Line 12: | Line 14: | ||
<b>Source: </b> | <b>Source: </b> | ||
| − | Gene: GSH | + | <strong> Gene: </strong> GSH |
| − | Protein: Bifunctional gamma-glutamate cysteine ligase | + | |
| − | Organism: Streptococcus Thermophilus (SIIM B218) | + | <strong> Protein:</strong> Bifunctional gamma-glutamate cysteine ligase |
| + | |||
| + | <strong> Organism:</strong> <i> Streptococcus Thermophilus </i> (SIIM B218) | ||
| + | |||
| + | |||
| + | |||
| + | [[File:METU_HS_Ankara GSH 3D model.gif|600px|thumb|center|3D protein structure of Bifunctional gamma-glutamate-cysteine ligase, METU_HS_Ankara, 2018]] | ||
| − | |||
Figure represents the predicted three-dimensional structure Bifunctional gamma-glutamate-cysteine ligase from <i> Streptococcus Thermophilus </i>. The protein structure of Bifunctional gamma-glutamate-cysteine ligase was constructed by using Amber 14. It is demonstrated in the ribbon diagram which is done by interpolating a smooth curve through the polypeptide backbone. The colors indicate the amino acids in the protein structure. While constructing, the codon bias rule is obeyed to express the enzyme in <i> Escherichia Coli </i> KO11. | Figure represents the predicted three-dimensional structure Bifunctional gamma-glutamate-cysteine ligase from <i> Streptococcus Thermophilus </i>. The protein structure of Bifunctional gamma-glutamate-cysteine ligase was constructed by using Amber 14. It is demonstrated in the ribbon diagram which is done by interpolating a smooth curve through the polypeptide backbone. The colors indicate the amino acids in the protein structure. While constructing, the codon bias rule is obeyed to express the enzyme in <i> Escherichia Coli </i> KO11. | ||
| − | <b>Our | + | |
| + | ===gshF Gene and GSH Biosynthesis=== | ||
| + | |||
| + | |||
| + | |||
| + | <b> Group: </b>iGEM20_UNSW_Australia | ||
| + | |||
| + | <b> Author: </b>iGEM20_UNSW_Australia | ||
| + | |||
| + | <b> Summary: </b>As part of our project this year, the UNSW Australia team had a plan to increase the thermal tolerance of corals by introducing Small Heat Shock proteins (sHSP) as well as glutathione into the corals' symbiont, Symbiodinium. However, due to the challenges posed by the COVID-19 situation, we were only able to carry out laboratory work for sHSPs within an E. coli chassis. Therefore, we decided to add informational documentation for gshF gene and glutathione biosynthesis. Our documentation of glutathione expands on the work presented in Part:BBa_K2571005 by iGEM18_METU_HS_Ankara team. This information can be used for future iGEM teams to further build upon the application of the gshF in glutathione synthesis in industry and hence, increase the resistance of engineered cells to reactive oxygen species. | ||
| + | |||
| + | |||
| + | Present in its reduced (thiol) form, Glutathione (GSH) is a ubiquitous primary antioxidant which prevents the oxidation of biological molecules, such as proteins and enzymes, by donating its electrons to reactive oxygen species (Wang et al. 2019). Enzymatic synthesis and fermentation are the two processes that GSH is currently produced from. The intracellular synthesis of GSH is mediated by two ATP-dependent reactions which are catalysed by 𝛾-glutamylcysteine Synthetase (𝛾-GCS) (reaction 1) and Glutathione Synthetase (GS) (reaction 2). 𝛾-GCS and and GS are encoded by two different genes in most cells, the gshA and gshB genes, respectively. Since the activity of 𝛾-GCS is regulated by the feedback inhibition of GSH, over-accumulation of this antioxidant in the cell is not possible, thus, glutathione production is limited (Li et al. 2011). To improve the situation, a number of methods have been studied in one of which the exposure of cells to low pH resulted in secretion of GSH out of the cell and hence, less inhibition feedback on 𝛾-GCS activity (Liang, Du & Chen, 2008). A number of microorganisms, including Streptococcus thermophilus, have been found to have both 𝛾-GCS and GS encoded by a single gene, gshF. This gene codes a bifunctional enzyme in which its N-terminal sequence resembles 𝛾-GCS whereas its C-terminal sequence is similar to GS’s function. As a result, the activity of 𝛾-GCS is not inhibited and more GSH is produced, allowing the cell to have a higher threshold for reactive oxygen species without damaging any of its components (Li et al. 2011). | ||
| + | |||
| + | Due to its antioxidant nature, recombinant GSH expression has been explored as a means to increase yeast robustness for ethanol manufacturing from lignocellulosic feedstock. For cost-effective production, it is therefore imperative for high-yield, high-rate fermentation microbes. Previously, three homologous genes involved with GSH metabolism, GSH1, CYS3 and GLR1, were overexpressed which saw an increase in the robustness of Saccharomyces cerevisiae (Ask et al. 2013). However, the GSH feedback inhibition system posed a problem. To circumvent this, one study integrated the ribosomal DNA of S. cerevisiae with the GshF gene at a high copy number via the Cre-LoxP system (Qiu et al. 2015). The resulting yeast observed a three-fold increase in accumulated GSH leading to a greater tolerance to H2O2 (3mM), high temperatures (40℃), furfural (10mM), hydroxymethylfurfural (HMF - 10mM) and Cd+2 (0.5mM) concentrations compared to reference strains. From this, a product of two-fold higher ethanol concentration was achieved. However, yeast with higher thermotolerance is still required for a simultaneous saccharification (which occurs at 55℃) and fermentation process. Although the robustness of yeast can be improved via gshF, further means of increasing ROS resilience is a necessity for industrial biofuel production. | ||
| + | |||
| + | Although lacking an evaluation for ethanol production, a study by Tang presents an interesting method of increasing GSH production in yeast (Tang et al. 2015). This involves combining all three known biosynthesis pathways of GSH into one system - the first and second as explained previously (gshA/gshB and gshF) and the third utilising a side reaction from the proline synthesis pathway. For this, glutamate is converted to γ-glutamyl phosphate via γ-glutamyl kinase (Pro1). The substrate then reacts with cysteine to become γ-glutamylcysteine which is further conjugated with glycine via gsh2 to produce GSH. In the experiment, GshF from Actinobacillus pleuropneumoniae and Pro1 was expressed in S. cerevisiae. Additionally, two fusion proteins were constructed to mimic gshF’s two-step coupling efficiency; gsh2-gsh1 and Pro1-gsh2. The resulting W303-1b/FGP strain observed the highest GSH concentration at 216.50mg/L - a 2.19 fold increase compared to two-pathway strains. When amino acid precursors were introduced to shake flask cultures, a further 61.37% increase of GSH levels was observed. As such, this combinatorial strategy of GSH biosynthesis shows promise however requires evaluation as a feasible solution for increasing yeast robustness in applications such as ethanol production. | ||
| + | |||
| + | === Design Notes of GSH (BBa_K2571005) === | ||
| + | |||
Our circuit consists of prefix, a strong promoter (J23100), RBS (B0034), GSH as protein coding region, double terminator (B0015) and suffix. This part enables our E. coli KO11 strain to overexpress oxidised Glutathione to reduce oxidative stress, increasing its lifespan. (Lu, 2013) Our construct is inserted into pSB1C3 and delivered to the Registry. | Our circuit consists of prefix, a strong promoter (J23100), RBS (B0034), GSH as protein coding region, double terminator (B0015) and suffix. This part enables our E. coli KO11 strain to overexpress oxidised Glutathione to reduce oxidative stress, increasing its lifespan. (Lu, 2013) Our construct is inserted into pSB1C3 and delivered to the Registry. | ||
| − | [[File:METU_HS_Ankara GSH Composite.png| | + | |
| + | |||
| + | [[File:METU_HS_Ankara GSH Composite.png|800px|thumb|center| Circuit design of BBa_K2571005. Our construct includes a strong promoter,RBS, GSH and double terminator.]] | ||
| + | |||
| + | |||
In order to make our gene compatible with RFC 10, 25 and 1000, we reconstructed the nucleotides to get rid of the restriction sites while protecting the amino acid sequence. We looked through the codon bias property of E.coli and made the nucleotide changes accordingly. | In order to make our gene compatible with RFC 10, 25 and 1000, we reconstructed the nucleotides to get rid of the restriction sites while protecting the amino acid sequence. We looked through the codon bias property of E.coli and made the nucleotide changes accordingly. | ||
| − | |||
| − | [[File:METU HS Ankara GSH Gel.jpg| | + | [[File:METU HS Ankara GSH Effects.jpg|800px|thumb|center| Because Glutathione prevents the ROS from harming the bacteria, in high glutathione concentration increase in cell mass was observed. In brief, when glutathione concentration increases, the specific cell growth rate also increases and we observe increase in number of bacteria compared to the bacteria without GSH gene (Kim & Hahn , 2013).]] |
| + | |||
| + | |||
| + | |||
| + | |||
| + | |||
| + | |||
| + | |||
| + | === Characterization === | ||
| + | |||
| + | |||
| + | |||
| + | |||
| + | |||
| + | |||
| + | === Allergen Characterization: === | ||
| + | |||
| + | |||
| + | Our parts can be used in ethanol production and we used it in the lab for mass production, it was important to construct an allergenicity test. The allergenicity test makes a comparison between the sequences of the biobrick parts and the identified allergen proteins in the database. If the similarity between the biobricks and the proteins is high, it is more likely that the biobrick is allergenic. In the sliding window of 80 amino acid segments, greater than 35% means similarity to allergens. Higher similarity implies that the biobricks have a potential for negative effect to exposed populations. For more information on the protocol see the “Allergenicity Testing Protocol” in the following page http://2017.igem.org/Team:Baltimore_Bio-Crew/Experiments | ||
| + | |||
| + | Our biobrick part, BBa_K2571005 showed less than 35% match in the 80 amino acid alignments by FASTA. | ||
| + | |||
| + | === Gel Characterization: === | ||
| + | |||
| + | GSH composite part is inserted into the pSB1C3 backbone. The construct in pSB1C3 is for submission to the registry and is cultivated in DH5 alpha. | ||
| + | |||
| + | [[File:METU HS Ankara GSH Gel.jpg|600px|thumb|center|BBa_K2571005 check with GSH specific primers. Expected band length: 225 bp. Last six wells show positive results.]] | ||
| + | |||
| + | |||
We’ve inserted the GSH composite part to pSB1C3 backbone. Then, we’ve transformed the construct for submission, BBa_K2571005, (in pSB1C3) to DH5 alpha and conducted colony PCR. We’ve made the PCR with GSH specific primers and expected to see a result of 225 bp. PCR Results of our GSH part with GSH left and GSH right primers. By showing the band we expected, 225 bp, PCR confirmation for our insertion proved right. | We’ve inserted the GSH composite part to pSB1C3 backbone. Then, we’ve transformed the construct for submission, BBa_K2571005, (in pSB1C3) to DH5 alpha and conducted colony PCR. We’ve made the PCR with GSH specific primers and expected to see a result of 225 bp. PCR Results of our GSH part with GSH left and GSH right primers. By showing the band we expected, 225 bp, PCR confirmation for our insertion proved right. | ||
| Line 46: | Line 103: | ||
| − | < | + | === Biochemical Characterization: === |
| − | === | + | |
| + | |||
| + | We designed our biochemical characterization experiments in order to evaluate the effects of our circuits on life span, cell mass, and ultimately the bioethanol yield of ethanologenic E. coli strain KO11. We carried out two experimental assays simultaneously. | ||
| + | |||
| + | In both of our biochemical assays, we had four cultured groups of KO11 ethanologenic strains of E.coli to test. | ||
| + | |||
| + | |||
| + | 1. KO11 un-engineered, | ||
| + | 2. KO11 with only FucO, | ||
| + | 3. KO11 with only GSH, | ||
| + | 4. KO11 with Bio-E (both FucO and GSH). | ||
| + | |||
| + | |||
| + | |||
| + | |||
| + | <b> First Assay: </b> | ||
| + | |||
| + | |||
| + | |||
| + | [[File: METU_HS_Ankara_biochemical_assay.jpg|600px|thumb|center| Representation of our biochemical assay #1. ]] | ||
| + | |||
| + | |||
| + | |||
| + | Throughout our first assay, each group was grown in LB broth mediums containing 2% glucose and antibiotics. | ||
| + | |||
| + | To culture group #1 (KO11 un-engineered), we only added Chloramphenicol at a final concentration of 40 µg/mL since KO11 un-engineered only had resistance to Chloramphenicol in its genome; and to the mediums of the groups numbered 2, 3 and 4; we added Chloramphenicol at a final concentration of 40 µg/ml and 100 µg/ml Ampicillin. The reason was; groups 2, 3 and 4 had plasmids which carried Ampicillin resistance due to their backbone (pSB1A3). Thus, with the addition of antibiotics to the mediums, selectivity was assured. | ||
| + | |||
| + | Cultures were grown overnight, and refreshed in the morning as two sets (First set: 10 mM furfural, 2nd set: 20 mM furfural). After approximately two hours of incubation for both of the sets’ falcon groups (when they reached OD 0,6), furfural was added to their mediums. | ||
| + | |||
| + | |||
| + | <b> First Set (10 mM furfural): </b> | ||
| + | |||
| + | |||
| + | |||
| + | [[File: T--METU_HS_Ankara_results_fig20.jpg|600px|thumb|center| Falcon tubes containing the groups for our first assay, set #1.]] | ||
| + | |||
| + | |||
| + | |||
| + | We added furfural at a final concentration of 10 mM to the first four test groups’ mediums | ||
| + | and took OD measurements at Abs 600 nm with 1/10 dilution in 24 hour time intervals. | ||
| + | |||
| + | 10 mM furfural OD measurements: Abs 600 nm (1/10 dilution): | ||
| + | |||
| + | |||
| + | |||
| + | [[File:METU_HS_Ankara_biochemical_assay_tablo.jpg|500px|center|]] | ||
| + | |||
| + | |||
| + | |||
| + | |||
| + | [[File:T--METU HS Ankara assay 1 percentage.jpg|600px|thumb|center| Graph showing changes in cell mass of assay groups by percentage with respect to the time.]] | ||
| + | |||
| + | |||
| + | |||
| + | <b>Analysis of data:</b> | ||
| + | |||
| + | Our data demonstrated that group #1 (un-engineered) had a decrease in cell mass throughout the time verifying the inhibition of cell growth in the presence of furfural in the field. Group #2 (KO11 with only FucO) obviously gave better results with respect to un-engineered KO11. However, although the cell mass of the KO11 group with only FucO was stable in the first 48 hours, it was decreased after the 48th hour. This proves that only the presence of the gene FucO in the bacteria wasn’t enough to avoid cell mass decrease in the long term and is in need of another gene for increased tolerance. Also, only GSH’s presence isn’t enough since the group of KO11 with only GSH experienced decrease in cell mass. Group #4 (KO11 with Bio-E (both FucO and GSH)) gave measurement results as we hypothesized by continuing cellular growth in the first 48 hours and maintaining it even after the 48th hour, though at a lower rate. | ||
| + | |||
| + | |||
| + | |||
| + | <b> Second Set (20 mM furfural): </b> | ||
| + | |||
| + | |||
| + | |||
| + | [[File:T--METU_HS_Ankara_results_fig22.jpg|500px|thumb|center| Falcon tubes containing the groups for our first assay, set #2.]] | ||
| + | |||
| + | |||
| + | |||
| + | |||
| + | To gather more information to prove our hypothesis, we designed our second experimental set and added furfural at a final concentration of 20 mM to the four test groups’ mediums followed by OD measurements at Abs 600 nm with 1/10 dilution in 24 hour time intervals. | ||
| + | |||
| + | 20 mM furfural OD measurements: Abs 600 (1/10 dilution): | ||
| + | |||
| + | |||
| + | |||
| + | |||
| + | [[File:T--METU HS Ankara assay 2 table.jpg|400px|center|]] | ||
| + | |||
| + | |||
| + | |||
| + | For our second set, we could only obtain the measurements of the first 48 hours since we faced contamination in the last day of wet-lab and we had no more time. Thus, we modelled our second experimental set’s results by demonstrating the comparison of OD results at absorbance 600. | ||
| + | |||
| + | |||
| + | |||
| + | [[File:T--METU_HS_Ankara_results_fig23.jpg|600px|thumb|center| Graph showing change in OD of assay groups with respect to the time.]] | ||
| + | |||
| + | |||
| + | |||
| + | <b> Analysis of Data: </b> | ||
| + | |||
| + | Our data demonstrated that group #1 (KO11 un-engineered) had a decrease in cell mass as time passed. Group #2 (KO11 with only FucO) also experienced a decrease in cell mass. Group #3 (KO11 with only GSH) gave better results with respect to both of the groups #1 and #2 by maintaining its cell mass stable. Group #4 (KO11 with Bio-E (both FucO and GSH)) gave the most promising measurement data as we hypothesized by continuing cellular growth (almost doubling cell mass) in the first 48 hours. | ||
| + | |||
| + | |||
| + | |||
| + | <b> Second Assay: </b> | ||
| + | |||
| + | |||
| + | For our second characterization, we followed more of qualitative evaluation to see the inhibitory zone of furfural. Firstly, we prepared a solution of furfural at a final concentration of 20 mM by diluting the stock solution with distilled H2O. Then, we soaked filter paper discs in that solution and placed them on LB agar plates hosting the four groups of our assay. | ||
| + | |||
| + | |||
| + | [[File:T--METU_HS_Ankara_results_fig24.jpg|900px|thumb|center|Image of the plates right after filter papers soaked in furfural (20 mM) were placed.]] | ||
| + | |||
| + | |||
| + | |||
| + | After 48 hours, we’ve observed a clear zone around the filter paper of the group containing KO11 un-engineered while others weren’t inhibited as much. | ||
| + | |||
| + | |||
| + | |||
| + | |||
| + | [[File:T--METU HS Ankara assay resim 2 plate.jpg|350px|thumb|left|Plate having group KO11 un-engineered. | ||
| + | ]] | ||
| + | |||
| + | |||
| + | |||
| + | [[File:T--METU HS Ankara assay resim 3 plate.jpg|350px|thumb|right|Plate having group KO11 with only FucO.]] | ||
| + | |||
| + | |||
| + | |||
| + | [[File:T--METU HS Ankara assay resim 4 plate.jpg|350px|thumb|left|Plate having group KO11 with only GSH.]] | ||
| + | |||
| + | |||
| + | |||
| + | |||
| + | [[File:T--METU HS Ankara assay resim 5 plate.jpg|350px|thumb|right|Plate having group KO11 with Bio-E (FucO and GSH.)]] | ||
| + | |||
| + | |||
| + | |||
| + | <b> | ||
| + | |||
| + | |||
| + | |||
| + | |||
| + | |||
| + | |||
| + | |||
| + | |||
| + | |||
| + | |||
| + | |||
| + | |||
| + | |||
| + | |||
| + | |||
| + | |||
| + | |||
| + | |||
| + | |||
| + | |||
| + | |||
| + | |||
| + | |||
| + | |||
| + | |||
| + | |||
| + | |||
| + | |||
| + | |||
| + | |||
| + | |||
| + | |||
| + | |||
| + | |||
| + | |||
| + | |||
| + | |||
| + | |||
| + | |||
| + | |||
| + | |||
| + | |||
| + | |||
| + | |||
| + | |||
| + | |||
| + | |||
| + | |||
| + | |||
| + | |||
| + | |||
| + | |||
| + | |||
| + | </b> | ||
| + | |||
| + | <b> Conclusion: </b> | ||
| + | |||
| + | When the quantitative measurement data and qualitative phenotypic evaluation for all of our biochemical assays are considered, we can conclude that the groups containing KO11 un-engineered are the weakest ones against furfural toxicity; and neither the group of KO11 with only FucO nor the group with only GSH is resistant enough to continue cellular growth when furfural is present in the medium. Out of four groups, only the group containing KO11 with Bio-E (both FucO and GSH) can sustain its cellular growth and survive. Overall, we can infer that our best part design (Bio-E) was successful enough to combat the inhibitive effects of furfural, indicating trueness of our hypothesis. | ||
| + | |||
| + | |||
| + | |||
| + | |||
| + | |||
| + | === References === | ||
| + | |||
| + | Ask, M., Mapelli, V., Höck, H., Olsson, L., Bettiga, M. (2013) Engineering glutathione biosynthesis of Saccharomyces cerevisiae increases robustness to inhibitors in pretreated lignocellulosic materials. Microbial Cell Factories. 12:87 https://www.ncbi.nlm.nih.gov/pmc/articles/PMC3817835/ | ||
| + | |||
| + | Burton, G. J., & Jauniaux, E. (2011). Oxidative stress. Best Practice & Research. Clinical Obstetrics & Gynaecology, 25(3), 287–299. http://doi.org/10.1016/j.bpobgyn.2010.10.016 | ||
| + | |||
| + | Li, W., Li, Z., Yang, J. and Ye, Q., 2011. Production of glutathione using a bifunctional enzyme encoded by gshF from Streptococcus thermophilus expressed in Escherichia coli. Journal of biotechnology, 154(4), pp.261-268. https://doi.org/10.1016/j.jbiotec.2011.06.001 | ||
| + | |||
| + | Liang, G., Du, G. and Chen, J., 2008. Enhanced glutathione production by using low‐pH stress coupled with cysteine addition in the treatment of high cell density culture of Candida utilis. Letters in applied microbiology, 46(5), pp.507-512. https://doi.org/10.1111/j.1472-765X.2008.02352.x | ||
| + | |||
| + | Lu, S. C. (2013). GLUTATHIONE SYNTHESIS. Biochemica et Biophysica Acta, 1830(5), 3143–3153. http://doi.org/10.1016/j.bbagen.2012.09.008 | ||
| + | |||
| + | National Center for Biotechnology Information. PubChem Compound Database; CID=124886, https://pubchem.ncbi.nlm.nih.gov/compound/124886 (accessed July 18, 2018). https://pubchem.ncbi.nlm.nih.gov/compound/124886#section=Top | ||
| + | |||
| + | Patrick, L. (2003). Mercury Toxicity and Antioxidants: Part I: Role of Glutathione and alpha-Lipoic Acid in the Treatment of Mercury Toxicity. Alternative medicine review: a journal of clinical therapeutic.(7). 456-471. https://www.researchgate.net/publication/10980025_Mercury_Toxicity_and_Antioxidants_Part_I_Role_of_Glutathione_and_alpha-Lipoic_Acid_in_the_Treatment_of_Mercury_Toxicity | ||
| + | |||
| + | Pizzorno, J. (2014). Glutathione! Integrative Medicine: A Clinician’s Journal, 13(1), 8–12. https://www.ncbi.nlm.nih.gov/pmc/articles/PMC4684116/ | ||
| + | |||
| + | Qiu, Z., Deng, Z., Tan, H., Zhou, S. and Cao, L., 2015. Engineering the robustness of Saccharomyces cerevisiae by introducing bifunctional glutathione synthase gene. Journal of industrial microbiology & biotechnology, 42(4), pp.537-542. https://doi.org/10.1007/s10295-014-1573-6 | ||
| + | |||
| + | Tang, L., Wang, W., Zhou, W., Cheng, K., Yang, Y., Liu, M., Cheng, K. and Wang, W., 2015. Three-pathway combination for glutathione biosynthesis in Saccharomyces cerevisiae. Microbial cell factories, 14(1), p.139. https://doi.org/10.1186/s12934-015-0327-0 | ||
| + | |||
| + | Wang, Y., Li, H., Li, T., Du, X., Zhang, X., Guo, T. and Kong, J., 2019. Glutathione biosynthesis is essential for antioxidant and anti-inflammatory effects of Streptococcus thermophilus. International Dairy Journal, 89, pp.31-36. https://doi.org/10.1016/j.idairyj.2018.08.012 | ||
| + | |||
| + | |||
<!-- --> | <!-- --> | ||
Latest revision as of 12:17, 27 October 2020
Bifunctional gamma-glutamate-cysteine ligase/Glutathione synthetase
Usage and Biology
Glutathione (GSH) is an important antioxidant that has a sulfur compound; a tripeptide composed of three amino acids (cysteine, glycine and glutamic acid) and a non-protein thiol (Pizzorno, 2014; Lu, 2013). GSH is generally found in the thiol-reduced from which is crucial for detoxification of ROS and free radicals which cause oxidative stress (Lu, 2013; Burton & Jauniaux, 2011).
Reactive Oxygen Species are dangerous substances that distort protein based matters by taking electrons (Lu, 2013). The chemical structure of the protein-based substances are altered and become dysfunctional because of ROS (Lu, 2013; Burton & Jauniaux, 2011). Furthermore, one of the most significant protein-based substance, DNA get attacked by OH radicals (Burton & Jauniaux, 2011). However, the reduced form GSH can protect the chemical structure of the proteins by giving extra electrons to the ROS and free radicals (Lu, 2013). This is accomplished by GSH peroxidase-catalyzed reactions (Lu, 2013).
Source:
Gene: GSH
Protein: Bifunctional gamma-glutamate cysteine ligase
Organism: Streptococcus Thermophilus (SIIM B218)
Figure represents the predicted three-dimensional structure Bifunctional gamma-glutamate-cysteine ligase from Streptococcus Thermophilus . The protein structure of Bifunctional gamma-glutamate-cysteine ligase was constructed by using Amber 14. It is demonstrated in the ribbon diagram which is done by interpolating a smooth curve through the polypeptide backbone. The colors indicate the amino acids in the protein structure. While constructing, the codon bias rule is obeyed to express the enzyme in Escherichia Coli KO11.
gshF Gene and GSH Biosynthesis
Group: iGEM20_UNSW_Australia
Author: iGEM20_UNSW_Australia
Summary: As part of our project this year, the UNSW Australia team had a plan to increase the thermal tolerance of corals by introducing Small Heat Shock proteins (sHSP) as well as glutathione into the corals' symbiont, Symbiodinium. However, due to the challenges posed by the COVID-19 situation, we were only able to carry out laboratory work for sHSPs within an E. coli chassis. Therefore, we decided to add informational documentation for gshF gene and glutathione biosynthesis. Our documentation of glutathione expands on the work presented in Part:BBa_K2571005 by iGEM18_METU_HS_Ankara team. This information can be used for future iGEM teams to further build upon the application of the gshF in glutathione synthesis in industry and hence, increase the resistance of engineered cells to reactive oxygen species.
Present in its reduced (thiol) form, Glutathione (GSH) is a ubiquitous primary antioxidant which prevents the oxidation of biological molecules, such as proteins and enzymes, by donating its electrons to reactive oxygen species (Wang et al. 2019). Enzymatic synthesis and fermentation are the two processes that GSH is currently produced from. The intracellular synthesis of GSH is mediated by two ATP-dependent reactions which are catalysed by 𝛾-glutamylcysteine Synthetase (𝛾-GCS) (reaction 1) and Glutathione Synthetase (GS) (reaction 2). 𝛾-GCS and and GS are encoded by two different genes in most cells, the gshA and gshB genes, respectively. Since the activity of 𝛾-GCS is regulated by the feedback inhibition of GSH, over-accumulation of this antioxidant in the cell is not possible, thus, glutathione production is limited (Li et al. 2011). To improve the situation, a number of methods have been studied in one of which the exposure of cells to low pH resulted in secretion of GSH out of the cell and hence, less inhibition feedback on 𝛾-GCS activity (Liang, Du & Chen, 2008). A number of microorganisms, including Streptococcus thermophilus, have been found to have both 𝛾-GCS and GS encoded by a single gene, gshF. This gene codes a bifunctional enzyme in which its N-terminal sequence resembles 𝛾-GCS whereas its C-terminal sequence is similar to GS’s function. As a result, the activity of 𝛾-GCS is not inhibited and more GSH is produced, allowing the cell to have a higher threshold for reactive oxygen species without damaging any of its components (Li et al. 2011).
Due to its antioxidant nature, recombinant GSH expression has been explored as a means to increase yeast robustness for ethanol manufacturing from lignocellulosic feedstock. For cost-effective production, it is therefore imperative for high-yield, high-rate fermentation microbes. Previously, three homologous genes involved with GSH metabolism, GSH1, CYS3 and GLR1, were overexpressed which saw an increase in the robustness of Saccharomyces cerevisiae (Ask et al. 2013). However, the GSH feedback inhibition system posed a problem. To circumvent this, one study integrated the ribosomal DNA of S. cerevisiae with the GshF gene at a high copy number via the Cre-LoxP system (Qiu et al. 2015). The resulting yeast observed a three-fold increase in accumulated GSH leading to a greater tolerance to H2O2 (3mM), high temperatures (40℃), furfural (10mM), hydroxymethylfurfural (HMF - 10mM) and Cd+2 (0.5mM) concentrations compared to reference strains. From this, a product of two-fold higher ethanol concentration was achieved. However, yeast with higher thermotolerance is still required for a simultaneous saccharification (which occurs at 55℃) and fermentation process. Although the robustness of yeast can be improved via gshF, further means of increasing ROS resilience is a necessity for industrial biofuel production.
Although lacking an evaluation for ethanol production, a study by Tang presents an interesting method of increasing GSH production in yeast (Tang et al. 2015). This involves combining all three known biosynthesis pathways of GSH into one system - the first and second as explained previously (gshA/gshB and gshF) and the third utilising a side reaction from the proline synthesis pathway. For this, glutamate is converted to γ-glutamyl phosphate via γ-glutamyl kinase (Pro1). The substrate then reacts with cysteine to become γ-glutamylcysteine which is further conjugated with glycine via gsh2 to produce GSH. In the experiment, GshF from Actinobacillus pleuropneumoniae and Pro1 was expressed in S. cerevisiae. Additionally, two fusion proteins were constructed to mimic gshF’s two-step coupling efficiency; gsh2-gsh1 and Pro1-gsh2. The resulting W303-1b/FGP strain observed the highest GSH concentration at 216.50mg/L - a 2.19 fold increase compared to two-pathway strains. When amino acid precursors were introduced to shake flask cultures, a further 61.37% increase of GSH levels was observed. As such, this combinatorial strategy of GSH biosynthesis shows promise however requires evaluation as a feasible solution for increasing yeast robustness in applications such as ethanol production.
Design Notes of GSH (BBa_K2571005)
Our circuit consists of prefix, a strong promoter (J23100), RBS (B0034), GSH as protein coding region, double terminator (B0015) and suffix. This part enables our E. coli KO11 strain to overexpress oxidised Glutathione to reduce oxidative stress, increasing its lifespan. (Lu, 2013) Our construct is inserted into pSB1C3 and delivered to the Registry.
In order to make our gene compatible with RFC 10, 25 and 1000, we reconstructed the nucleotides to get rid of the restriction sites while protecting the amino acid sequence. We looked through the codon bias property of E.coli and made the nucleotide changes accordingly.

Characterization
Allergen Characterization:
Our parts can be used in ethanol production and we used it in the lab for mass production, it was important to construct an allergenicity test. The allergenicity test makes a comparison between the sequences of the biobrick parts and the identified allergen proteins in the database. If the similarity between the biobricks and the proteins is high, it is more likely that the biobrick is allergenic. In the sliding window of 80 amino acid segments, greater than 35% means similarity to allergens. Higher similarity implies that the biobricks have a potential for negative effect to exposed populations. For more information on the protocol see the “Allergenicity Testing Protocol” in the following page http://2017.igem.org/Team:Baltimore_Bio-Crew/Experiments
Our biobrick part, BBa_K2571005 showed less than 35% match in the 80 amino acid alignments by FASTA.
Gel Characterization:
GSH composite part is inserted into the pSB1C3 backbone. The construct in pSB1C3 is for submission to the registry and is cultivated in DH5 alpha.
We’ve inserted the GSH composite part to pSB1C3 backbone. Then, we’ve transformed the construct for submission, BBa_K2571005, (in pSB1C3) to DH5 alpha and conducted colony PCR. We’ve made the PCR with GSH specific primers and expected to see a result of 225 bp. PCR Results of our GSH part with GSH left and GSH right primers. By showing the band we expected, 225 bp, PCR confirmation for our insertion proved right.
GSH left and right primers are shown as below:
GSH left: TCGGAGGCTAAAACTCAGGA
GSH right: GTGGGCAGTCCAGTCGTAAT
Biochemical Characterization:
We designed our biochemical characterization experiments in order to evaluate the effects of our circuits on life span, cell mass, and ultimately the bioethanol yield of ethanologenic E. coli strain KO11. We carried out two experimental assays simultaneously.
In both of our biochemical assays, we had four cultured groups of KO11 ethanologenic strains of E.coli to test.
1. KO11 un-engineered,
2. KO11 with only FucO,
3. KO11 with only GSH,
4. KO11 with Bio-E (both FucO and GSH).
First Assay:
Throughout our first assay, each group was grown in LB broth mediums containing 2% glucose and antibiotics.
To culture group #1 (KO11 un-engineered), we only added Chloramphenicol at a final concentration of 40 µg/mL since KO11 un-engineered only had resistance to Chloramphenicol in its genome; and to the mediums of the groups numbered 2, 3 and 4; we added Chloramphenicol at a final concentration of 40 µg/ml and 100 µg/ml Ampicillin. The reason was; groups 2, 3 and 4 had plasmids which carried Ampicillin resistance due to their backbone (pSB1A3). Thus, with the addition of antibiotics to the mediums, selectivity was assured.
Cultures were grown overnight, and refreshed in the morning as two sets (First set: 10 mM furfural, 2nd set: 20 mM furfural). After approximately two hours of incubation for both of the sets’ falcon groups (when they reached OD 0,6), furfural was added to their mediums.
First Set (10 mM furfural):
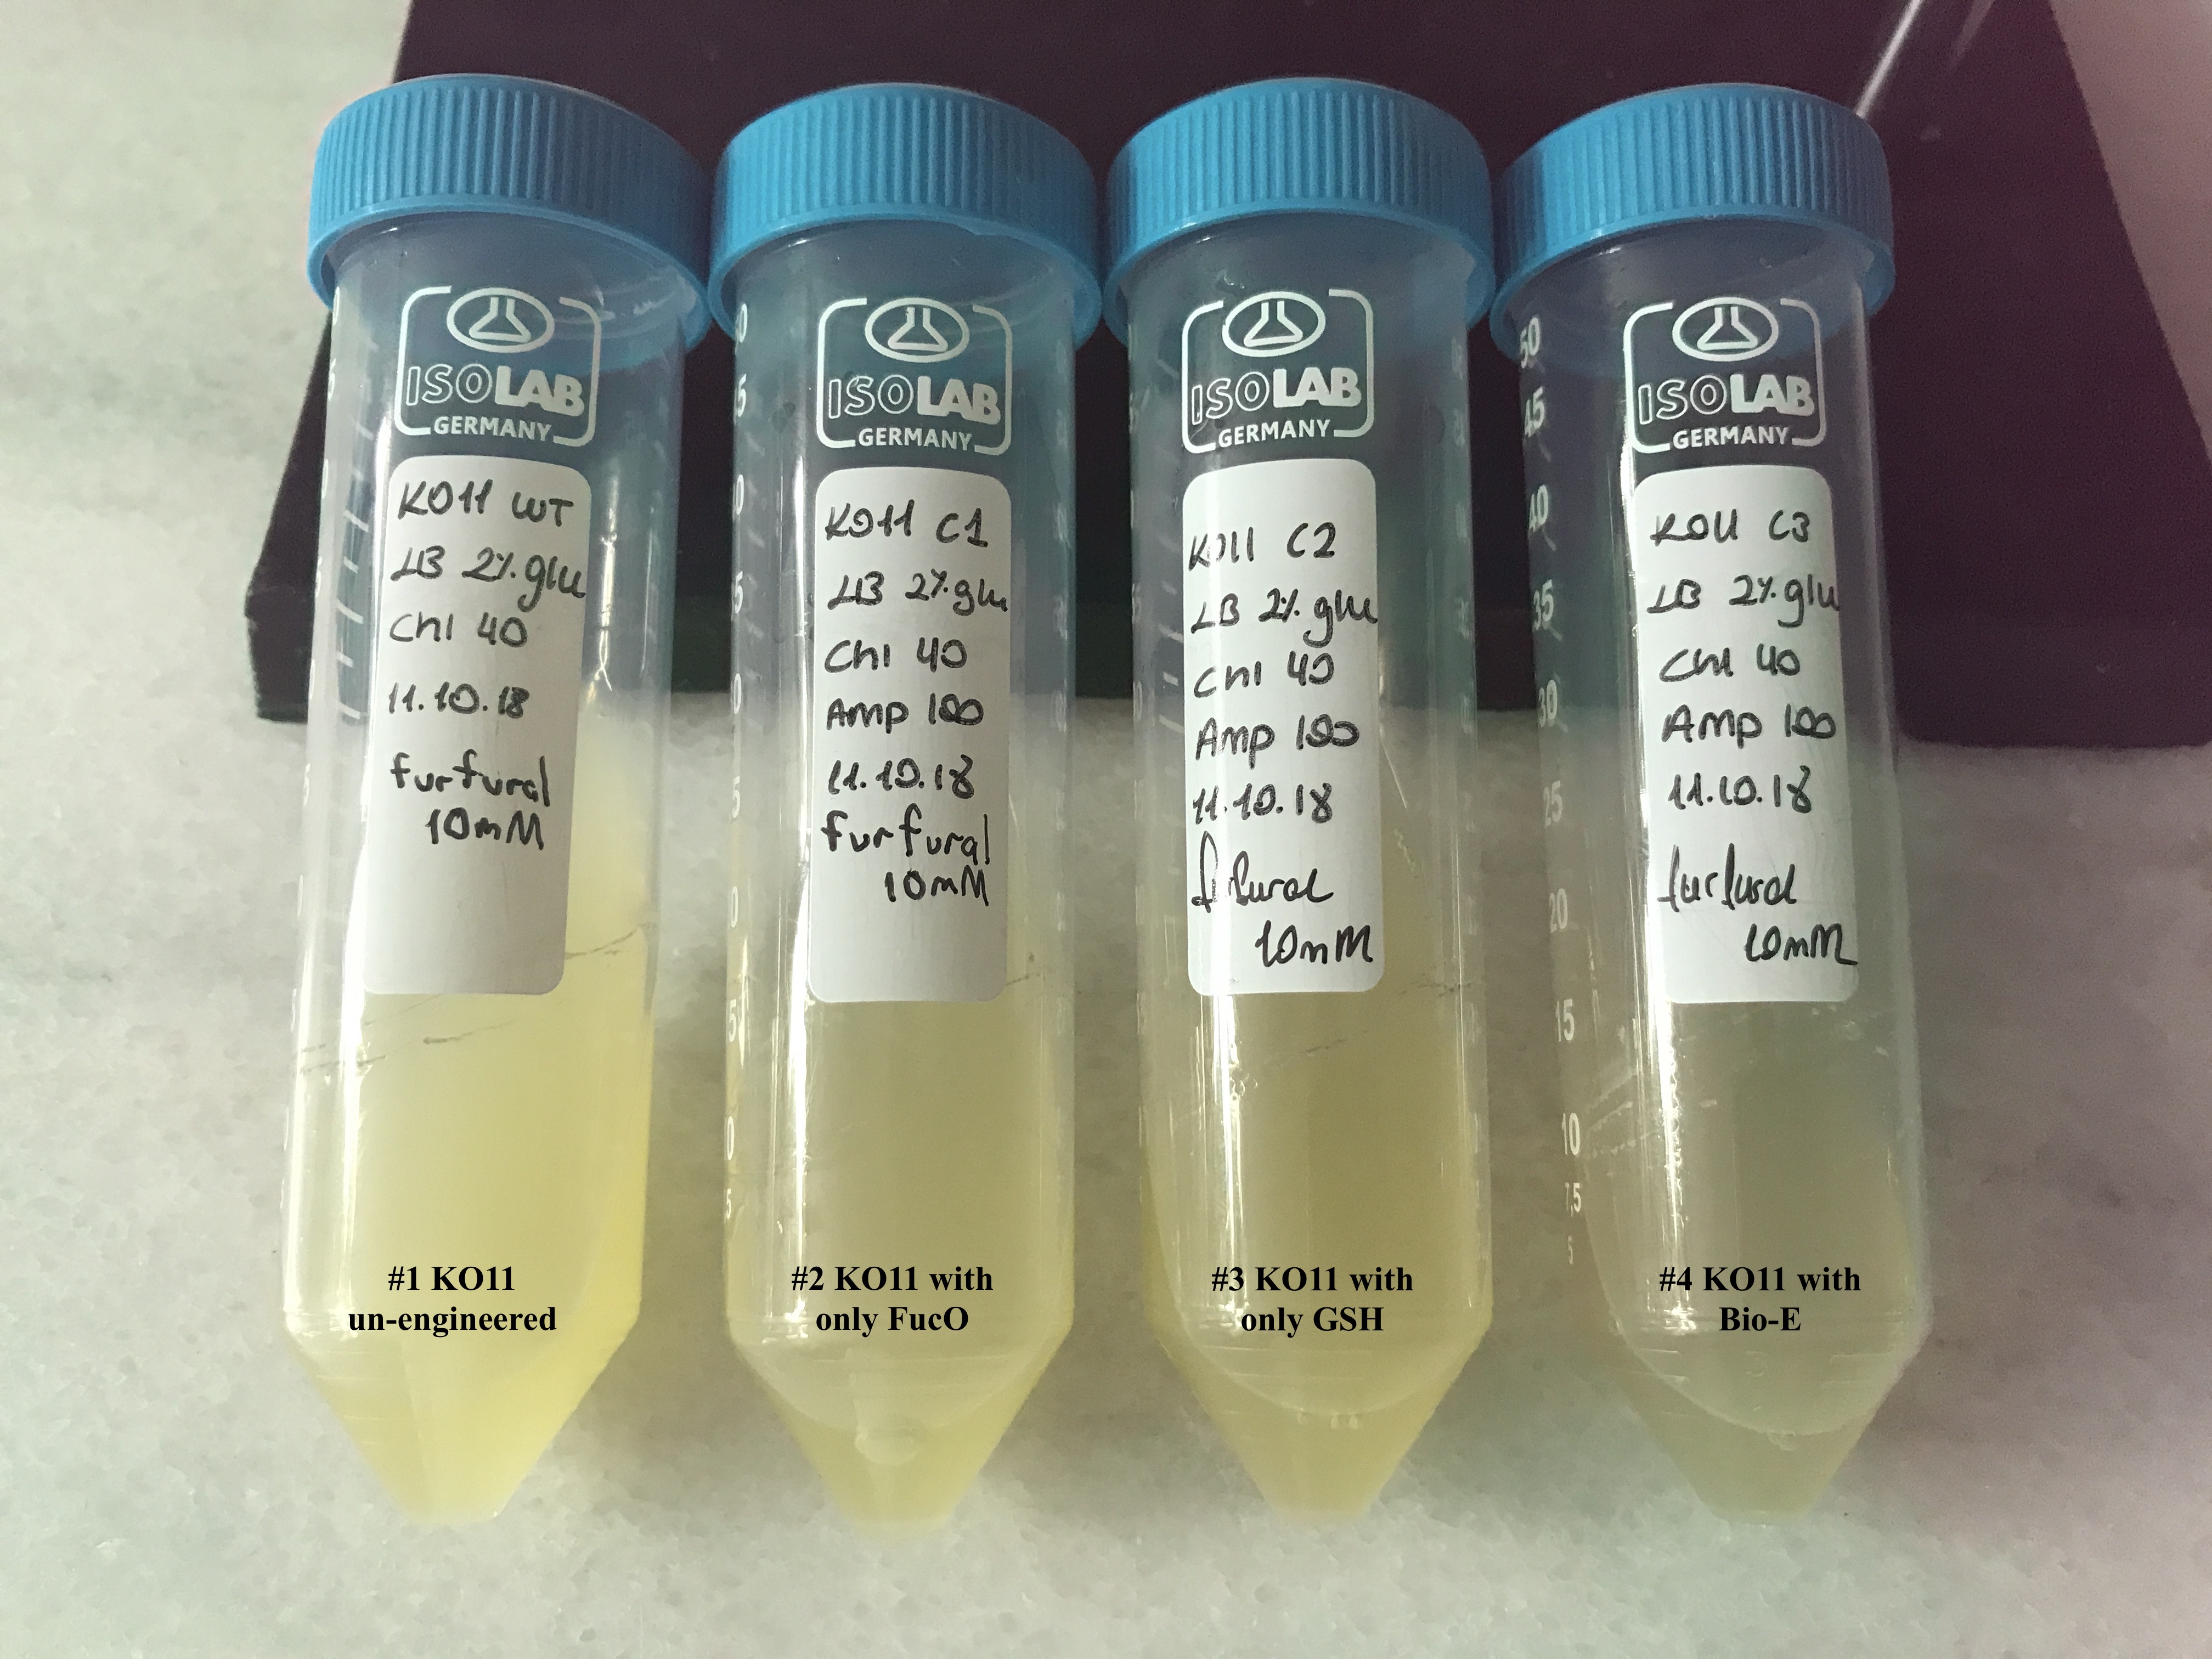
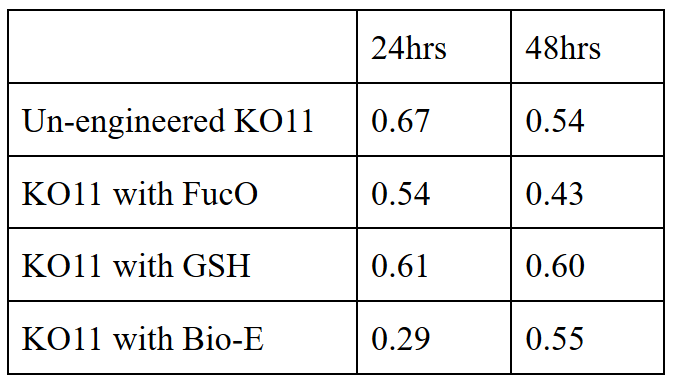
We added furfural at a final concentration of 10 mM to the first four test groups’ mediums and took OD measurements at Abs 600 nm with 1/10 dilution in 24 hour time intervals.
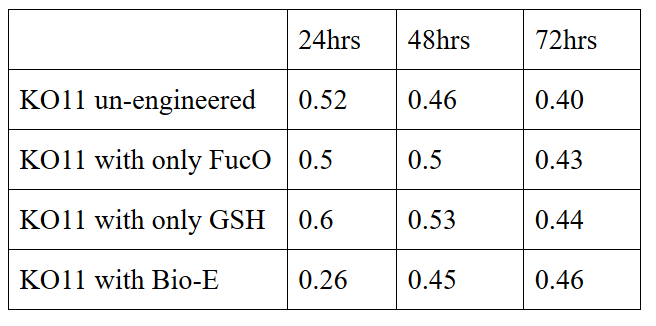
10 mM furfural OD measurements: Abs 600 nm (1/10 dilution):
Analysis of data:
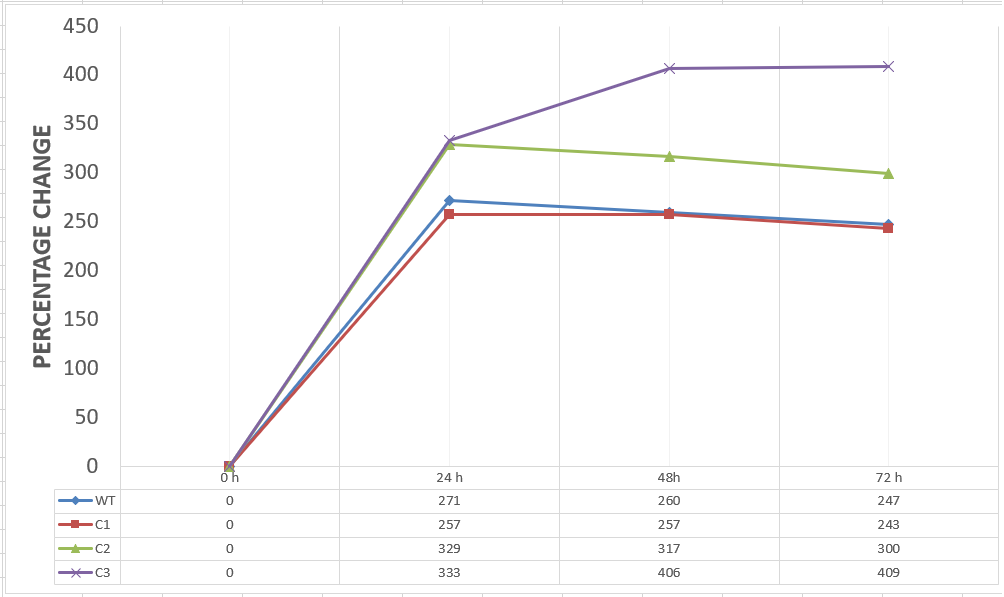
Our data demonstrated that group #1 (un-engineered) had a decrease in cell mass throughout the time verifying the inhibition of cell growth in the presence of furfural in the field. Group #2 (KO11 with only FucO) obviously gave better results with respect to un-engineered KO11. However, although the cell mass of the KO11 group with only FucO was stable in the first 48 hours, it was decreased after the 48th hour. This proves that only the presence of the gene FucO in the bacteria wasn’t enough to avoid cell mass decrease in the long term and is in need of another gene for increased tolerance. Also, only GSH’s presence isn’t enough since the group of KO11 with only GSH experienced decrease in cell mass. Group #4 (KO11 with Bio-E (both FucO and GSH)) gave measurement results as we hypothesized by continuing cellular growth in the first 48 hours and maintaining it even after the 48th hour, though at a lower rate.
Second Set (20 mM furfural):
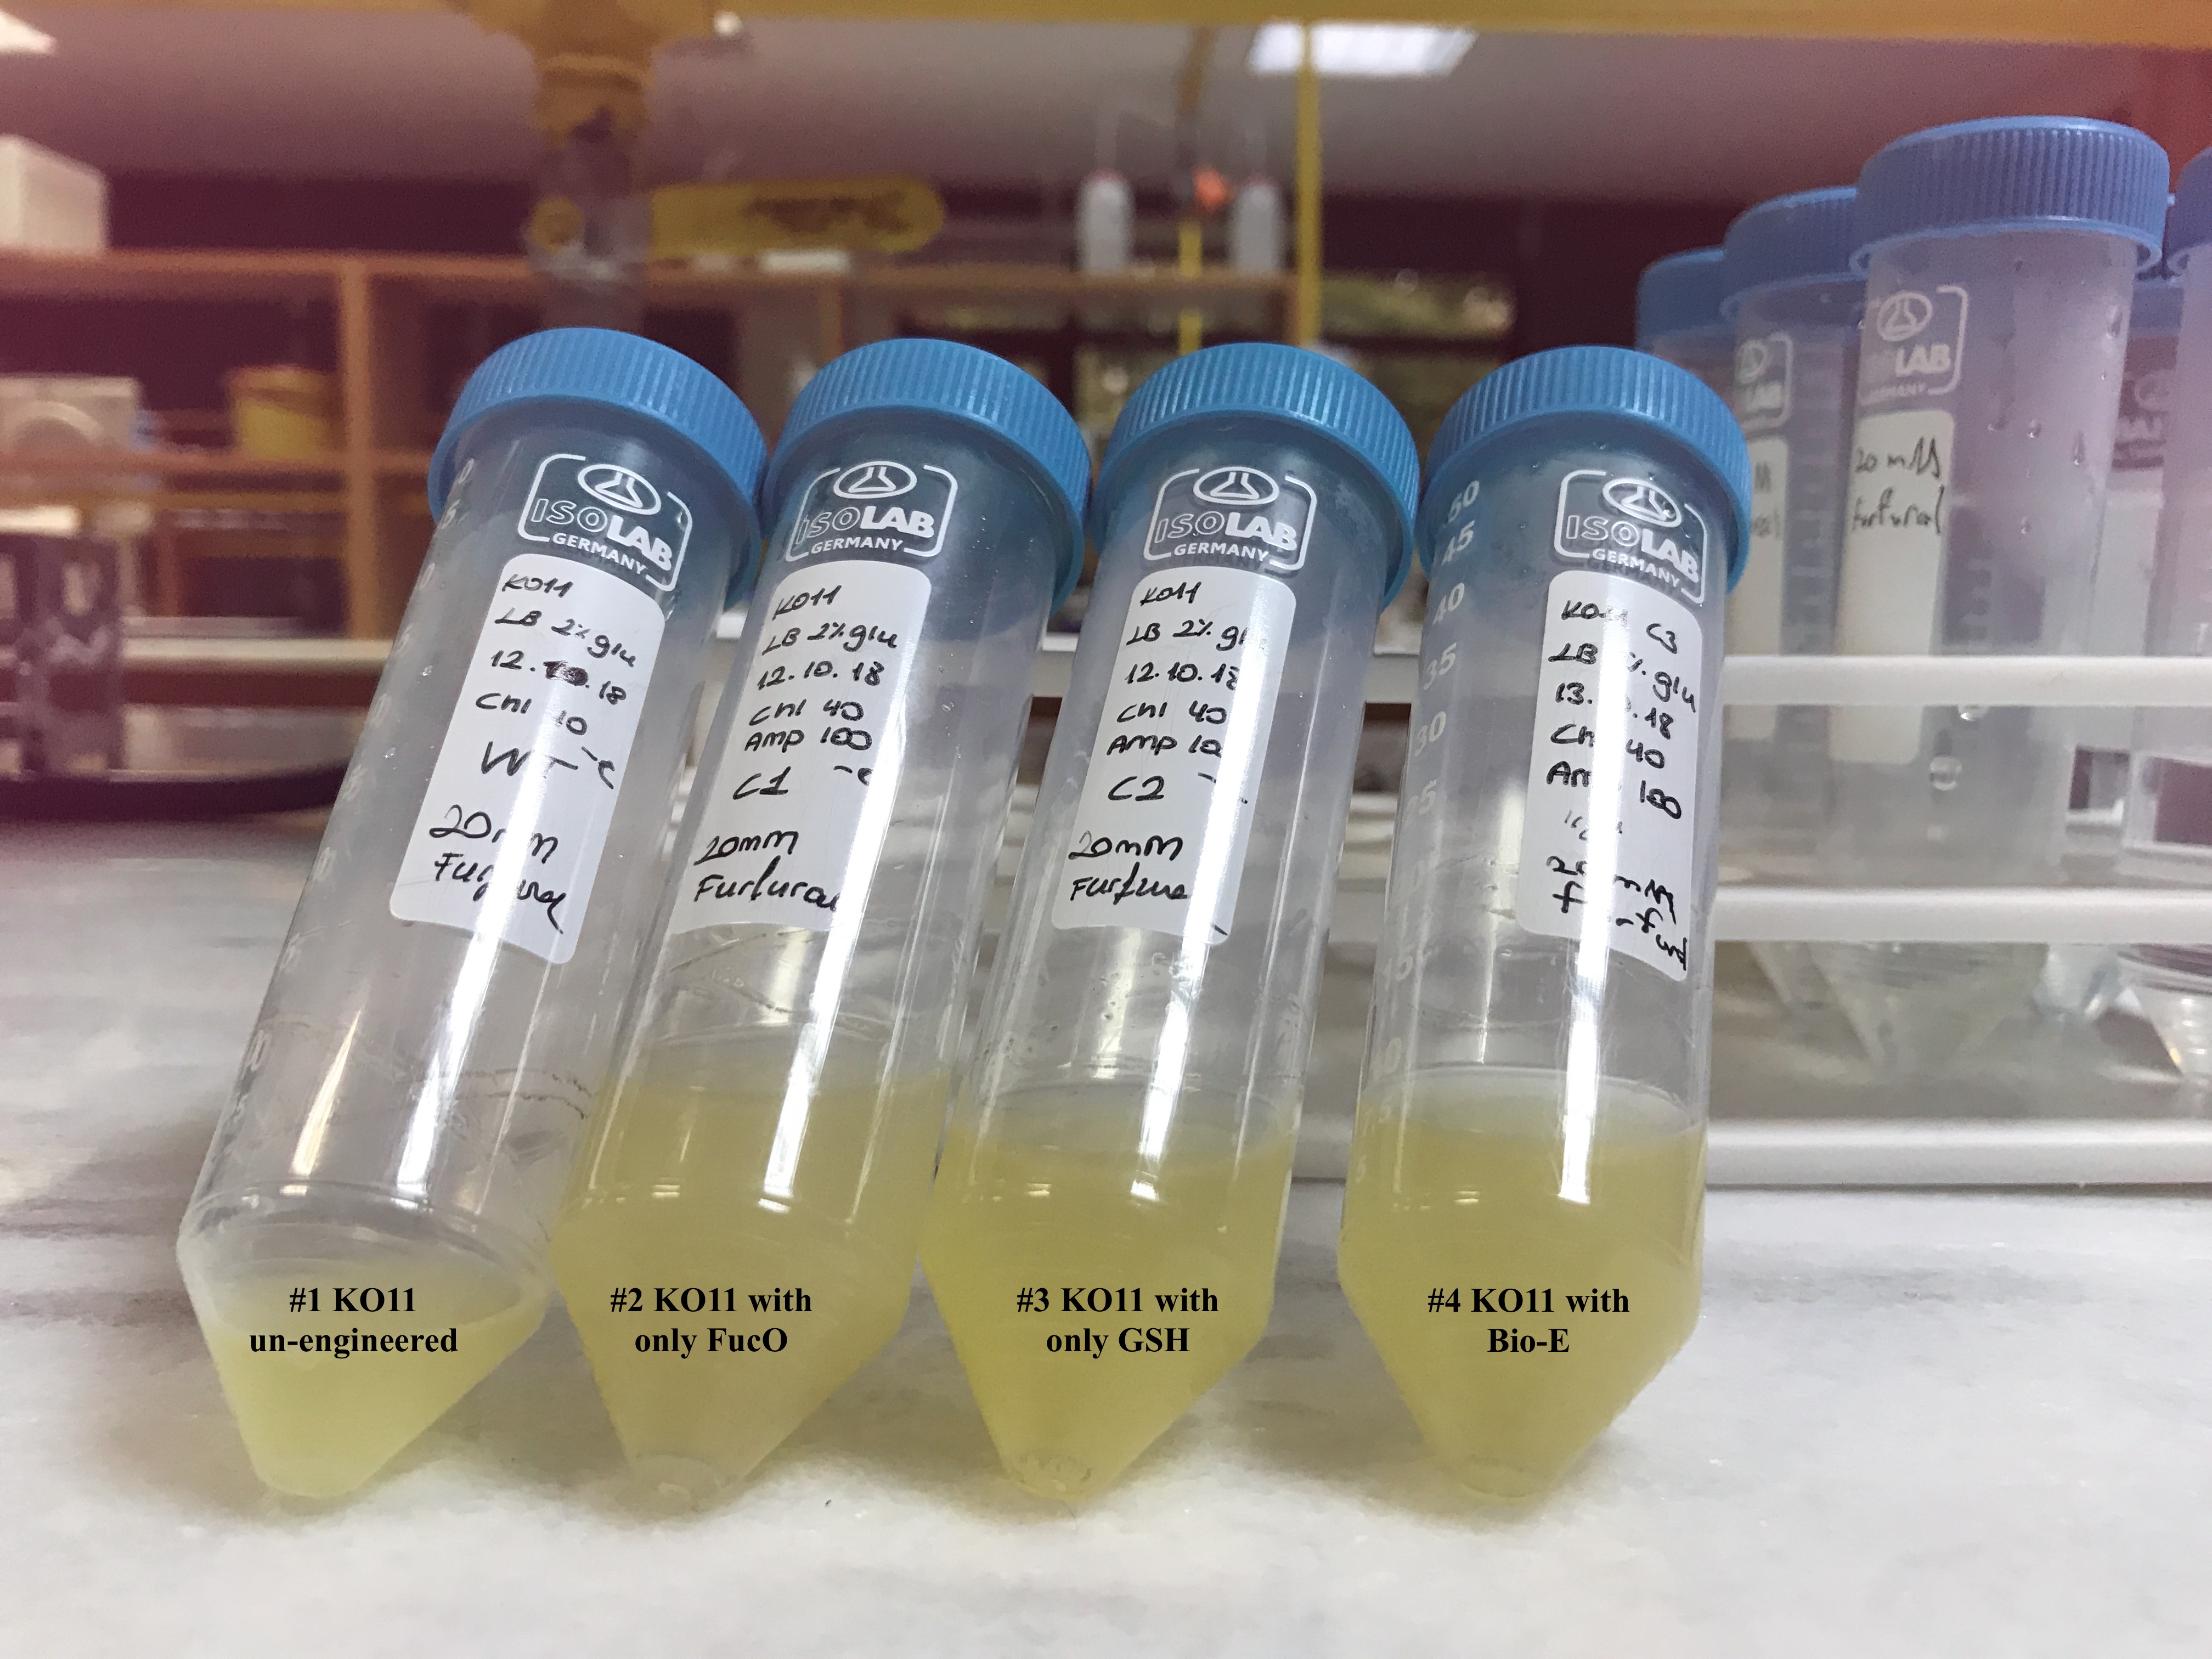
To gather more information to prove our hypothesis, we designed our second experimental set and added furfural at a final concentration of 20 mM to the four test groups’ mediums followed by OD measurements at Abs 600 nm with 1/10 dilution in 24 hour time intervals.
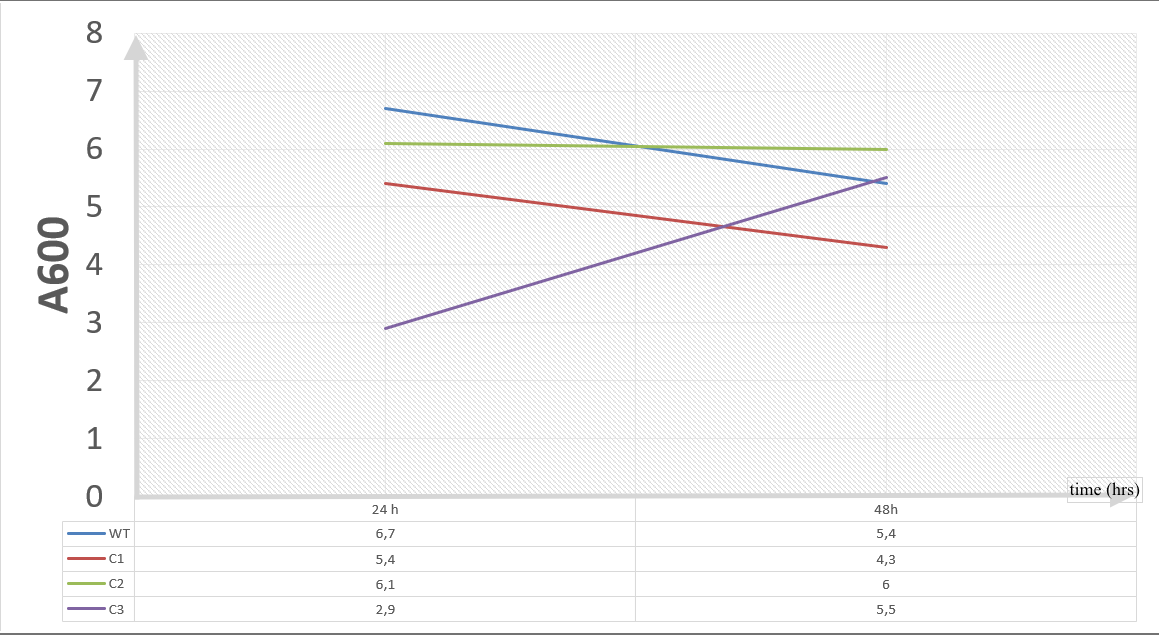
20 mM furfural OD measurements: Abs 600 (1/10 dilution):
For our second set, we could only obtain the measurements of the first 48 hours since we faced contamination in the last day of wet-lab and we had no more time. Thus, we modelled our second experimental set’s results by demonstrating the comparison of OD results at absorbance 600.
Analysis of Data:
Our data demonstrated that group #1 (KO11 un-engineered) had a decrease in cell mass as time passed. Group #2 (KO11 with only FucO) also experienced a decrease in cell mass. Group #3 (KO11 with only GSH) gave better results with respect to both of the groups #1 and #2 by maintaining its cell mass stable. Group #4 (KO11 with Bio-E (both FucO and GSH)) gave the most promising measurement data as we hypothesized by continuing cellular growth (almost doubling cell mass) in the first 48 hours.
Second Assay:
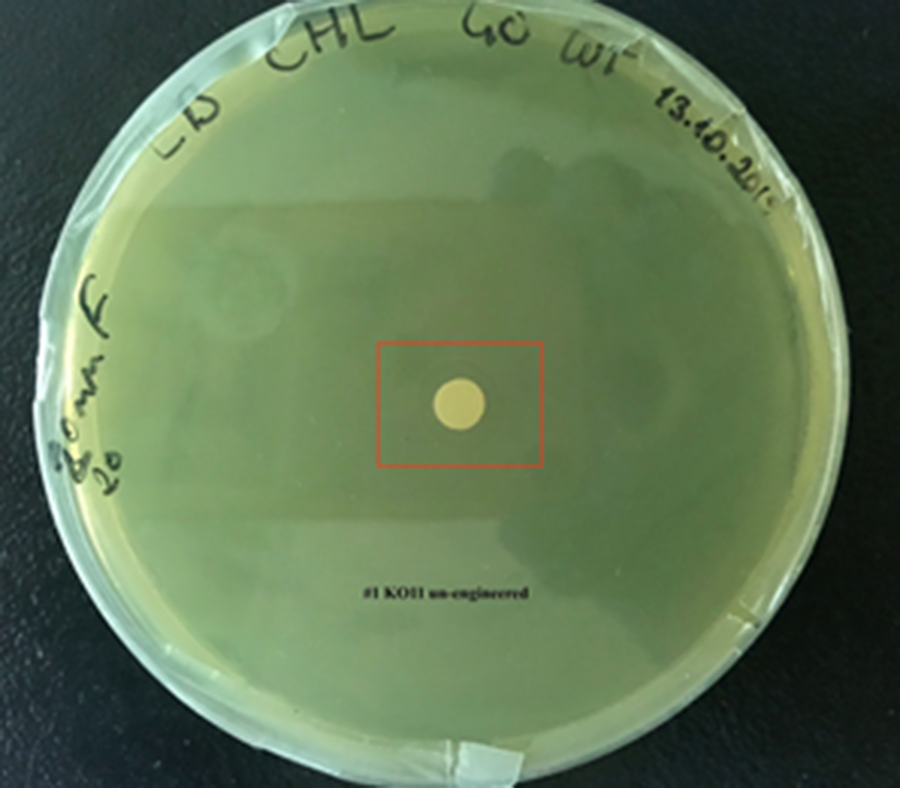
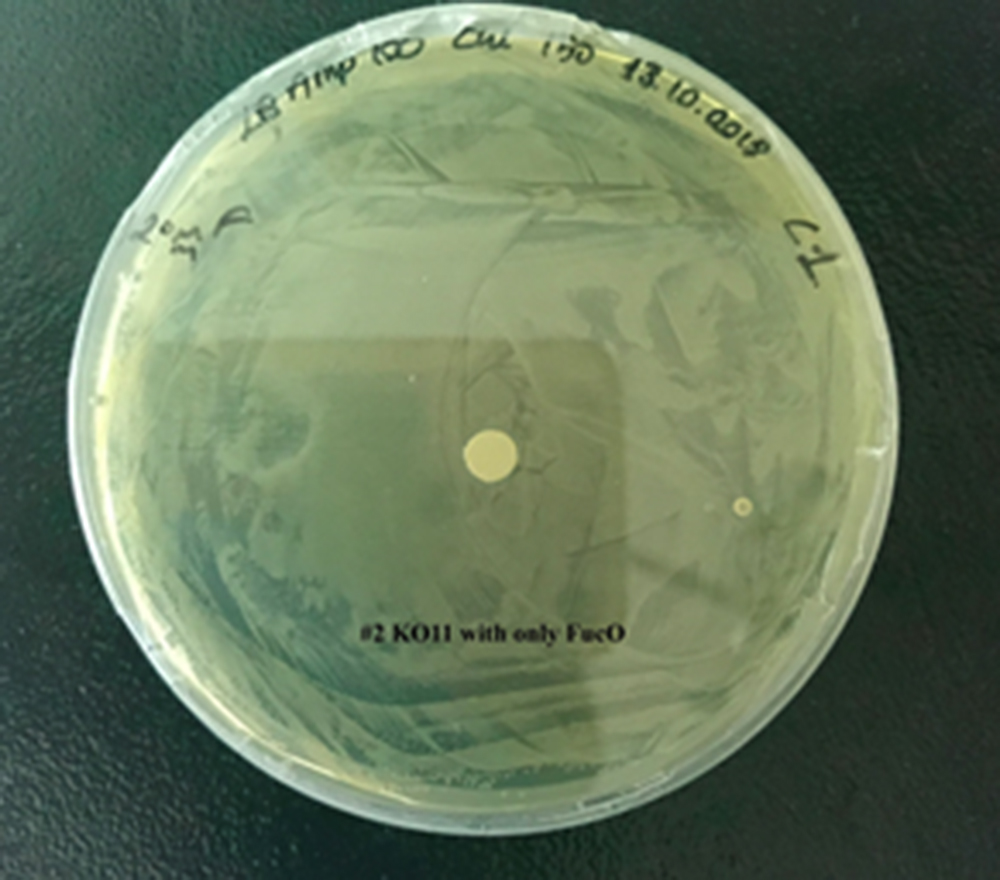
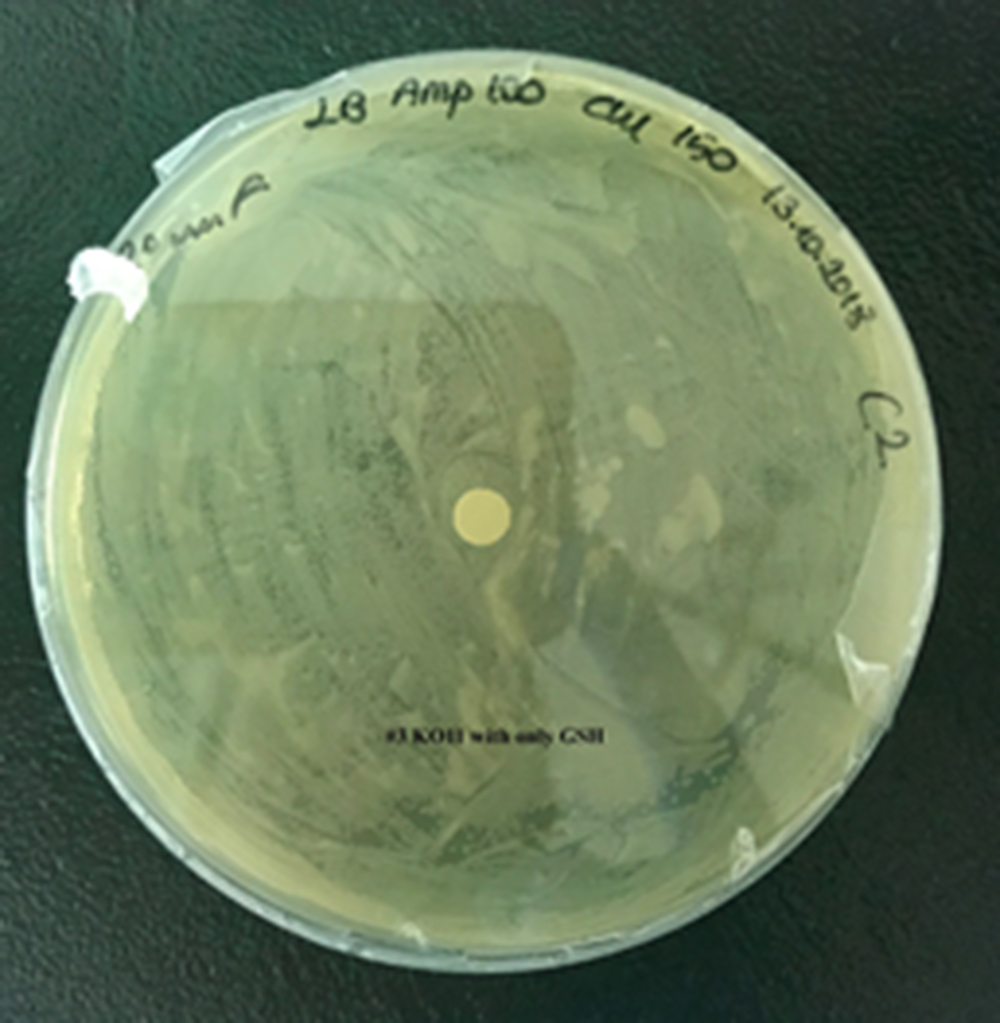
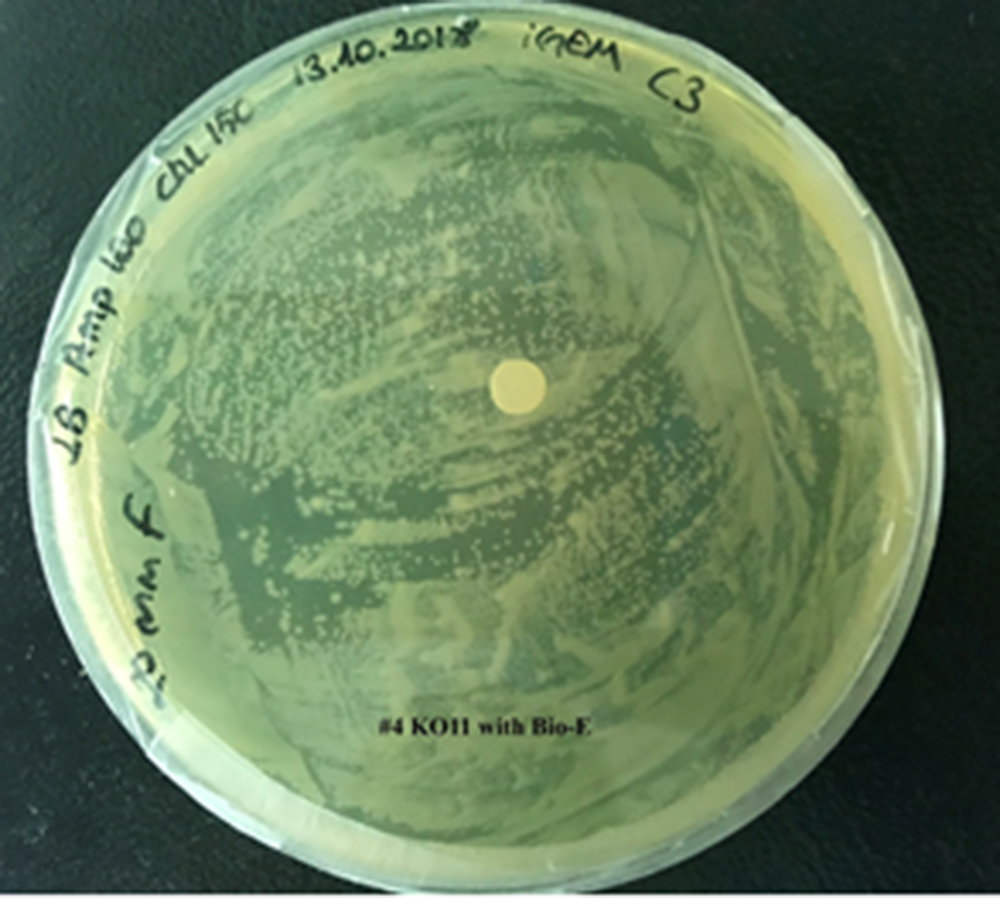
For our second characterization, we followed more of qualitative evaluation to see the inhibitory zone of furfural. Firstly, we prepared a solution of furfural at a final concentration of 20 mM by diluting the stock solution with distilled H2O. Then, we soaked filter paper discs in that solution and placed them on LB agar plates hosting the four groups of our assay.
After 48 hours, we’ve observed a clear zone around the filter paper of the group containing KO11 un-engineered while others weren’t inhibited as much.
Conclusion:
When the quantitative measurement data and qualitative phenotypic evaluation for all of our biochemical assays are considered, we can conclude that the groups containing KO11 un-engineered are the weakest ones against furfural toxicity; and neither the group of KO11 with only FucO nor the group with only GSH is resistant enough to continue cellular growth when furfural is present in the medium. Out of four groups, only the group containing KO11 with Bio-E (both FucO and GSH) can sustain its cellular growth and survive. Overall, we can infer that our best part design (Bio-E) was successful enough to combat the inhibitive effects of furfural, indicating trueness of our hypothesis.
References
Ask, M., Mapelli, V., Höck, H., Olsson, L., Bettiga, M. (2013) Engineering glutathione biosynthesis of Saccharomyces cerevisiae increases robustness to inhibitors in pretreated lignocellulosic materials. Microbial Cell Factories. 12:87 https://www.ncbi.nlm.nih.gov/pmc/articles/PMC3817835/
Burton, G. J., & Jauniaux, E. (2011). Oxidative stress. Best Practice & Research. Clinical Obstetrics & Gynaecology, 25(3), 287–299. http://doi.org/10.1016/j.bpobgyn.2010.10.016
Li, W., Li, Z., Yang, J. and Ye, Q., 2011. Production of glutathione using a bifunctional enzyme encoded by gshF from Streptococcus thermophilus expressed in Escherichia coli. Journal of biotechnology, 154(4), pp.261-268. https://doi.org/10.1016/j.jbiotec.2011.06.001
Liang, G., Du, G. and Chen, J., 2008. Enhanced glutathione production by using low‐pH stress coupled with cysteine addition in the treatment of high cell density culture of Candida utilis. Letters in applied microbiology, 46(5), pp.507-512. https://doi.org/10.1111/j.1472-765X.2008.02352.x
Lu, S. C. (2013). GLUTATHIONE SYNTHESIS. Biochemica et Biophysica Acta, 1830(5), 3143–3153. http://doi.org/10.1016/j.bbagen.2012.09.008
National Center for Biotechnology Information. PubChem Compound Database; CID=124886, https://pubchem.ncbi.nlm.nih.gov/compound/124886 (accessed July 18, 2018). https://pubchem.ncbi.nlm.nih.gov/compound/124886#section=Top
Patrick, L. (2003). Mercury Toxicity and Antioxidants: Part I: Role of Glutathione and alpha-Lipoic Acid in the Treatment of Mercury Toxicity. Alternative medicine review: a journal of clinical therapeutic.(7). 456-471. https://www.researchgate.net/publication/10980025_Mercury_Toxicity_and_Antioxidants_Part_I_Role_of_Glutathione_and_alpha-Lipoic_Acid_in_the_Treatment_of_Mercury_Toxicity
Pizzorno, J. (2014). Glutathione! Integrative Medicine: A Clinician’s Journal, 13(1), 8–12. https://www.ncbi.nlm.nih.gov/pmc/articles/PMC4684116/
Qiu, Z., Deng, Z., Tan, H., Zhou, S. and Cao, L., 2015. Engineering the robustness of Saccharomyces cerevisiae by introducing bifunctional glutathione synthase gene. Journal of industrial microbiology & biotechnology, 42(4), pp.537-542. https://doi.org/10.1007/s10295-014-1573-6
Tang, L., Wang, W., Zhou, W., Cheng, K., Yang, Y., Liu, M., Cheng, K. and Wang, W., 2015. Three-pathway combination for glutathione biosynthesis in Saccharomyces cerevisiae. Microbial cell factories, 14(1), p.139. https://doi.org/10.1186/s12934-015-0327-0
Wang, Y., Li, H., Li, T., Du, X., Zhang, X., Guo, T. and Kong, J., 2019. Glutathione biosynthesis is essential for antioxidant and anti-inflammatory effects of Streptococcus thermophilus. International Dairy Journal, 89, pp.31-36. https://doi.org/10.1016/j.idairyj.2018.08.012
Sequence and Features
- 10COMPATIBLE WITH RFC[10]
- 12INCOMPATIBLE WITH RFC[12]Illegal NheI site found at 7
Illegal NheI site found at 30 - 21COMPATIBLE WITH RFC[21]
- 23COMPATIBLE WITH RFC[23]
- 25COMPATIBLE WITH RFC[25]
- 1000INCOMPATIBLE WITH RFC[1000]Illegal BsaI.rc site found at 2069


