Difference between revisions of "Part:BBa J45014"
(→Primers used for modification) |
(→Linearisation of ATF1 gene) |
||
| Line 40: | Line 40: | ||
=== Linearisation of ATF1 gene === | === Linearisation of ATF1 gene === | ||
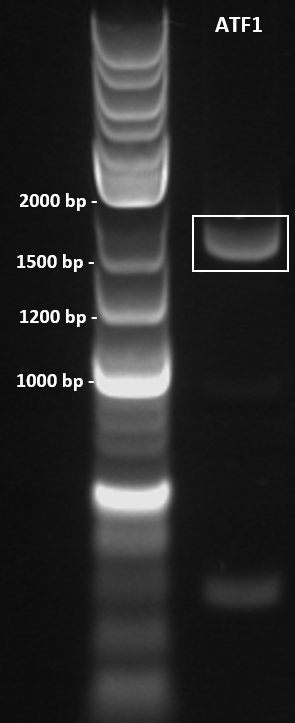
| − | The ATF1 gene (obtained from pSB1C3 storage plasmid obtained from Plate 3, Well 19L of the Spring 2019 Distribution Kit) was resuspended in water and transformed into competent T7 Express E. coli cells (NEB). Transformed cells were plated onto Luria Broth Agar plates supplemented with Chloramphenicol at 34 ug/uL for selection. This yielded over 100 colonies, 30 colonies were screened by colony PCR to identify colonies containing the ATF1 gene. PCR products were run on a 1% agarose gel by gel electrophoresis in 1X TAE Buffer for 1 hour at 100 V (Figure 2). This effectively linearises and modifies the ATF1 gene to contain the modifications described in Figure 1. | + | The ATF1 gene (obtained from pSB1C3 storage plasmid obtained from Plate 3, Well 19L of the Spring 2019 Distribution Kit) was resuspended in water and transformed into competent T7 Express ''E. coli'' cells (NEB). Transformed cells were plated onto Luria Broth Agar plates supplemented with Chloramphenicol at 34 ug/uL for selection. This yielded over 100 colonies, 30 colonies were screened by colony PCR to identify colonies containing the ATF1 gene. PCR products were run on a 1% agarose gel by gel electrophoresis in 1X TAE Buffer for 1 hour at 100 V (Figure 2). This effectively linearises and modifies the ATF1 gene to contain the modifications described in Figure 1. |
[[File:Atf1_gel2.png]] | [[File:Atf1_gel2.png]] | ||
| − | '''Figure 2.''' Colony PCR of T7 Express E. coli cells following transformation of ATF1 in pSB1C3 plasmids was performed under the following conditions: 98°C for 3 minutes, 30X cycles of: 98°C for 10 seconds, 70°C* for 30 seconds, 72°C for 45 seconds. Final extension at 72°C for 5 minutes. PCR product held at 4°C. | + | '''Figure 2.''' Colony PCR of T7 Express ''E. coli'' cells following transformation of ATF1 in pSB1C3 plasmids was performed under the following conditions: 98°C for 3 minutes, 30X cycles of: 98°C for 10 seconds, 70°C* for 30 seconds, 72°C for 45 seconds. Final extension at 72°C for 5 minutes. PCR product held at 4°C. |
Primers used: | Primers used: | ||
| Line 52: | Line 52: | ||
::Gradient annealing temperature was used to empirically determine the optimal annealing temperature. Bands were observed with annealing temperatures greater than 50C, and were optimal at 70C. | ::Gradient annealing temperature was used to empirically determine the optimal annealing temperature. Bands were observed with annealing temperatures greater than 50C, and were optimal at 70C. | ||
| − | DpnI digestion was performed on PCR products #4, #28 and #29 to remove circular template ATF1-pSB1C3 plasmids and PCR clean up kit (QIAGEN) was performed to purify the linear ATF1 gene. | + | DpnI digestion was performed on PCR products #4, #28 and #29 to remove circular template ATF1-pSB1C3 plasmids and PCR clean up kit (QIAGEN) was performed to purify the linear ATF1 gene. |
=== Assembly of ATF1 into pET-19b === | === Assembly of ATF1 into pET-19b === | ||
Revision as of 21:32, 21 October 2019
alcohol acetyltransferase I; converts isoamyl alcohol to isoamyl acetate (banana odor)
BBa_J45014 encodes alcohol acetyltransferase I derived from ATF1 from Saccharomyces cerevisiae. ATF1 catalyzes the conversion of isoamyl alcohol to isoamyl acetate. Isoamyl acetate has a banana smell.
Usage and Biology
[Note that this is not aspartate amino transferase (also called "AATase"), and that "ATF1" also refers to "Activating Transcription Factor 1" in humans (an entirely different protein that is homologous to "Atf1" in mouse).]
- 10COMPATIBLE WITH RFC[10]
- 12COMPATIBLE WITH RFC[12]
- 21INCOMPATIBLE WITH RFC[21]Illegal BglII site found at 99
Illegal BamHI site found at 1426 - 23COMPATIBLE WITH RFC[23]
- 25COMPATIBLE WITH RFC[25]
- 1000INCOMPATIBLE WITH RFC[1000]Illegal SapI.rc site found at 526
Illegal SapI.rc site found at 1534
Characterisation by 2019 UNSW
Gene Constructions - Modifications
The following gene construct was designed to enable the cloning ATF1 gene and purification of the protein.
Additions to the gene are as follows:
- Gibson forward and reverse overhangs – 5’ forward and 3’ reverse gibson overhangs are complementary to that of the pET-19b backbone. This allows for the ligation of the protein of interest into the pET-19b plasmid via Gibson Assembly.
- Hexahistidine tag – The histidine residues has a high binding affinity to Ni2+, this enables the purification of the protein of interest using Immobilised metal affinity chromatography (IMAC) via a Ni-NTA column.
- GG linkers - GG linkers are included between the peptide sequences. This flexible linker was designed to permit individual unhindered protein folding of the ATF1 enzyme and hexahistidine tag.
Figure 1: Sequence annotation of ATF1-His gBlock contains the ATF1 gene (orange) with a hexahistidine tag (light grey) separated by a GG linker (dark grey), TAA stop codon (silver) enclosed within gibson forward and reverse overhangs (pink).
Primers used for modification
Primers were designed for the addition of a C-terminal 6X Histidine Tag to the ATF1 gene by PCR-directed addition. The addition of the tag allows for purification of the protein via Immobilised Metal Affinity Chromatography (IMAC) by binding to Nickel-NTA columns. The primers were also designed to add Gibson overhangs to the 5’ and 3’ end of the ATF1 sequence to allow for ligation to pET19b backbone by Gibson Assembly.
ATF1 Forward:
- 5’-ACTTTAAGAAGGAGATATACCATGAATGAAATCGATGAGAAAAATCAGGCC
ATF1 Reverse:
- 5’-TCGGGCTTTGTTAGCAGCCGTTAGTGGTGATGATGGTGATGCCCACCAGGGCCTAAAAGGAGAGCTTTGTAAATGG
Cloning
Linearisation of ATF1 gene
The ATF1 gene (obtained from pSB1C3 storage plasmid obtained from Plate 3, Well 19L of the Spring 2019 Distribution Kit) was resuspended in water and transformed into competent T7 Express E. coli cells (NEB). Transformed cells were plated onto Luria Broth Agar plates supplemented with Chloramphenicol at 34 ug/uL for selection. This yielded over 100 colonies, 30 colonies were screened by colony PCR to identify colonies containing the ATF1 gene. PCR products were run on a 1% agarose gel by gel electrophoresis in 1X TAE Buffer for 1 hour at 100 V (Figure 2). This effectively linearises and modifies the ATF1 gene to contain the modifications described in Figure 1.
Figure 2. Colony PCR of T7 Express E. coli cells following transformation of ATF1 in pSB1C3 plasmids was performed under the following conditions: 98°C for 3 minutes, 30X cycles of: 98°C for 10 seconds, 70°C* for 30 seconds, 72°C for 45 seconds. Final extension at 72°C for 5 minutes. PCR product held at 4°C.
Primers used:
- Fwd: 5’-ACTTTAAGAAGGAGATATACCATGAATGAAATCGATGAGAAAAATCAGGCC,
- Rev: 5’-TCGGGCTTTGTTAGCAGCCGTTAGTGGTGATGATGGTGATGCCCACCAGGGCCTAAAAGGAG AGCTTTGTAAATGG
- Gradient annealing temperature was used to empirically determine the optimal annealing temperature. Bands were observed with annealing temperatures greater than 50C, and were optimal at 70C.
DpnI digestion was performed on PCR products #4, #28 and #29 to remove circular template ATF1-pSB1C3 plasmids and PCR clean up kit (QIAGEN) was performed to purify the linear ATF1 gene.
Assembly of ATF1 into pET-19b
Purified ATF1 amplicons were then ligated into the pET-19b plasmid backbone by Gibson assembly, where linear ATF1 insert and linear pET-19b plasmids were incubated with Gibson Assembly Master Mix at 50°C for 1 hour. The assembly mixture was then transformed into competent T7 express E.coli cells by heat shock at 42°C for 10 seconds and plated onto Luria Broth Agar plates supplemented with Ampicillin at working concentration for selection. This yielded over 100 colonies.
Colony PCR was performed to screen 10 colonies under the following conditions: 98°C for 3 minutes, 30X cycles of: 98°C for 10 seconds, 67.6°C for 30 seconds, 72°C for 45 seconds. Final extension at 72°C for 5 minutes. PCR product held at 4°C. Primers used as below. PCR products were run on a 1% agarose gel at 100 V for 1 hour and visualised in a GelDoc under the transilluminator setting. The colony ATF1-#28b obtained an amplicon corresponding to the expected size of 1643 bp (Figure 3).
Figure 3: Colony PCR gel image of recombinant ATF1#28b-pET-19b plasmid. ATF1 gene was amplified by colony PCR under the following conditions: 98°C for 3 minutes, 30X cycles of: 98°C for 10 seconds, 67.6°C for 30 seconds, 72°C for 45 seconds. Final extension at 72°C for 5 minutes. PCR product held at 4°C. 10 uL of PCR product was run on a 1% agarose gel at 100 V for 1 hour using 5 uL of 2-log DNA ladder (NEB) as a standard (Lane 1). Single band obtained at approximately 1600 bp.
Colony PCR Primers used for ATF1 in pET-19b:
- T7 Forward : 5’-TAATACGACTCACTATAGGG
- T7 Reverse : 5’-GCTAGTTATTGCTCAGCGG
The colony ATF1-#28b was grown up overnight in a 5 mL culture of Luria Broth supplemented with Ampicillin at working concentration. Cells were pelleted and lysed for plasmid purification using QIAGEN miniprep kit. Purified plasmid DNA was sequenced confirmed by Sanger sequencing.
Sequencing results confirm that the ATF1 gene has been successfully transformed into the pET19b plasmid with the C-Terminal 6X Histidine tag. The ATF1-28b colony was used for further protein expression and purification work.
Protein Expression
T7 E. coli colonies with pET-19b were used to inoculate 10 ml luria broth containing 1X ampicillin and incubated in a shaking incubator overnight at 37 degrees, 250 rpm. The starter culture was used to inoculate 1 L of Luria broth containing 1X ampicillin and incubated in a shaking incubator at 37℃, 150 rpm until OD600 reaches 0.6. Isopropyl-β-D-thiogalactoside (IPTG) was added to the culture to make a final concentration of 0.5 mM. The cultures were then incubated overnight at 20℃, 140 rpm. Pellets were harvested by centrifuging the cell culture at 4600 rpm at 4℃ for 20 minutes, after which the supernatant was removed. The pellets were resuspended in 50 ml of binding buffer (20 mM sodium phosphate, 500 mM NaCl, 10 mM imidazole, pH 8) and the cells were lysed by sonication. The lysate was then centrifuged to remove cellular debris at 4℃, 10 000 g for 25 minutes and the supernatant was passed through 0.22 µm filters. Soluble ATF1 was then purified via immobilized metal affinity chromatography (IMAC) using a 5 mL NiNTA column (QIAGEN) connected to an AKTA start system. Fractions containing ATF1 (as seen in figure 5) were combined and concentrated using Amicon Ultra 10 kDa centrifugal filter units after which the concentrate was buffer exchanged with 20 mM sodium phosphate, pH 8.0. Pierce BCA Protein Assay Kit (Thermo Fisher) was used to estimate protein concentration according to the manufacturer’s instructions.
Figure 4:Protein expression assay using BugBuster (Novagen) to determine expression of ATF1 as soluble and insoluble form. A large scale culture of ATF1 transformants in Luria Broth and ampicillin was induced at OD600 of 0.6 using 0.5 mM IPTG and grown for 20 hours at 20°C.
Figure 5: SDS-PAGE of AKTA purification fractions (F3 to F8 and F10) for ATF1 His-tagged protein
Characterisation Data
Kinetic Ellman’s Assay Protocol
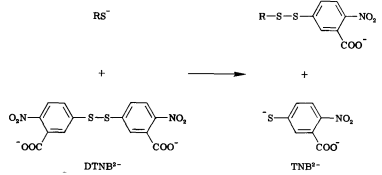
Free thiols can be quantified through the use of Ellman’s Reagent (DTNB). DTNB has an oxidizing disulfide bond that is reduced when free thiols are present, releasing one molecule of 5-thio-2-nitrobenzoic acid (TNB). Thus, free thiol concentration can be determined by observing absorption at 412 nm and measuring TNB concentration. (1) Our team will be using this kinetic assay to measure the amount of acetyl coenzyme A (acetyl-CoA), converted to coenzyme A-SH (CoA-SH) which is a co-substrate in the enzymatic reactions of Alcohol acetyltransferase (ATF1) and 10-deacetylbaccatin III-10-O-acetyltransferase (DBAT).
Figure 6: Reaction of 5,5'-Dithiobis-(2-Nitrobenzoic Acid) (DTNB) with a free thiol molecule resulting in the release of one molecule of 5-thio-2-nitrobenzoic acid (TNB).
Materials
- Reaction Reaction Buffer: Tris-HCl (262 mM) 0.1M sodium phosphate, EDTA (13 mM), pH 8.0.
- pH 8.0, containing 1mM EDTA
- DTNB (3.5mM) in methanol3.5mM
- Isoamyl alcohol (: 70mM) final concentration in H2O
- Acetyl CcoA in H2O: 0.38mM final concentration
- Purified enzyme: Concentration determined by BCA
- Microtiter Plate
Method
- Construct a standard curve measuring absorbance of different concentrations of CoA-SH to determine limitations of CoA-OASH detection (needs more explanation on importance of standard or are we leaving it out)
- Wells were made in triplicate containing; Reaction Buffer (240ul), Isoamyl alcohol (10ul), acetyl CcoA (20ul), and purified enzyme (30ul) (water was substituted in a blank)
- DTNB (50ul) was then added to each well
- Absorbance was measured observed by a spectrophotometer every 30 seconds for one hour in a kinetic assay
Results
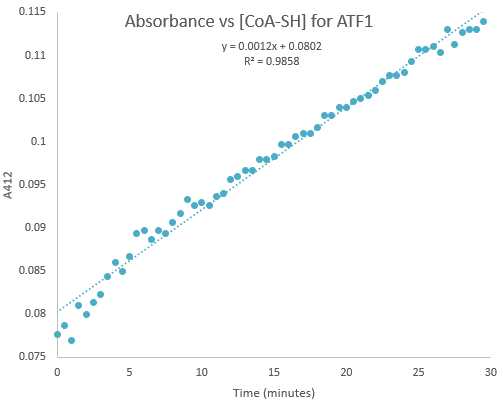
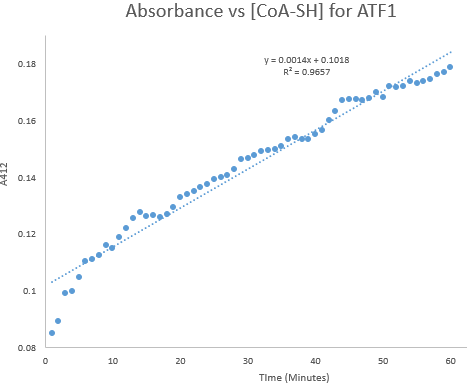
Kinetic assays were conducted, measuring every 0.5 and 1 minutes for a total of 30 and 60 minutes respectively. Excel was then used to create a graph containing a computer-generated linear trendline.(Figure 7)
Figure 7:Kinetic assay of change in TNB absorbance over 30 minutes, measured every 0.5 minutes. Included is the computer generated linear trendline with calculated Cartesian equation and R value
Figure 8: Kinetic assay of change in TNB absorbance over 60 minutes, measured every minute. Included is the computer generated linear trendline with calculated Cartesian equation and R value
The amount of TNB produced in 1 minute was calculated by c= ∆A/(εl) where c is the concentration change of TNB (M), ∆A is the change in absorbance in 1 minute, molar extinction coefficient ε= 14 150 M-1cm-1, and pathlength l= 1 cm. (2) The result was then divided by 60 to get the change in TNB concentration per second. (3)
The number of moles of TNB produced per second was calculated by n= cV where c is the concentration change calculated from the step above, and V = 350 x 10-6 L.
The rate of catalysis was calculated by (moles of TNB produced per second)/ (moles of enzyme) as TNB is formed in a 1:1 molar ratio with CoA-SH produced. This gave us an estimated Kcat range of 0.000632-0.000737(1/s)
References
- ATF1 - Alcohol O-acetyltransferase 1 - Saccharomyces cerevisiae (strain ATCC 204508 / S288c) (Baker's yeast) - ATF1 gene & protein [Internet]. Uniprot.org. [cited 21 October 2019]. Available from: https://www.uniprot.org/uniprot/P40353
- Eyer P, Worek F, Kiderlen D, Sinko G, Stuglin A, Simeon-Rudolf V, Reiner E. Molar absorption coefficients for the reduced Ellman reagent: reassessment. Analytical biochemistry. 2003 Jan 15;312(2):224-7.
- WEEK #3: ENZYME KINETICS: CHARACTERIZATION OF THE ENZYME ALKALINE PHOSPHATASE [Internet]. [cited 19 October 2019]. Available from: https://acad.carleton.edu/curricular/BIOL/classes/bio126/Documents/Lab_3.pdf?fbclid=IwAR1REQ1CFrBmPqrPmGXsg7E8N6s-bjxedr_VyICuEBsCa7hUEsTikM7i5aQ


