Difference between revisions of "Part:BBa K1104241"
| (5 intermediate revisions by 2 users not shown) | |||
| Line 1: | Line 1: | ||
| − | |||
__NOTOC__ | __NOTOC__ | ||
<partinfo>BBa_K1104241 short</partinfo> | <partinfo>BBa_K1104241 short</partinfo> | ||
| − | TrxC promoter[https://parts.igem.org/Part:BBa_K1104201 BBa_K1104201] is controlled by OxyR (transcription factor), which is activated by ROS(Reactive Oxygen Species). A disulfide bond will form between 2 OxyR transcription factors to activate the transcription. | + | TrxC promoter ([https://parts.igem.org/Part:BBa_K1104201 BBa_K1104201]) is controlled by OxyR (transcription factor), which is activated by ROS(Reactive Oxygen Species). A disulfide bond will form between 2 OxyR transcription factors to activate the transcription. |
| − | After | + | After TrxCp is activated, GFP generator [https://parts.igem.org/Part:BBa_E0840 BBa_E0840] takes as input a transcriptional signal (PoPS) and produce as output the fluorescent protein GFP. |
| + | |||
| + | <html> | ||
| + | <br> | ||
| + | <h2>Contribution - Characterization</h2> | ||
| + | <br> | ||
| + | <p>SUIS_Shanghai iGEM 2019 provides characterization for this part. We achieved this by using TrxCp + GFP generator part (BBa_K1104241) in our project to test two different versions of OxyR transcription factor protein. This part (BBa_K1104241) will be activated and GFP produced once oxidized OxyR (which contains a reactive cysteine residues that forms a disulfide bond with a neighboring cysteine upon oxidation) binds to the binding site upstream of TrxCp. | ||
| + | <br> | ||
| + | <figure class="figure-center"> | ||
| + | <img src="https://2019.igem.org/wiki/images/d/db/T--SUIS_Shanghai--_TrxCp.png" align="center" alt="H2O2 sensor chart"> | ||
| + | </figure> | ||
| + | <br> | ||
| + | This part was added to our composite parts (BBa_K3031019 Bba_K3031020) and synthesized by Genscript onto expression vector pET30a(+) and transformed into <i>E.coli</i> BL21(DE3) cells. Overnight cultures were later tested for GFP fluorescence. The above construct should only produce GFP in the presence of enough OxyR transcription factor and a large enough concentration of H2O2. | ||
| + | <br> | ||
| + | <h3>Biology & Usage</h3> | ||
| + | OxyR is activated by ROS (Reactive Oxygen Species) which contains a reactive cysteine residue at position 199 (Cys-199). Upon exposure to a ROS, Cys-199 is oxidized resulting in the formation of an intermolecular disulfide bond between Cys-199 and Cys-208. This causes a conformational change, activating the OxyR transcription factor which can bind to regularly sequences and thus positively regulate some genes. | ||
| + | As mentioned on this page the TrxC promoter is a regulatory sequence for the thioredoxin (TrxC) gene so after synthesis of the gene circuit we designed an experiment to add experimental characterization of this part by activating the promoter to express GFP. H2O2 was added to cell cultures to induce the expression of GFP by first oxidizing the reactive Cys-199 on OxyR and thus activating this transcription factor for TrxC promoter. | ||
| + | |||
| + | This gene construct will express OxyR all the time but downstream genes from TrxC promoter will only be expressed upon binding of active OxyR to the binding regions. OxyR is activated by the oxidation of a reactive cysteine residue (Cys-199) by a reactive oxygen species (ROS). | ||
| + | |||
| + | <h3>Experiment</h3> | ||
| + | <ul> | ||
| + | <li> <b>Sample A</b> - <i>E.coli</i> BL21(DE3) cells containing expression plasmid and the gene sequence above.</li> | ||
| + | <li> <b>Sample B</b> - <i>E.coli</i> BL21(DE3) cells without engineered plasmid. </li> | ||
| + | </ul> | ||
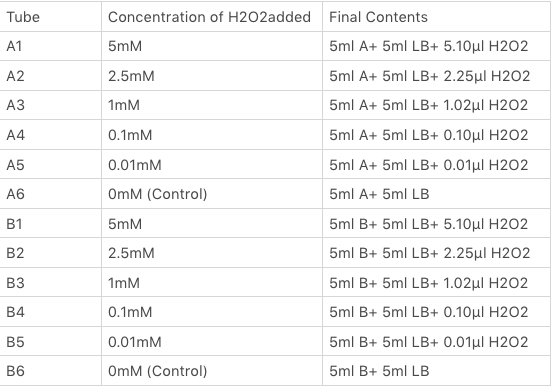
| + | We divided our 50ml test tubes of Sample A and B culture into twelve 15ml test tubes, each contained 5ml culture broth and 5ml LB with OD600 0.4. H2O2 was added to 10 of the tubes in the following concentrations: | ||
| + | <figure class="figure-center"> | ||
| + | <img src="https://2019.igem.org/wiki/images/1/15/T--SUIS_Shanghai--H2O2conc.png" height=350px width=500px align="center" alt="H2O2 sensor data"> | ||
| + | </figure> | ||
| + | <br> | ||
| + | <p>After 2 hours of incubation, we extracted 1.4 ml culture from each of tubes and placed in twelve 1.5ml sterile centrifuge tube and centrifuged at 4000rpm for 4 minutes. After removing the supernatant, we washed the cell with PBS buffer. Then, 200 μM culture of A1, A2, A3, A4, A5, A6, B1, B2, B3, B4, B5, B6 was added into 96 well white polystyrene microplate and black polystyrene microplate, each with three samples. We measured the OD600 and Fluorescence (Excitation: 485nm/ Emission: 528nm) by using plate reader. The data was recorded. After that, we calculated the average OD600 and Fluorescence for all samples. For each of samples, we divided the relative fluorescence value (RFV) by the average OD600.</p> | ||
| + | <br> | ||
| + | <figure class="figure-center"> | ||
| + | <img src="https://2019.igem.org/wiki/images/f/fc/T--SUIS_Shanghai--Contributiondata2.png" height=500px width=425px align="center" alt="H2O2 sensor data"> | ||
| + | </figure> | ||
| + | <br> | ||
| + | <figure class="figure-center"> | ||
| + | <img src="https://2019.igem.org/wiki/images/2/25/T--SUIS_Shanghai--Contributiondata1.png" height=300px width=400px align="center" alt="H2O2 sensor chart"> | ||
| + | </figure> | ||
| + | <br> | ||
| + | <p>Comparison of relative fluorescence value (RFV)/OD600 of Sample A, with OxyR transcription factor (BBa_K1104200) from iGEM13_NYMU-Taipeiunder and Reactive Oxygen Species induced promoter TrxCp (BBa_K1104201), and Blank (unmodified BL21 E. coli), under six H2O2 concentrations. Results indicate a significant difference between Sample A and Blank in all concentrations measured.</p> | ||
| + | <p>This is the relative fluorescence value (RFV)/OD600, an indication of promoter performance, of sample A and a control group under different H2O2 concentration. Similar to the trend of the original result from team NYMU-Taipei, the RFV/OD600 value tend to increase as the concentration of H2O2 increase, despite the gradual decreasing fluorescence value after the concentration exceed 1mM. Accelerating protein degradation of GFP might be a possible explanation for this distinction. Protein biodegradability is said to increase along with peroxide concentration. </p> | ||
| + | <br> | ||
| + | </html> | ||
<!-- Add more about the biology of this part here | <!-- Add more about the biology of this part here | ||
Latest revision as of 18:13, 21 October 2019
TrxC promoter +E0840
TrxC promoter (BBa_K1104201) is controlled by OxyR (transcription factor), which is activated by ROS(Reactive Oxygen Species). A disulfide bond will form between 2 OxyR transcription factors to activate the transcription. After TrxCp is activated, GFP generator BBa_E0840 takes as input a transcriptional signal (PoPS) and produce as output the fluorescent protein GFP.
Contribution - Characterization
SUIS_Shanghai iGEM 2019 provides characterization for this part. We achieved this by using TrxCp + GFP generator part (BBa_K1104241) in our project to test two different versions of OxyR transcription factor protein. This part (BBa_K1104241) will be activated and GFP produced once oxidized OxyR (which contains a reactive cysteine residues that forms a disulfide bond with a neighboring cysteine upon oxidation) binds to the binding site upstream of TrxCp.

This part was added to our composite parts (BBa_K3031019 Bba_K3031020) and synthesized by Genscript onto expression vector pET30a(+) and transformed into E.coli BL21(DE3) cells. Overnight cultures were later tested for GFP fluorescence. The above construct should only produce GFP in the presence of enough OxyR transcription factor and a large enough concentration of H2O2.
Biology & Usage
OxyR is activated by ROS (Reactive Oxygen Species) which contains a reactive cysteine residue at position 199 (Cys-199). Upon exposure to a ROS, Cys-199 is oxidized resulting in the formation of an intermolecular disulfide bond between Cys-199 and Cys-208. This causes a conformational change, activating the OxyR transcription factor which can bind to regularly sequences and thus positively regulate some genes. As mentioned on this page the TrxC promoter is a regulatory sequence for the thioredoxin (TrxC) gene so after synthesis of the gene circuit we designed an experiment to add experimental characterization of this part by activating the promoter to express GFP. H2O2 was added to cell cultures to induce the expression of GFP by first oxidizing the reactive Cys-199 on OxyR and thus activating this transcription factor for TrxC promoter. This gene construct will express OxyR all the time but downstream genes from TrxC promoter will only be expressed upon binding of active OxyR to the binding regions. OxyR is activated by the oxidation of a reactive cysteine residue (Cys-199) by a reactive oxygen species (ROS).Experiment
- Sample A - E.coli BL21(DE3) cells containing expression plasmid and the gene sequence above.
- Sample B - E.coli BL21(DE3) cells without engineered plasmid.

After 2 hours of incubation, we extracted 1.4 ml culture from each of tubes and placed in twelve 1.5ml sterile centrifuge tube and centrifuged at 4000rpm for 4 minutes. After removing the supernatant, we washed the cell with PBS buffer. Then, 200 μM culture of A1, A2, A3, A4, A5, A6, B1, B2, B3, B4, B5, B6 was added into 96 well white polystyrene microplate and black polystyrene microplate, each with three samples. We measured the OD600 and Fluorescence (Excitation: 485nm/ Emission: 528nm) by using plate reader. The data was recorded. After that, we calculated the average OD600 and Fluorescence for all samples. For each of samples, we divided the relative fluorescence value (RFV) by the average OD600.


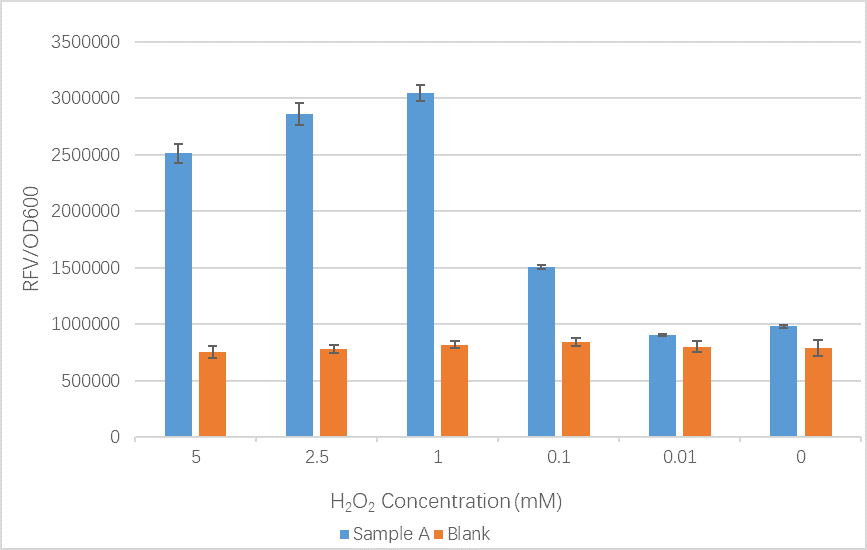
Comparison of relative fluorescence value (RFV)/OD600 of Sample A, with OxyR transcription factor (BBa_K1104200) from iGEM13_NYMU-Taipeiunder and Reactive Oxygen Species induced promoter TrxCp (BBa_K1104201), and Blank (unmodified BL21 E. coli), under six H2O2 concentrations. Results indicate a significant difference between Sample A and Blank in all concentrations measured.
This is the relative fluorescence value (RFV)/OD600, an indication of promoter performance, of sample A and a control group under different H2O2 concentration. Similar to the trend of the original result from team NYMU-Taipei, the RFV/OD600 value tend to increase as the concentration of H2O2 increase, despite the gradual decreasing fluorescence value after the concentration exceed 1mM. Accelerating protein degradation of GFP might be a possible explanation for this distinction. Protein biodegradability is said to increase along with peroxide concentration.
Sequence and Features
- 10COMPATIBLE WITH RFC[10]
- 12COMPATIBLE WITH RFC[12]
- 21COMPATIBLE WITH RFC[21]
- 23COMPATIBLE WITH RFC[23]
- 25COMPATIBLE WITH RFC[25]
- 1000INCOMPATIBLE WITH RFC[1000]Illegal BsaI.rc site found at 773
