
Difference between revisions of "Part:BBa K1758333"
Abhi masih (Talk | contribs) |
Abhi masih (Talk | contribs) |
||
| Line 53: | Line 53: | ||
<h3>IISER Pune Characterisation</h3> | <h3>IISER Pune Characterisation</h3> | ||
<p>The emission and excitation spectra for the part was also determined as the reporter gene is sfGFP, a fluroscent protein.</p> | <p>The emission and excitation spectra for the part was also determined as the reporter gene is sfGFP, a fluroscent protein.</p> | ||
| − | <img src="https://2019.igem.org/wiki/images/b/b0/T--IISER-Pune-India--Biosensor_Spectrum.jpeg" , align = " | + | <img src="https://2019.igem.org/wiki/images/b/b0/T--IISER-Pune-India--Biosensor_Spectrum.jpeg" , align = "middle", alt="Spectra for Biosensor", height = 50, width = 150> |
<center><table> | <center><table> | ||
<tr> | <tr> | ||
Revision as of 17:35, 21 October 2019
Lead repressor under control of constitutive promoter and strong RBS Lead repressor under the control of a constitutive promoter with lead induceble promoter and 5´untranslated region in front of a sfGFP for detection.
Usage and Biology
For our biosensor we use parts of the chromosomal lead operon of Cupriavidus metallidurans (Ralstonia metallidurans). The promoter that we use is PbrA. This part of the operon is regulated by the repressor pbrR. The PbrR protein mediates Pb2+-inducible transcription. PbrR belongs to the MerR family, which are metal-sensing regulatory proteins (Borremans et al., 2001). Our sensor system is comprised of PbrR, which is under the control of a constitutive promoter and PbrA as well as a 5’ untranslated region, which controls the transcription of a sfGFP. The sfGFP protein is the measuring output signal.
Sequence and Features
- 10COMPATIBLE WITH RFC[10]
- 12INCOMPATIBLE WITH RFC[12]Illegal NheI site found at 465
Illegal NheI site found at 488 - 21COMPATIBLE WITH RFC[21]
- 23COMPATIBLE WITH RFC[23]
- 25COMPATIBLE WITH RFC[25]
- 1000INCOMPATIBLE WITH RFC[1000]Illegal SapI.rc site found at 640
Results
in vivo characterization
In addition to the other heavy metal sensors, we constructed a sensor for lead detection. It consists of the repressor PbrR which binds at the operator box downstream of the pbrAP promoter. The binding of the repressor is reversible in the presence of Pb2+ Ions. Those ions can weakened the repressors binding and hence, all genes downstream of the pbrAP promoter can be expressed. Like the former sensors this one encloses a sfGFP for detection via fluorescence. So if no lead is present in the media, the repressor binds to the operator box and the pbrAP promoter is blocked meaning that the transcription of sfGFP is prevented. No fluorescence signal is the results. By supplementation of lead, the repressor is separated from the operator box and the genes downstream of the promoter can be expressed.
The pbrAP promoter, the operator box and the PbrR repressor are parts of the chromosomal lead operon of Cupriavidus metallidurans (figure 1). This was cloned and transformed into E.coli KRX. This operon includes now the promoter pbrAP ( BBa_K1758332 )), which is regulated by the repressor PbrR. The PbrR belongs to the MerR family, of metal-sensing regulatory proteins, and is Pb2+-inducible. Our sensor system comprises pbrR ( BBa_K1758330 ) BBa_K1758330 ), which is under the control of a constitutive Promoter and pbrAP and a 5’ untranslated region, which controls the transcription of a sfGFP and increases the fluorescence. Fluorescence implemented by sfGFP protein is the measured output signal (figure 2 and figure 3).


The kinetic of our sensors response to different lead concentrations is shown in figure 2. The first 40 hours show a strong increase in fluorescence. After that the increase in fluorescence reaches a plateau. For better visualization the kinetics of figure 2 are represented as bars in figure 3. A fluorescence level difference for 60 min, 150 min and 650 min is represented.
The results of the lead sensor show no significant differences between the different concentrations (figure 3). This might be due to the pbrAP’s weak promoter strength in E. coli. Further reasons are most likely in the weak repressor binding to its operator. So, we suggest for the usage of this sensor, it has to be optimized. Moreover we were lacking time for further in vivo characterizations and different experimental setups. Hence, we did not use this sensor in further experiments regarding Cell-free-Protein-synthesis (CFPS). In the future a characterization in the CFPS systems would be desirable.
IISER Pune Characterisation
The emission and excitation spectra for the part was also determined as the reporter gene is sfGFP, a fluroscent protein.
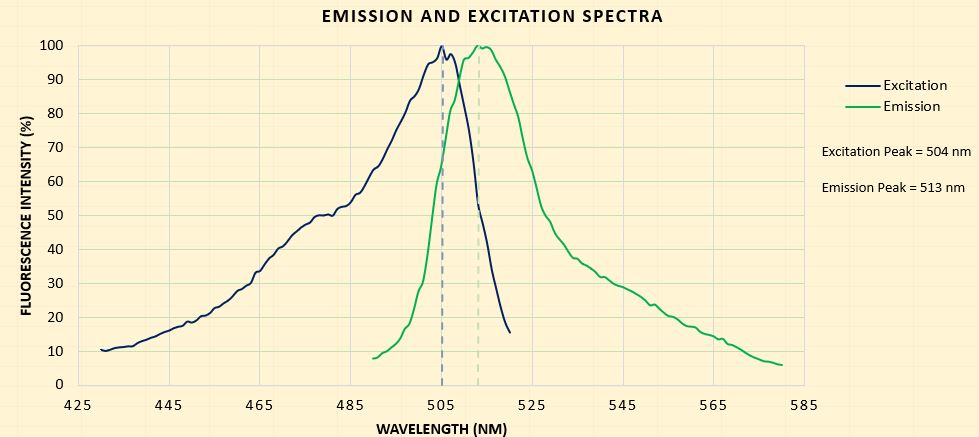
| Excitation Wavelength Measurement (nm) | 490 - 580 |
| Emission Wavelength (nm) | 513 |
| Emission Wavelength Measurement (nm) | 430 - 520 |
| Excitation Wavelength (nm) | 504 |
For characterization of this part, we noted the endpoint fluorescence readouts to determine the difference in fluorescence intensity over a range of lead concentrations. This characterization has been performed in E.coli DH5a cells by inducing the culture with the required amount of lead at an OD600 of 0.8 and then fluorescence is measured at saturation.
A linear fit has been done in the range of 0uM - 15 uM (as predicted by the model). This fit can then be used to predict the lead concentration of a sample based on the fluorescence intensity.
Modelling the Biosensor
A deterministic model based on Stamatakis et al,(2009) was made to describe the dynamics of the system.
From the graph we see that in 60 minutes the GFP readout reaches its maximum value.