Difference between revisions of "Part:BBa K1033929"
(→New characterisation) |
(→References) |
||
| (6 intermediate revisions by the same user not shown) | |||
| Line 16: | Line 16: | ||
===Usage and Biology=== | ===Usage and Biology=== | ||
| − | This part is useful as a reporter for | + | This part is useful as a reporter for biology. |
===New characterisation=== | ===New characterisation=== | ||
To better characterize the part [https://2019.igem.org/Team:Aix-Marseille iGEM19_Aix-Marseille_University]has measured the extinction coefficient and the thermal stability of the aeCP597 chromoprotein. | To better characterize the part [https://2019.igem.org/Team:Aix-Marseille iGEM19_Aix-Marseille_University]has measured the extinction coefficient and the thermal stability of the aeCP597 chromoprotein. | ||
| − | [[Image:T--Aix-Marseille--Parts absorbance.png]] | + | [[Image:T--Aix-Marseille--Parts absorbance.png|800px]] |
On the left is shown the calculated extinction coefficient spectrum. The extinction coefficient at the 597nm absorption maximum was determined to be 107000 +/- 5860 mM-1 cm-1. The major source of uncertainty in the extinction coefficient is the determination of the protein concentration that varies depending on the method used [https://2019.igem.org/Team:Aix-Marseille/Contribution see here for details]. This value is in excellent agreement with the published value, though the origin of this literature value is not clear [2]. To go further we have also characterized the thermal stability of the protein, by measuring the spectra at different temperatures [https://2019.igem.org/Team:Aix-Marseille/Contribution see here for experimental details]. Interestingly there is a small shift in the absorption maximum from 597 to 595 nm between 25°C and 30°C, see inset, and then at higher temperatures a progressive loss of the absorption peak and increase in scattering. To obtain a reliable estimation of the disappearance of the absorption peak as the protein denatures we have plotted the second derivative of the absorbance at 595nm as a function of temperature, in the right hand panel. This shows clearly that the protein is stable up to 60°C and then is progressively denatured up to 85°C. | On the left is shown the calculated extinction coefficient spectrum. The extinction coefficient at the 597nm absorption maximum was determined to be 107000 +/- 5860 mM-1 cm-1. The major source of uncertainty in the extinction coefficient is the determination of the protein concentration that varies depending on the method used [https://2019.igem.org/Team:Aix-Marseille/Contribution see here for details]. This value is in excellent agreement with the published value, though the origin of this literature value is not clear [2]. To go further we have also characterized the thermal stability of the protein, by measuring the spectra at different temperatures [https://2019.igem.org/Team:Aix-Marseille/Contribution see here for experimental details]. Interestingly there is a small shift in the absorption maximum from 597 to 595 nm between 25°C and 30°C, see inset, and then at higher temperatures a progressive loss of the absorption peak and increase in scattering. To obtain a reliable estimation of the disappearance of the absorption peak as the protein denatures we have plotted the second derivative of the absorbance at 595nm as a function of temperature, in the right hand panel. This shows clearly that the protein is stable up to 60°C and then is progressively denatured up to 85°C. | ||
| Line 27: | Line 27: | ||
===References=== | ===References=== | ||
[http://www.ncbi.nlm.nih.gov/pmc/articles/PMC1316306/]Shkrob, M.A., Yanushevich, Y.G., Chudakov, D.M., Gurskaya, N.G., Labas, Y.A., Poponov, S.Y., Mudrik, N.N., Lukyanov, S., Lukyanov, K.A., 2005. Far-red fluorescent proteins evolved from a blue chromoprotein from Actinia equina. Biochem. J. 392, 649–654. | [http://www.ncbi.nlm.nih.gov/pmc/articles/PMC1316306/]Shkrob, M.A., Yanushevich, Y.G., Chudakov, D.M., Gurskaya, N.G., Labas, Y.A., Poponov, S.Y., Mudrik, N.N., Lukyanov, S., Lukyanov, K.A., 2005. Far-red fluorescent proteins evolved from a blue chromoprotein from Actinia equina. Biochem. J. 392, 649–654. | ||
| − | |||
[http://www.ncbi.nlm.nih.gov/pmc/articles/PMC3829541/]Jan Laufer, Amit Jathoul, Martin Pule, and Paul Beard, 2013. In vitro characterization of genetically expressed absorbing proteins using photoacoustic spectroscopy Biomed. Opt. Express 4, 2477-2490. | [http://www.ncbi.nlm.nih.gov/pmc/articles/PMC3829541/]Jan Laufer, Amit Jathoul, Martin Pule, and Paul Beard, 2013. In vitro characterization of genetically expressed absorbing proteins using photoacoustic spectroscopy Biomed. Opt. Express 4, 2477-2490. | ||
Latest revision as of 15:27, 21 October 2019
aeBlue, blue chromoprotein (incl RBS)
aeBlue is a blue chromoprotein extracted from the basal disk of a beadlet anemone Actinia equina. The protein has an absorption maximum at 597nm and a deep blue colour. The protein aeBlue has significant sequence homologies with proteins in the GFP family.
Source
The protein was first extracted and characterized by Shkrob et. al. 2005 under the name aeCP597. This version is codon optimized for E coli by Bioneer Corp.
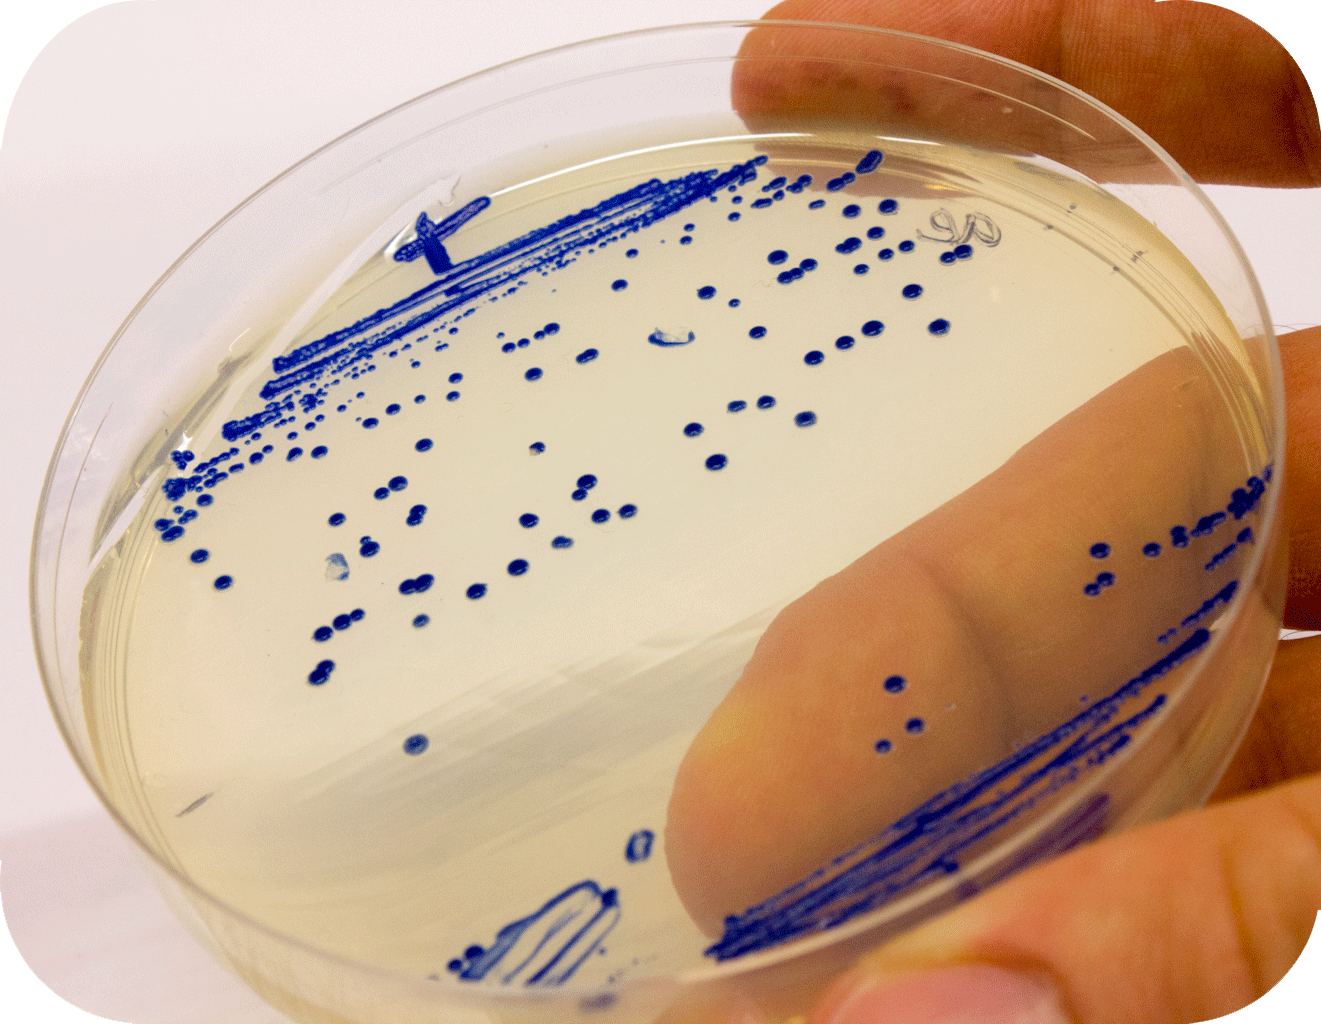
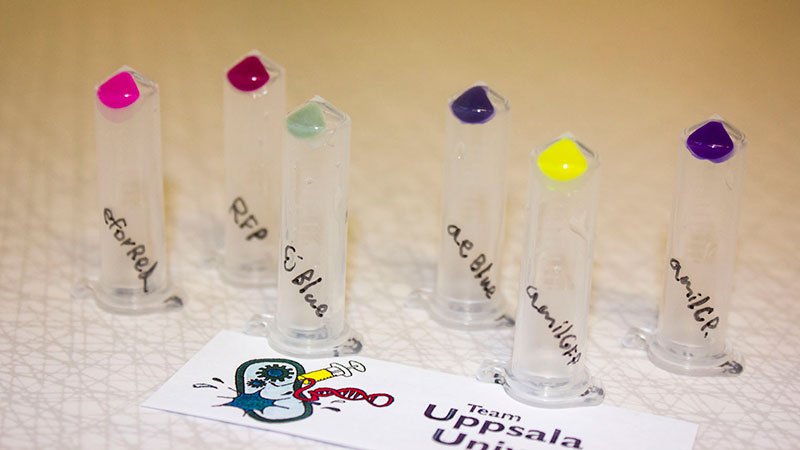
Below to the left is the expressed aeBlue in E coli. To the right comparison of aeBlue with other chromoproteins available from the registry.


iGEM12_Uppsala_University: Left picture: Visual color expression of aeBlue(BBa_K864401).
Right picture: The Uppsala chromoprotein collection and RFP. Pellets of bacteria expressing chromoproteins eforRed (BBa_K592012), RFP (BBa_E1010), cjBlue (BBa_K592011), aeBlue (BBa_K864401), amilGFP (BBa_K592010) and amilCP (BBa_K592009).
Usage and Biology
This part is useful as a reporter for biology.
New characterisation
To better characterize the part iGEM19_Aix-Marseille_Universityhas measured the extinction coefficient and the thermal stability of the aeCP597 chromoprotein.
On the left is shown the calculated extinction coefficient spectrum. The extinction coefficient at the 597nm absorption maximum was determined to be 107000 +/- 5860 mM-1 cm-1. The major source of uncertainty in the extinction coefficient is the determination of the protein concentration that varies depending on the method used see here for details. This value is in excellent agreement with the published value, though the origin of this literature value is not clear [2]. To go further we have also characterized the thermal stability of the protein, by measuring the spectra at different temperatures see here for experimental details. Interestingly there is a small shift in the absorption maximum from 597 to 595 nm between 25°C and 30°C, see inset, and then at higher temperatures a progressive loss of the absorption peak and increase in scattering. To obtain a reliable estimation of the disappearance of the absorption peak as the protein denatures we have plotted the second derivative of the absorbance at 595nm as a function of temperature, in the right hand panel. This shows clearly that the protein is stable up to 60°C and then is progressively denatured up to 85°C.
References
[http://www.ncbi.nlm.nih.gov/pmc/articles/PMC1316306/]Shkrob, M.A., Yanushevich, Y.G., Chudakov, D.M., Gurskaya, N.G., Labas, Y.A., Poponov, S.Y., Mudrik, N.N., Lukyanov, S., Lukyanov, K.A., 2005. Far-red fluorescent proteins evolved from a blue chromoprotein from Actinia equina. Biochem. J. 392, 649–654. [http://www.ncbi.nlm.nih.gov/pmc/articles/PMC3829541/]Jan Laufer, Amit Jathoul, Martin Pule, and Paul Beard, 2013. In vitro characterization of genetically expressed absorbing proteins using photoacoustic spectroscopy Biomed. Opt. Express 4, 2477-2490.
Sequence and Features
- 10COMPATIBLE WITH RFC[10]
- 12COMPATIBLE WITH RFC[12]
- 21COMPATIBLE WITH RFC[21]
- 23COMPATIBLE WITH RFC[23]
- 25COMPATIBLE WITH RFC[25]
- 1000COMPATIBLE WITH RFC[1000]

