
Difference between revisions of "Part:BBa K3187006"
JonathanFu (Talk | contribs) |
JonathanFu (Talk | contribs) |
||
| Line 7: | Line 7: | ||
<div class="col mx-2"> | <div class="col mx-2"> | ||
| − | < | + | <h1>Profile</h1> |
<table style=“width:80%“> | <table style=“width:80%“> | ||
<tr> | <tr> | ||
| Line 15: | Line 15: | ||
<tr> | <tr> | ||
<td><b>Base pairs</b></td> | <td><b>Base pairs</b></td> | ||
| − | <td> | + | <td>450</td> |
</tr> | </tr> | ||
<tr> | <tr> | ||
| Line 24: | Line 24: | ||
<td><b>Origin</b></td> | <td><b>Origin</b></td> | ||
<td><i>Staphylococcus aureus</i>, synthetic</td> | <td><i>Staphylococcus aureus</i>, synthetic</td> | ||
| − | |||
| − | |||
| − | |||
| − | |||
</tr> | </tr> | ||
<tr> | <tr> | ||
| Line 34: | Line 30: | ||
</tr> | </tr> | ||
</table> | </table> | ||
| − | + | <h1>Structure</h1> | |
| + | <img class="center" | ||
| + | src="https://2019.igem.org/wiki/images/1/18/T--TU_Darmstadt--Sortasegif4.gif" style="max-width:50%" /> | ||
| + | </a> | ||
| + | <div class="caption"> | ||
| + | <p> | ||
| + | <b> | ||
| + | Figure 1 : | ||
| + | </b> | ||
| + | 3D-Structure of Sortase A7M. To find out more, visit our<a href="https://2019.igem.org/Team:TU_Darmstadt/Model" target="_blank" > modeling page. | ||
| + | </a> | ||
| + | </p> | ||
| + | </div> | ||
<h1>Usage and Biology</h1> | <h1>Usage and Biology</h1> | ||
| Line 110: | Line 118: | ||
<p> | <p> | ||
| − | |||
| − | |||
| − | |||
| − | |||
| − | |||
| − | |||
| − | |||
| − | |||
| − | |||
| − | |||
| − | |||
| − | |||
| − | |||
| − | |||
| − | |||
| − | |||
| − | |||
| − | |||
| − | |||
| − | |||
| − | |||
| − | |||
<h1>Methods</h1> | <h1>Methods</h1> | ||
<h3>Cloning</h3> | <h3>Cloning</h3> | ||
| − | + | ||
<p>The methods used for cloning of the different mutants of the sortase were restriction and | <p>The methods used for cloning of the different mutants of the sortase were restriction and | ||
ligation via <i>NdeI</i> and <i>SalI</i> and Gibson assembly. The Sortase A5M was cloned | ligation via <i>NdeI</i> and <i>SalI</i> and Gibson assembly. The Sortase A5M was cloned | ||
into pET24(+) vector via restriction and ligation <i>NdeI</i> and <i>SalI</i> as restriction | into pET24(+) vector via restriction and ligation <i>NdeI</i> and <i>SalI</i> as restriction | ||
| − | enzymes. The vector posesses a kanamycin resistance and is controlled through a T7 promoter, | + | enzymes. The vector posesses a kanamycin resistance and the <i>srta7m</i> is controlled through a T7 promoter, |
which can be induced with IPTG. Sortase A7M is controlled by the same T7 promoter. | which can be induced with IPTG. Sortase A7M is controlled by the same T7 promoter. | ||
Sortas A, introduced by iGEM Stockholm 2016, was cloned via Gibson assembly into PSB1C3. | Sortas A, introduced by iGEM Stockholm 2016, was cloned via Gibson assembly into PSB1C3. | ||
| Line 180: | Line 166: | ||
FRET-Pair. By transferring the energy from donor to acceptor, the donor's emission is reduced | FRET-Pair. By transferring the energy from donor to acceptor, the donor's emission is reduced | ||
and the intensity of the acceptors emission is increased . The efficiency depends on the distance between the fluorophore, the orientation and the | and the intensity of the acceptors emission is increased . The efficiency depends on the distance between the fluorophore, the orientation and the | ||
| − | spectral characteristics . You can see the principle of FRET in <b>Fig. | + | spectral characteristics . You can see the principle of FRET in <b>Fig. 2</b>. |
</p> | </p> | ||
| Line 189: | Line 175: | ||
<p> | <p> | ||
<b> | <b> | ||
| − | Figure | + | Figure 2 : |
</b> | </b> | ||
Jablonski diagram showing the energy transfer between a FRET-pair (design based on Wikipedia). | Jablonski diagram showing the energy transfer between a FRET-pair (design based on Wikipedia). | ||
| Line 196: | Line 182: | ||
| − | |||
<h1>Results</h1> | <h1>Results</h1> | ||
| − | <h2>Characterization of Sortase A5M (and comparison to | + | <h2>Characterization of Sortase A5M (and comparison to <a |
| + | href="https://parts.igem.org/Part:BBa_K3187028" | ||
| + | target="_blank">BBa_K3187028</a>) | ||
| + | </h2> | ||
<h3>How do we measure if our purified sortases are active?</h3> | <h3>How do we measure if our purified sortases are active?</h3> | ||
<p>After purification of the sortases, we first performed SDS-PAGEs to verify that they are pure and | <p>After purification of the sortases, we first performed SDS-PAGEs to verify that they are pure and | ||
| Line 211: | Line 199: | ||
<img class="center" | <img class="center" | ||
src="https://2019.igem.org/wiki/images/5/59/T--TU_Darmstadt--SDS_Sortase_A7M_Sortase_A5M.png" | src="https://2019.igem.org/wiki/images/5/59/T--TU_Darmstadt--SDS_Sortase_A7M_Sortase_A5M.png" | ||
| − | style="max-width: | + | style="max-width:30%" /> |
</a> | </a> | ||
<div class="caption"> | <div class="caption"> | ||
<p> | <p> | ||
<b> | <b> | ||
| − | Figure | + | Figure 3 : |
</b> | </b> | ||
SDS-PAGE of Sortase A7M and Sortase A5M where the bands show up at | SDS-PAGE of Sortase A7M and Sortase A5M where the bands show up at | ||
| − | + | approximately 15 kDa. Our estimated size for Sortase A7M was 17.85 kDa, | |
| − | + | and for Sortase A5M 18.07 kDa. This confirms the result shown on the gel, | |
| − | + | since the band of Sortase A5M is a little higher than the one of Sortase A7M. | |
</p> | </p> | ||
</div> | </div> | ||
| Line 236: | Line 224: | ||
<p> | <p> | ||
<b> | <b> | ||
| − | Figure | + | Figure 4 : |
| − | + | ||
</b> | </b> | ||
| − | + | <b>a)</b> Fluorescence gel of the sortase-reaction of GGGG-mCherry and mCherry-LPETGG | |
mediated by Sortase A7M incubated for 2 h and | mediated by Sortase A7M incubated for 2 h and | ||
4 h each. Reaction solutions were mixed with different ratios from enzyme to | 4 h each. Reaction solutions were mixed with different ratios from enzyme to | ||
| Line 289: | Line 276: | ||
</p> | </p> | ||
</div> | </div> | ||
| − | <h3> | + | <h3>How do we measure sortase reaction kinetics</h3> |
<p> | <p> | ||
In the above described assays, we noticed the impact of enzyme-substrate ratio and reaction | In the above described assays, we noticed the impact of enzyme-substrate ratio and reaction | ||
| Line 315: | Line 302: | ||
<img class="img-fluid center" | <img class="img-fluid center" | ||
src="https://2019.igem.org/wiki/images/d/d4/T--TU_Darmstadt--TAMRA_mCherry.JPG" | src="https://2019.igem.org/wiki/images/d/d4/T--TU_Darmstadt--TAMRA_mCherry.JPG" | ||
| − | style="max-width: | + | style="max-width:80%" /> |
</a> | </a> | ||
<div class="caption"> | <div class="caption"> | ||
<p> | <p> | ||
<b> | <b> | ||
| − | Figure | + | Figure 5 : |
</b> | </b> | ||
| − | + | Design of a FRET-pair of 5-TAMRA-LPETG (TAMRA) and GGGG-mCherry (mCherry). In | |
this configuration TAMRA acts as donor and mCherry as acceptor. When the two | this configuration TAMRA acts as donor and mCherry as acceptor. When the two | ||
fluorophores are not linked via the substrates of the sortase only TAMRA is being | fluorophores are not linked via the substrates of the sortase only TAMRA is being | ||
| Line 357: | Line 344: | ||
<p> | <p> | ||
<b> | <b> | ||
| − | Figure | + | Figure 6 : |
</b> | </b> | ||
| − | + | The graph shows the extinction and emission spectra of TAMRA and mCherry. Due | |
to the large overlap of TAMRA emission and mCherry extinction it is possible to perform | to the large overlap of TAMRA emission and mCherry extinction it is possible to perform | ||
a FRET with this pair of fluorophores. The graph show the relative fluorescence unit | a FRET with this pair of fluorophores. The graph show the relative fluorescence unit | ||
| Line 385: | Line 372: | ||
style="max-width:50%" /> | style="max-width:50%" /> | ||
</a> | </a> | ||
| + | <div class="caption"> | ||
| + | <p> | ||
| + | <b> | ||
| + | Figure 7 : | ||
| + | </b> | ||
| + | Spectrum of the negative control of TAMRA and mCherry, | ||
| + | without Sortase A7M, over the course of 20 min in 5 min intervals. | ||
| + | Depicted are the emission wavelengths against the RFU. | ||
| + | </p> | ||
| + | </div> | ||
<img class="img-fluid center" | <img class="img-fluid center" | ||
| Line 393: | Line 390: | ||
<p> | <p> | ||
<b> | <b> | ||
| − | Figure | + | Figure 8 : |
</b> | </b> | ||
| − | + | Spectrum of TAMRA and mCherry, with Sortase A7M, over the course of | |
20 min in 5 min intervals. Depicted are the emission wavelengths against the | 20 min in 5 min intervals. Depicted are the emission wavelengths against the | ||
RFU. The sortase-mediated ligation results in a decline of both emission peaks. | RFU. The sortase-mediated ligation results in a decline of both emission peaks. | ||
| Line 417: | Line 414: | ||
<p> | <p> | ||
<b> | <b> | ||
| − | Figure | + | Figure 9 : |
</b> | </b> | ||
Sortase reaction in TAMRA mCherry FRET after subtracting the negative control. | Sortase reaction in TAMRA mCherry FRET after subtracting the negative control. | ||
| − | Depicted is the difference in RFU over time [min]. | + | Depicted is the difference in RFU over time [min]. Within the first 20 min of the |
substrate conversion is the quickest. At 30 min a plateau is reached. After | substrate conversion is the quickest. At 30 min a plateau is reached. After | ||
60 min starts catalyzing the reverse reaction. The mean ΔRFU value was normalized | 60 min starts catalyzing the reverse reaction. The mean ΔRFU value was normalized | ||
| Line 441: | Line 438: | ||
style="max-width:60%" /> | style="max-width:60%" /> | ||
</a> | </a> | ||
| − | + | <div class="caption"> | |
| + | <p> | ||
| + | <b> | ||
| + | Figure 10 : | ||
| + | </b> | ||
| + | The graph shows the extinction and emission spectra of | ||
| + | TAMRA and mCherry. Due to the large overlap of sfGFP emission and TAMRA | ||
| + | extinction it is possible to perform a FRET with this pair of fluorophores. | ||
| + | The graph show the relative fluorescence unit (RFU[%]) in relation to the extincted/emitted | ||
| + | wavelength [nm]. The peaks are normalized to 100 %. | ||
| + | </p> | ||
| + | </div> | ||
<img class="img-fluid center" | <img class="img-fluid center" | ||
src="https://2019.igem.org/wiki/images/c/c0/T--TU_Darmstadt--Tamra_GFP_Johny.jpg" | src="https://2019.igem.org/wiki/images/c/c0/T--TU_Darmstadt--Tamra_GFP_Johny.jpg" | ||
| − | style="max-width: | + | style="max-width:80%" /> |
</a> | </a> | ||
<div class="caption"> | <div class="caption"> | ||
<p> | <p> | ||
<b> | <b> | ||
| − | Figure | + | Figure 11 : |
</b> | </b> | ||
Design of a FRET-pair of 5-TAMRA-LPETG (TAMRA) and GGGG-sfGFP (sfGFP). In this | Design of a FRET-pair of 5-TAMRA-LPETG (TAMRA) and GGGG-sfGFP (sfGFP). In this | ||
| Line 469: | Line 477: | ||
style="max-width:50%" /> | style="max-width:50%" /> | ||
</a> | </a> | ||
| − | + | <div class="caption"> | |
| + | <p> | ||
| + | <b> | ||
| + | Figure 12 : | ||
| + | </b> | ||
| + | Spectrum of the negative control of TAMRA and sfGFP, | ||
| + | without Sortase A7M, over the course of 25 min in 5 min intervals. | ||
| + | Depicted are the emission wavelengths against the RFU. | ||
| + | </p> | ||
| + | </div> | ||
<img class="img-fluid center" | <img class="img-fluid center" | ||
src="https://2019.igem.org/wiki/images/0/04/T--TU_Darmstadt--Sortase_A7M_Proof_N2_With_Sortase_A7M.png" | src="https://2019.igem.org/wiki/images/0/04/T--TU_Darmstadt--Sortase_A7M_Proof_N2_With_Sortase_A7M.png" | ||
| Line 477: | Line 494: | ||
<p> | <p> | ||
<b> | <b> | ||
| − | Figure | + | Figure 13 : |
</b> | </b> | ||
| − | + | Spectrum of TAMRA and sfGFP, with Sortase A7M, over the course of | |
25 min in 5 min intervals. Depicted are the emission wavelengths against the | 25 min in 5 min intervals. Depicted are the emission wavelengths against the | ||
RFU. The sortase-mediated ligation results in a decline of both emission peaks. | RFU. The sortase-mediated ligation results in a decline of both emission peaks. | ||
| Line 510: | Line 527: | ||
<p> | <p> | ||
<b> | <b> | ||
| − | Figure | + | Figure 14 : |
</b> | </b> | ||
| − | + | Animation of Sortase A7M enzyme kinetics over the course of 3 h. The | |
reaction speed increases radically in the beginning moving from RFU 8000 to RFU 6000 | reaction speed increases radically in the beginning moving from RFU 8000 to RFU 6000 | ||
at λ = 550 nm where a plateau is reached (blue). The negative control | at λ = 550 nm where a plateau is reached (blue). The negative control | ||
| Line 526: | Line 543: | ||
reaction mix improves the initial product formation. For this, we used the | reaction mix improves the initial product formation. For this, we used the | ||
TAMRA-LPETG : GGGG-mCherry FRET pair. We measured the FRET change over time in a | TAMRA-LPETG : GGGG-mCherry FRET pair. We measured the FRET change over time in a | ||
| − | multiwell platereader <b>(Fig. | + | multiwell platereader <b>(Fig. 15)</b>. |
</p> | </p> | ||
<img class="img-fluid center" | <img class="img-fluid center" | ||
| Line 535: | Line 552: | ||
<p> | <p> | ||
<b> | <b> | ||
| − | Figure | + | Figure 15 : |
</b> | </b> | ||
Reaction kinetics of Sortase A7M in different concentrations at same | Reaction kinetics of Sortase A7M in different concentrations at same | ||
| Line 565: | Line 582: | ||
<p> Firstly, we confirmed that in contrast to Sortase A5M, <b>Sortase A7M is | <p> Firstly, we confirmed that in contrast to Sortase A5M, <b>Sortase A7M is | ||
Ca<sup>2+</sup>-independent.</b> | Ca<sup>2+</sup>-independent.</b> | ||
| − | The results are shown in <b>Fig. | + | The results are shown in <b>Fig. 16</b> |
Sortase A7M also works in presence of Ca<sup>2+</sup>, but these FRET experiments made | Sortase A7M also works in presence of Ca<sup>2+</sup>, but these FRET experiments made | ||
us | us | ||
| Line 577: | Line 594: | ||
<p> | <p> | ||
<b> | <b> | ||
| − | Figure | + | Figure 16 : |
</b> | </b> | ||
Sortase A7M FRET-assay of connecting TAMRA-LPETG with GGGG-sfGFP with | Sortase A7M FRET-assay of connecting TAMRA-LPETG with GGGG-sfGFP with | ||
| Line 591: | Line 608: | ||
</div> | </div> | ||
<p> Secondly, we confirmed that <b>Sortase A5M is inactive if Ca<sup>2+</sup> is | <p> Secondly, we confirmed that <b>Sortase A5M is inactive if Ca<sup>2+</sup> is | ||
| − | absent</b>, which can be seen in <b>Fig. | + | absent</b>, which can be seen in <b>Fig. 17</b> |
As expected, Sortase A5M shows increasing enzymatic activity with increasing | As expected, Sortase A5M shows increasing enzymatic activity with increasing | ||
Ca<sup>2+</sup> levels. The reaction runs fastest with 2 mM Ca<sup>2+</sup>, and the | Ca<sup>2+</sup> levels. The reaction runs fastest with 2 mM Ca<sup>2+</sup>, and the | ||
| Line 603: | Line 620: | ||
style="max-width:65%" /> | style="max-width:65%" /> | ||
</a> | </a> | ||
| − | + | ||
<img class="img-fluid center" | <img class="img-fluid center" | ||
src="https://2019.igem.org/wiki/images/4/4d/T--TU_Darmstadt--FRET_SrtA7M_ohneCa2%2B.png" | src="https://2019.igem.org/wiki/images/4/4d/T--TU_Darmstadt--FRET_SrtA7M_ohneCa2%2B.png" | ||
| Line 611: | Line 628: | ||
<p> | <p> | ||
<b> | <b> | ||
| − | Figure | + | Figure 17 : |
</b> | </b> | ||
Both figures show Sortase A5M FRET assay connecting TAMRA-LPETG and | Both figures show Sortase A5M FRET assay connecting TAMRA-LPETG and | ||
| Line 625: | Line 642: | ||
Ca<sup>2+</sup>-independent, since it shows | Ca<sup>2+</sup>-independent, since it shows | ||
linking activity without calcium in the vicinity. The enzyme mutant also works in presence | linking activity without calcium in the vicinity. The enzyme mutant also works in presence | ||
| − | of Ca<sup>2+</sup> (<b>Fig. | + | of Ca<sup>2+</sup> (<b>Fig. 17</b>), |
but these FRET experiments made us suspect that Ca<sup>2+</sup> may even inhibit | but these FRET experiments made us suspect that Ca<sup>2+</sup> may even inhibit | ||
Sortase A7M, since it shows less activity with calcium around than without calcium. | Sortase A7M, since it shows less activity with calcium around than without calcium. | ||
</p> | </p> | ||
| − | + | ||
| − | + | ||
| − | + | ||
| − | + | ||
| − | + | ||
| − | + | ||
| − | + | ||
| − | + | ||
| − | + | ||
| − | + | ||
| − | + | ||
| − | + | ||
| − | + | ||
| − | + | ||
| − | + | ||
| − | + | ||
| − | + | ||
| − | + | ||
| − | + | ||
| − | + | ||
| − | + | ||
| − | + | ||
| − | + | ||
| − | + | ||
| − | + | ||
| − | + | ||
| − | + | ||
| − | + | ||
| − | + | ||
| − | + | ||
| − | + | ||
| − | + | ||
| − | + | ||
<img class="img-fluid center" | <img class="img-fluid center" | ||
src="https://2019.igem.org/wiki/images/c/c7/T--TU_Darmstadt--Vergleich_A7M_A5M_bei_opt_Bedingung.png" | src="https://2019.igem.org/wiki/images/c/c7/T--TU_Darmstadt--Vergleich_A7M_A5M_bei_opt_Bedingung.png" | ||
| Line 669: | Line 654: | ||
<p> | <p> | ||
<b> | <b> | ||
| − | Figure | + | Figure 19 : |
</b> | </b> | ||
Comparison of the reaction speed of | Comparison of the reaction speed of | ||
| Line 679: | Line 664: | ||
When we compare the reaction speed of Sortase A5M and Sortase A7M, | When we compare the reaction speed of Sortase A5M and Sortase A7M, | ||
Sortase A5M is the | Sortase A5M is the | ||
| − | clear winner. However, this means of course that the reverse reaction is also faster in the | + | clear winner (see <b>Fig. : 19</b>). However, this means of course that the reverse reaction is also faster in the |
case of Sortase A5M. | case of Sortase A5M. | ||
Consequently, Sortase A7M is the best variant for in vivo modification of our VLPs as | Consequently, Sortase A7M is the best variant for in vivo modification of our VLPs as | ||
| Line 686: | Line 671: | ||
enzyme variant for in vitro modification due to its high efficiency. | enzyme variant for in vitro modification due to its high efficiency. | ||
</p> | </p> | ||
| − | |||
</html> | </html> | ||
Revision as of 14:43, 21 October 2019
Sortase A5M expression cassette
Profile
| Name | Sortase A5M |
| Base pairs | 450 |
| Molecular weight | 17.85 kDa |
| Origin | Staphylococcus aureus, synthetic |
| Properties | Ca2+-dependent, transpeptidase, linking sorting motif LPXTG to poly-glycine Tag |
Structure

Figure 1 : 3D-Structure of Sortase A7M. To find out more, visit our modeling page.
Usage and Biology
Transpeptidase: Sortase
Sortases belong to the class of transpeptidases and are mostly found in gram-positive bacteria.
The high rate of resistance to several antibiotics targeting gram-positive bacteria is also based on the
property of this enzyme class. Sortases can non-specifically attach virulence and
adhesion‐associated proteins to the peptidoglycans of the cell-surface.
In general, sortases are divided into six groups (A-F) that have slightly different properties and
perform three tasks in cells. Group A and B attach proteins to the cell-surface while Group C and D help
building pilin-like structures. Group E and F are not properly investigated yet which is why their exact
function is not known.
For our project we are especially interested in the sortases of the group A since they
covalently attach various proteins or peptides on the cell membrane as long as their targeting
motif is at the C-terminus of the corresponding protein. In comparison to other transpeptidases
Sortase A has the advantage that it is rather stable regarding variations in pH
Sortase A catalyzes the formation and cleavage of a peptide bond between the C-terminal
LPXTG amino acid motif and an N-terminal poly-glycine motif. The enzyme originates from
Staphylococcus aureus and is able to connect any two proteins as long as they possess those
matching target sequences. In the pentapeptide motif LPXTG, X can be any amino acid except cysteine.
Sortase A is rather promiscuous with regard to the amino acid sequence directly upstream of
this motif, a fact that makes it optimal for labeling applications. Even better, amino acids C-terminal
of the poly-glycine motif are not constrained to a certain sequence.
Reaction
To better understand how the enzymatic reaction works it is necessary to look at the crystal structure of Sortase A. The enyzme consists of an eight-stranded β‐barrel fold structure. The active site is hydrophobic and contains the catalytic cysteine residue Cys184 as well as a key histidine residue H120 that can form a thiolate-imidazolium with the neighboring cysteine. An additional structural property that also other sortases show is the calcium binding site formed by the β3/β4 loop. The binding of a calcium ion slows the motion of the active site by coordinating to a residue in the β6/β7 loop. This helps binding the substrate and increasing the enzymatic activity nearly eightfold. When a substrate gets into the active site, the cysteine attacks the amide bond between the threonine and the glycine in the LPXTG motif. After this the protonated imidazolium serves as an acid for the departing glycine with unbound NH2 of the former amide bond while the rest of the motif is bound to the cysteine residue. Another glycine nucleophile is then necessary in its deprotonated form to attack the thioester and re-establish an amide bond at the LPET-motif. This reaction is dead-ended if the used nucleophile is water. Due to the fact that the mechanism is based on protonated forms of the catalytic residues the reaction is quite pH-dependent. Although the Sortase A in general is relatively stable between pH 3 and 11 the reaction works best around pH 8.
Sortase variants
Due to the fact that the wildtype Sortase A shows rather slow kinetics, a pentamutant has been developed (Sortase A5M). This version of the enzyme carries mutations in P94R/D160N/D165A/K190E/K196T which lead to a 140- fold increase in activity. Thereby, reaction rates are improved even at low temperature, however, Sortase A5M is still Ca2+-dependent. This dependence interferes with potential in vivo usage, as the concentrations of calcium in living cells can vary considerably. Hence a sortase mutant that acts across high differences in calcium concentrations or even works completely Ca2+-independently would be required for in vivo applications of sortase. To attain a high yield enzyme which is also calcium-independent Ca2+-independent mutations were combined with the Sortase A5M resulting in Sortase A7 variants such as the Sortase A7M. The newly achieved calcium-independence of these variants enable sortase applications not only in vitro but in vivo as well.
Methods
Cloning
The methods used for cloning of the different mutants of the sortase were restriction and ligation via NdeI and SalI and Gibson assembly. The Sortase A5M was cloned into pET24(+) vector via restriction and ligation NdeI and SalI as restriction enzymes. The vector posesses a kanamycin resistance and the srta7m is controlled through a T7 promoter, which can be induced with IPTG. Sortase A7M is controlled by the same T7 promoter. Sortas A, introduced by iGEM Stockholm 2016, was cloned via Gibson assembly into PSB1C3. This has a chloramphenicol resistance and is also controlled under a T7 promoter. Cloning of all products was checked via sequencing.
Expression and purification
After successfully transforming our sortase genes in BL21 cells, we inoculated 100 mL overnight cultures, with the respective antibiotic. The next day 1 L cultures were inoculated with the overnight culture to reach OD600 = 0.1. Subsequently the cultures were incubated under constant shaking at 37 °C until they reached OD600 = 0.6. At OD600 = 0.6 the cultures were induced with 0.5 mL of 1 M Isopropyl-β-D-thiogalactopyranosid (IPTG). The gene expression was performed at 30 °C under constant shaking overnight. After expression of Sortase A7M, Sortase A5M, and Sortase A from Stockholm (BBa_K2144008) in BL21 cultures the cells were crushed via EmulsiFlex (Avestin) and proteins were purified through affinity chromatography via Fast Protein Liquid Chromatography (FPLC) with the ÄKTA pure (GE Healthcare, Illinois, USA). His-Tag was used for purification of Sortase A7M and Sortase A (Stockholm) and Strep-Tag II was used for purification of Sortase A5M.
SDS-Page
To verify the successful production of of Sortase A7M, Sortase A5M, and Sortase A SDS-PAGEs were performed. The resulting bands were compared to the molecular weight of the different sortase variants. Also, SDS-PAGEs were completed to verify enzymatic activity in assays prior to measuring sortase properties via Fluorescence Resonance Energy Transfer (FRET).
Flourescence Resonance Energy Transfer (FRET)
To determine the kinetics of our transpeptidase variants, FRET assays were performed in 384 well-plates (dark) using a Tecan plate reader. A FRET relies on the phenomenon that an excited fluorophore (donor) transfers energy to another fluorophore (acceptor), thereby exciting it. This process only works if both fluorescent molecules are in close proximity and depends on the FRET-Pair. By transferring the energy from donor to acceptor, the donor's emission is reduced and the intensity of the acceptors emission is increased . The efficiency depends on the distance between the fluorophore, the orientation and the spectral characteristics . You can see the principle of FRET in Fig. 2.
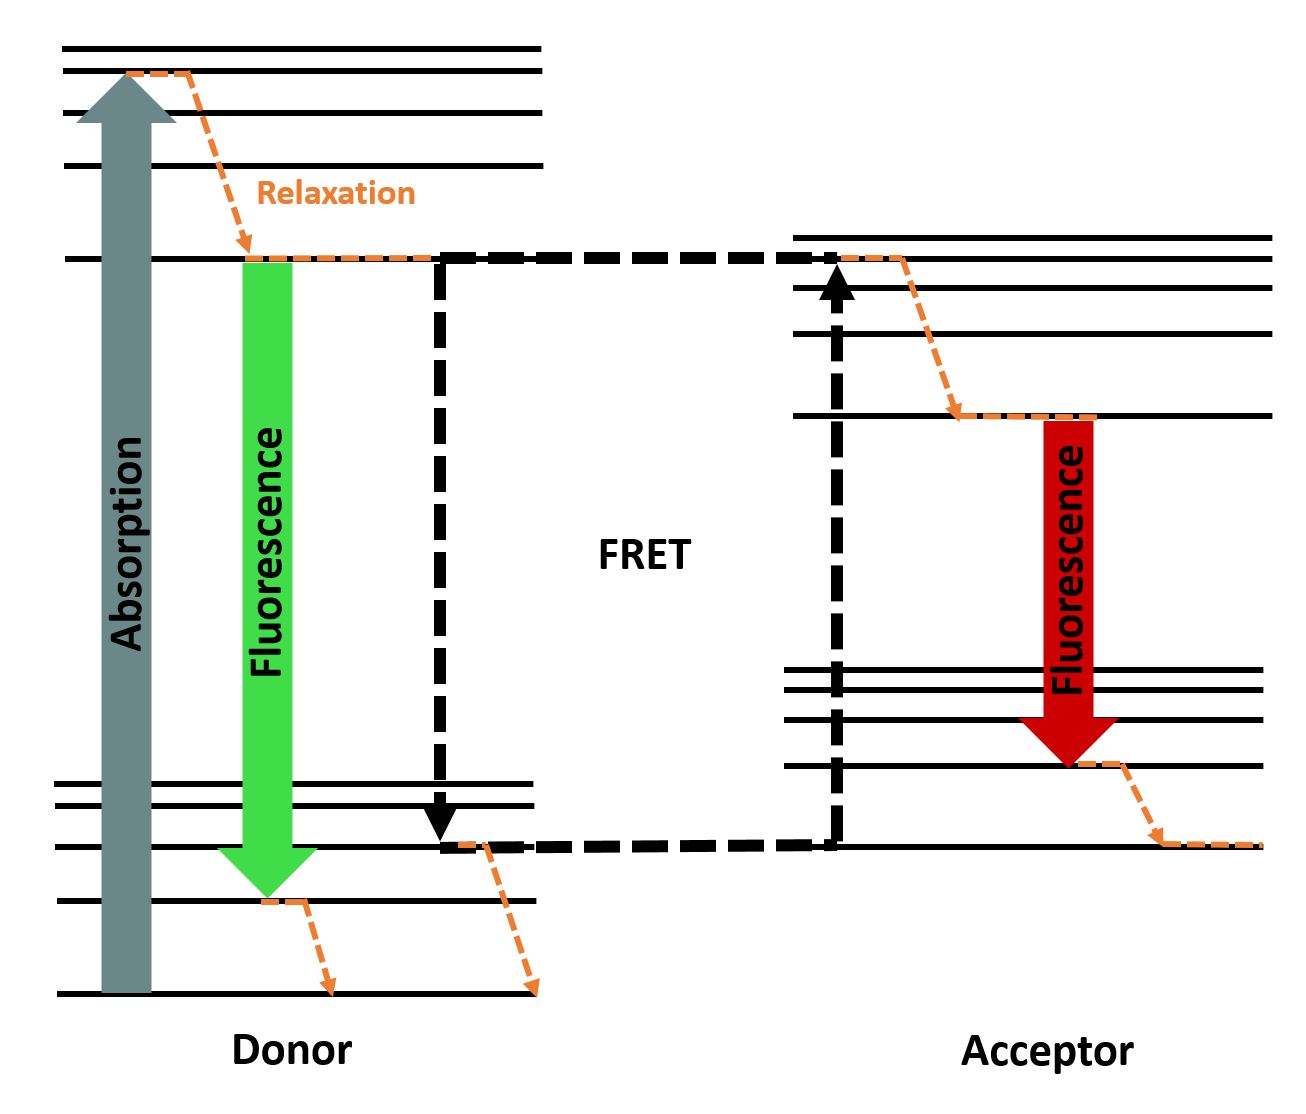
Figure 2 : Jablonski diagram showing the energy transfer between a FRET-pair (design based on Wikipedia).
Results
Characterization of Sortase A5M (and comparison to BBa_K3187028)
How do we measure if our purified sortases are active?
After purification of the sortases, we first performed SDS-PAGEs to verify that they are pure and monomeric. You can see in Fig. 3 that the purifications were successful. Next, we tested if the purified sortases connect two proteins that carry the important Sortase-recognition tags, N-terminal polyG and C-terminal LPETGG. Therefore, we added the sortases to a mix of GGGG-mCherry and mCherry-LPETGG. The reactions were performed in different buffers, at different enzyme-to-substrate ratios and for different time spans. We performed an SDS-PAGE, and prior to Coomassie staining, we recorded fluorescent images of the gel. Thereby, we could identify mCherry bands in the gel.

Figure 3 : SDS-PAGE of Sortase A7M and Sortase A5M where the bands show up at approximately 15 kDa. Our estimated size for Sortase A7M was 17.85 kDa, and for Sortase A5M 18.07 kDa. This confirms the result shown on the gel, since the band of Sortase A5M is a little higher than the one of Sortase A7M.


Figure 4 :
a) Fluorescence gel of the sortase-reaction of GGGG-mCherry and mCherry-LPETGG
mediated by Sortase A7M incubated for 2 h and
4 h each. Reaction solutions were mixed with different ratios from enzyme to
substrate concentration(1:3;1:10) and each incubated in two different buffers(Tris-HCl
and Ammoniumdicarbonat).
Product bands at a height of about 57 kDa can be seen in lane 4, 5, 6, 8, 9 (from
left to right). The bands below the product at about 38 kDa could be semi-denatured
mCherry dimers.
b) Fluorescence gel on top of the coomassie-stained gel of the sortase-reaction
of GGGG-mCherry and mCherry-LPETGG mediated by Sortase A7M incubated for 2 h
and
4 h each. Reaction solutions were mixed with different ratios from enzyme to
substrate concentration(1:3;1:10) and each incubated in two different buffers (Tris-HCl
and Ammoniumdicarbonat).
Product bands at a height of about 57 kDa can be seen in lane 4, 5, 6, 8, 9 (from
left to right). The bands below the product at about 38 kDa could be semi-denatured
mCherry dimers. Additionally, Sortase A7M can be seen at 17 kDaA7M.The
unprocessed mCherry monomers can be seen at 28 kDa.
As shown in Fig. 4, under certain conditions, a product band appeared at the expected size of 57.3 kDa (28.5+28.8 kDa). From this first activity test, we draw three conclusions:
- Our purified Sortase A7M is active
- The enzyme-substrate ratio affects the product yield
- The duration of the reaction affects the product yield
Additionally, TRIS buffer seems to alter the coomassie staining efficiency of Sortase A7M.
This endpoint measurement gave us a first impression that our Sortase A7M works nicely. Of
course, we wanted to further characterize the parameters of the reaction. When we understand
the Sortase better, modification of our VLPs will become more straightforward.
How do we measure sortase reaction kinetics
In the above described assays, we noticed the impact of enzyme-substrate ratio and reaction duration on the overall product yield. We thought about how to further measure the kinetics of the sortase reaction. In the literature, sortase reaction kinetics are often measured by FRET-assays. Therefore, we designed a suitable FRET-assay. In the end, we came up with a new FRET pair not described in the literature to date: 5-TAMRA-LPETG and GGGG-sfGFP.
Development of a new FRET pair
For characterization of the reaction kinetics of Sortase A7M, Sortase A5M and Sortase A, we decided to develop a suitable FRET pair. In order to find an optimal FRET pair, we first recorded an emission and absorption spectrum of 5-Carboxytetramethylrhodamin-LPETG (TAMRA) and GGGG-mCherry to verify the suitability for the FRET effect, checking for a possible overlap between the donor's emission and the acceptor's extinction.

Figure 5 : Design of a FRET-pair of 5-TAMRA-LPETG (TAMRA) and GGGG-mCherry (mCherry). In this configuration TAMRA acts as donor and mCherry as acceptor. When the two fluorophores are not linked via the substrates of the sortase only TAMRA is being excited. After sortase mediated ligation of the two substrates mCherry is the fluorophore being excited via the FRET and the emission of mCherry intensifies. Meanwhile, the emission of TAMRA decreases.
TAMRA is a chemical fluorophore that has an absorbance maximum at 542 nm and an emission
maximum at
570 nm. The
terminal carboxy
group of the dye was linked via a lysine linker to the LPETG sequence (see Fig. 5).
mCherry has
an N-terminal poly-glycine sequence and can therefore be linked to the LPETG motif of TAMRA via
the
Sortase A. For a sufficient FRET-effect, it is also necessary that the distance between
donor and
acceptor is lower than the Förster radius. The Förster radius describes the distance between two
fluorophores at which 50 % of the energy is transferred.
First, we wanted to identify which concentrations are needed for our experiment, then set up the
reaction
and measured fluorescence intensities. Over time, a decline in the emission of TAMRA can be
observed as
Sortase A7M/A5M is converting more educts to products.

Figure 6 : The graph shows the extinction and emission spectra of TAMRA and mCherry. Due to the large overlap of TAMRA emission and mCherry extinction it is possible to perform a FRET with this pair of fluorophores. The graph show the relative fluorescence unit (RFU[%]) in relation to the extincted/emitted wavelength [nm]. The peaks are normalized to 100 %.
The emission and extinction spectra of TAMRA and mCherry exhibit an overlap of emission of TAMRA and extinction of mCherry. Based on this output, a FRET-assay for the kinetics of Sortase A7M was performed to confirm whether the FRET-pair is working. As TAMRA is excited with light of a lower wavelength than mCherry, the former serves as FRET donor and the latter as acceptor. We chose the excitation wavelength at 485 nm to prevent unnecessary “leak” excitation of mCherry. Nevertheless, an extinction of mCherry could not be excluded and may have negative effects on the visibility of the FRET.

Figure 7 : Spectrum of the negative control of TAMRA and mCherry, without Sortase A7M, over the course of 20 min in 5 min intervals. Depicted are the emission wavelengths against the RFU.

Figure 8 : Spectrum of TAMRA and mCherry, with Sortase A7M, over the course of 20 min in 5 min intervals. Depicted are the emission wavelengths against the RFU. The sortase-mediated ligation results in a decline of both emission peaks.
The analysis of the data shown in Fig. 7 confirmed the aforementioned suspicion that mCherry is also excited at 485 nm, which makes differentiation of the fluorescence more difficult. Furthermore, Fig. 8 shows that the difference in the decline of TAMRA is not significant. Accordingly, a decline in the emission maximum of TAMRA over time is also visible in the negative control. One reason might be bleaching of TAMRA through the excitation by the laser. Nevertheless, conversion by the Sortase A7M can be observed by comparing the results with the negative control.

Figure 9 : Sortase reaction in TAMRA mCherry FRET after subtracting the negative control. Depicted is the difference in RFU over time [min]. Within the first 20 min of the substrate conversion is the quickest. At 30 min a plateau is reached. After 60 min starts catalyzing the reverse reaction. The mean ΔRFU value was normalized to zero for better visualization.
To confirm the functionality of the Sortase A7M, another more sufficient FRET-pair was developed. The measured absorbance and emission spectra indicated that TAMRA and superfolder green fluorescence protein (sfGFP) are a possible FRET-pair. The sfGFP has an N-terminal polyglycine sequence and can therefore be linked to TAMRA with the sorting motif, in the same way as mCherry was connected. However, the small overlap between the extinction spectra of sfGFP and TAMRA could solve the previous “simultaneous excitation” problem we observed for the mCherry-TAMRA FRET-pair. Because of the lower excitation maximum of sfGFP compared to TAMRA, sfGFP was chosen as donor and TAMRA as acceptor. sfGFP was excited at 465 nm to minimize the unnecessary leak excitation of sfGFP.

Figure 10 : The graph shows the extinction and emission spectra of TAMRA and mCherry. Due to the large overlap of sfGFP emission and TAMRA extinction it is possible to perform a FRET with this pair of fluorophores. The graph show the relative fluorescence unit (RFU[%]) in relation to the extincted/emitted wavelength [nm]. The peaks are normalized to 100 %.

Figure 11 : Design of a FRET-pair of 5-TAMRA-LPETG (TAMRA) and GGGG-sfGFP (sfGFP). In this configuration sfGFP acts as donor and TAMRA as acceptor. When the two fluorophores are not linked only sfGFP is being excited. After sortase-mediated ligation of the two substrates, TAMRA is the fluorophore being excited via FRET and the emission of TAMRA intensifies. Meanwhile, the emission of sfGFP decreases.
The transfer of energy from sfGFP to TAMRA can be seen by the decrease in emission of sfGFP and increase in emission from TAMRA. Compared to TAMRA as an acceptor, the sfGFP bleaches significantly less and is consequently more suitable as a donor for FRET. Furthermore, the afore mentioned problem of simultaneous donor and acceptor excitation seems to be solved. It seems that we have found a FRET-pair with superior properties.

Figure 12 : Spectrum of the negative control of TAMRA and sfGFP, without Sortase A7M, over the course of 25 min in 5 min intervals. Depicted are the emission wavelengths against the RFU.

Figure 13 : Spectrum of TAMRA and sfGFP, with Sortase A7M, over the course of 25 min in 5 min intervals. Depicted are the emission wavelengths against the RFU. The sortase-mediated ligation results in a decline of both emission peaks.
Due to the collected data of both FRET-pairs we decided to use the TAMRA-LPETG and GGGG-sfGFP FRET-pair for further characterization of our Sortase A variants. Two reasons justify this decision:
- TAMRA bleaches stronger than sfGFP when excited with a laser.
- The spectral overlap between TAMRA and mCherry disturbs “clean” energy transfer, thus the FRET-effect would be less visible and could not be used for analysis of the sortase-mediated reaction.
For recording of sortase reaction parameters we recommend using the FRET-pair sfGFP-TAMRA. As this pair of fluorophores proved to have near perfectly aligned spectra and since the bleaching effect is visibly lower on sfGFP than on TAMRA, we chose to use this FRET-pair in most of our following assay. Nevertheless, we do not rule out the use of TAMRA-mCherry as a FRET-pair since we used it in several FRET-assays as well.
Figure 14 : Animation of Sortase A7M enzyme kinetics over the course of 3 h. The reaction speed increases radically in the beginning moving from RFU 8000 to RFU 6000 at λ = 550 nm where a plateau is reached (blue). The negative control (orange) is also reduced in its RFU due to bleaching. Nevertheless, a peak at λ = 580 nm arises already after short reaction time. This peak indicates the successful Fluorescence Resonance Energy Transfer.
Why are enzyme-substrate ratio and duration important parameters of the sortase reaction?
In one of our first FRET experiments, we addressed the simple theory: More sortase in the reaction mix improves the initial product formation. For this, we used the TAMRA-LPETG : GGGG-mCherry FRET pair. We measured the FRET change over time in a multiwell platereader (Fig. 15).

Figure 15 : Reaction kinetics of Sortase A7M in different concentrations at same level of substrate concentration.
However, in this assay we observed a striking feature of the sortase reaction. In the reaction with more Sortase A7M present, the FRET change started to decrease after a certain maximum was reached! We suspected some kind of dead-end product formation, as the sortase does also catalyze the reverse reaction of product to educts. Therefore, the overall reaction duration is a very important parameter. We gathered more details about the role of the reverse reaction during our comparison of Sortase A7M and Sortase A5M. Just keep reading if you want to know more!
Who wins - Sortase A7M or Sortase A5M
In our introduction we described that Sortase A7M and Sortase A5M are both fascinating enzymes, although each of them has a unique „selling point“. Sortase A5M is faster, whereas Sortase A7M is Ca2+-independent. We confirmed both of these points in extensive FRET-assays. According to the literature, Sortase A5M works best with a Ca2+-concentration of 2 mM. In contrast, Sortase A7M is a calcium-independent mutant of the enzyme. Moreover, Ca2+ even seems to inhibit this enzyme variant slightly .
Firstly, we confirmed that in contrast to Sortase A5M, Sortase A7M is Ca2+-independent. The results are shown in Fig. 16 Sortase A7M also works in presence of Ca2+, but these FRET experiments made us suspect that Ca2+ may even inhibit Sortase A7M.

Figure 16 : Sortase A7M FRET-assay of connecting TAMRA-LPETG with GGGG-sfGFP with and without Ca2+. The Sortase A7M reaction was measured with 6 mM Ca2+ every minute. Sortase A7M reaction without Ca2+ was measured every three minutes. It is shown that this enzyme variant works with calcium and without calcium as well, although it seems like Sortase A7M is slightly inhibited due to the presence of calcium which explains why the left graph is lower than the right one.
Secondly, we confirmed that Sortase A5M is inactive if Ca2+ is absent, which can be seen in Fig. 17 As expected, Sortase A5M shows increasing enzymatic activity with increasing Ca2+ levels. The reaction runs fastest with 2 mM Ca2+, and the maximal FRET change (in terms of ΔRFU) is reached after 37.5 min. Strikingly, the FRET change decreases afterwards. We observed this phenomenon before and assume this to be due to dead-end product formation caused by the reverse reaction.


Figure 17 : Both figures show Sortase A5M FRET assay connecting TAMRA-LPETG and GGGG-sfGFP with different Ca2+-concentrations. The right graph is showing that Sortase A5M does not work without calcium. The negative ΔRFU measurements are probably caused by measuring errors by the Tecan platereader.
According to the results of this assay, Sortase A7M is definitely Ca2+-independent, since it shows linking activity without calcium in the vicinity. The enzyme mutant also works in presence of Ca2+ (Fig. 17), but these FRET experiments made us suspect that Ca2+ may even inhibit Sortase A7M, since it shows less activity with calcium around than without calcium.

Figure 19 : Comparison of the reaction speed of Sortase A5M with Ca2+ and Sortase A7M without Ca2+.
When we compare the reaction speed of Sortase A5M and Sortase A7M, Sortase A5M is the clear winner (see Fig. : 19). However, this means of course that the reverse reaction is also faster in the case of Sortase A5M. Consequently, Sortase A7M is the best variant for in vivo modification of our VLPs as it is Ca2+-independent. On the other hand, Sortase A5M is a suitable enzyme variant for in vitro modification due to its high efficiency.
Sequence and Features
- 10COMPATIBLE WITH RFC[10]
- 12COMPATIBLE WITH RFC[12]
- 21INCOMPATIBLE WITH RFC[21]Illegal XhoI site found at 597
- 23COMPATIBLE WITH RFC[23]
- 25COMPATIBLE WITH RFC[25]
- 1000COMPATIBLE WITH RFC[1000]