
Difference between revisions of "File:RhodmanieB-fluorescence.png"
ParselTMatts (Talk | contribs) (Figure 3. Rhodamine B standard curves showing mean fluorescence of four replicates of different concentrations of Rhodamine B (0 µM to 6.25 µM – the higher values were excluded due to oversaturation):a) excitation: 532 nm, emission: 605 nm; b) exci...) |
(No difference)
|
Latest revision as of 18:10, 19 October 2019
Figure 3. Rhodamine B standard curves showing mean fluorescence of four replicates of different concentrations of Rhodamine B (0 µM to 6.25 µM – the higher values were excluded due to oversaturation):a) excitation: 532 nm, emission: 605 nm; b) excitation: 532 nm, emission: 590 nm;c) excitation: 570 nm, emission: 590 nm
File history
Click on a date/time to view the file as it appeared at that time.
| Date/Time | Thumbnail | Dimensions | User | Comment | |
|---|---|---|---|---|---|
| current | 18:10, 19 October 2019 | 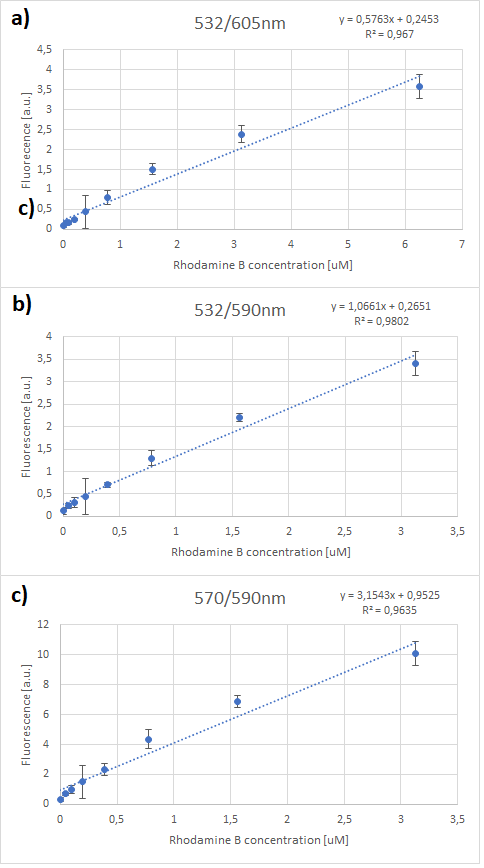 | 484 × 868 (32 KB) | ParselTMatts (Talk | contribs) | Figure 3. Rhodamine B standard curves showing mean fluorescence of four replicates of different concentrations of Rhodamine B (0 µM to 6.25 µM – the higher values were excluded due to oversaturation):a) excitation: 532 nm, emission: 605 nm; b) exci... |
- You cannot overwrite this file.
File usage
The following 2 pages link to this file: