
Difference between revisions of "Part:BBa K398108"
| Line 20: | Line 20: | ||
<b>BBa_K398108 salt tolerance cluster does not confer to an increased tolerance to potassium chloride.</b> | <b>BBa_K398108 salt tolerance cluster does not confer to an increased tolerance to potassium chloride.</b> | ||
| − | <p>We inoculated overnight cultures of | + | <p>We inoculated overnight cultures of <i>E. coli DH5alpha wild type and salt tolerant DH5alpha in LB medium containing 0M to 0.8M KCl. The data was gained in triplicates and measured in OD600 with Implen’s Nanospectrometer every 45 minutes (in accordance with the previous characterization for NaCl). For the analysis OD600 values were transformed to logarithmic values and subsequently nonlinearly fitted to a growth curve using GraphPad Prism8.0.</p> |
| − | <p><img src="https://2019.igem.org/wiki/images/e/e2/T--Tuebingen--BBa_K398108.png" alt="Results" style="float:right; width:600px">The graph shows the growth rate [h-1] and [%]-growth of salt tolerant | + | <p><img src="https://2019.igem.org/wiki/images/e/e2/T--Tuebingen--BBa_K398108.png" alt="Results" style="float:right; width:600px">The graph shows the growth rate [h-1] and [%]-growth of salt tolerant <i>E. coli DH5alpha and wild type (wt) DH5alpha. The growth rate was calculated by using the proposed doubling time of the fit. [%]-growth was calculated by the normalisation of the growth rate of the salt tolerant DH5alpha against the wild type DH5alpha. The results came from triplicates for each concentration of potassium chloride.</p> |
<p>The graph shows that wild type DH5alpha has approx. 20% higher growth rates in all compared concentrations, except 0.8M KCl, where the reduction of DH5alpha wild type is stronger.</p> | <p>The graph shows that wild type DH5alpha has approx. 20% higher growth rates in all compared concentrations, except 0.8M KCl, where the reduction of DH5alpha wild type is stronger.</p> | ||
Revision as of 16:01, 19 October 2019
Salt tolerance cluster
BBa_K398108 enables E.coli to tolerate higher Sodium Chloride concentrations, the growth rate increase compared to a negative control was 35% for a 0.5M Sodium Chloride concentration.
Introduction
Salts are essential for life, but not all life requires the same amount or the same type of salts. But because of these varying conditions the salt stress differs from environment to environment. It is difficult for a species to adapt to different salt stress levels. To compensate for the cells innate vulnerability to higher salt concentrations we chose a protein from Chlamydomonas sp. W80 that increases the salt tolerance of E.coli. This protein is called bbc1.The exact mechanism of the increased salt tolerance is as of yet unknown. But since bbc1 shows a high homology to RBS binding proteins, it is theorized that it may prevent/stabilize the folding structure of the ribosome under high salt stress conditions.
Characterization

The salt tolerance induces by this BioBrick was tested by using NaCl in LB and M9 (containing 40 mM casaminoacids) media from 0 to 1M salt concentrations, it was compared to another of the TU Delft 2010 BioBricks which had the same antibiotic resistance, and same expression level (but of another protein which did not cause increased salt tolerance). abc The [http://2010.igem.org/Team:TU_Delft#page=Project/tolerance characterization of BBa_K398108] has been described on the TU Delft iGEM Team 2010 wiki.
Results
Up to 0.2 M NaCl effects of salt stress are equally observed for both the negative control and for cells with our biobrick (BBa_K398108). At higher concentrations a significant improvement of growth rate in comparison to the control background (BBa_K398027) is seen. In conclusion While at low salt concentrations no phenotype is observed, the resistance to high salt concentrations is significantly improved (up to 35%). The observed behavior can be explained by the vast amount of effects resulting from salt stress. It is possible that our BioBrick assists to reduce one of the inhibiting effects ,leading to a benefit at higher salt stress.
Further Characterization [iGEM Tuebingen 2019]
BBa_K398108 salt tolerance cluster does not confer to an increased tolerance to potassium chloride.
We inoculated overnight cultures of E. coli DH5alpha wild type and salt tolerant DH5alpha in LB medium containing 0M to 0.8M KCl. The data was gained in triplicates and measured in OD600 with Implen’s Nanospectrometer every 45 minutes (in accordance with the previous characterization for NaCl). For the analysis OD600 values were transformed to logarithmic values and subsequently nonlinearly fitted to a growth curve using GraphPad Prism8.0.
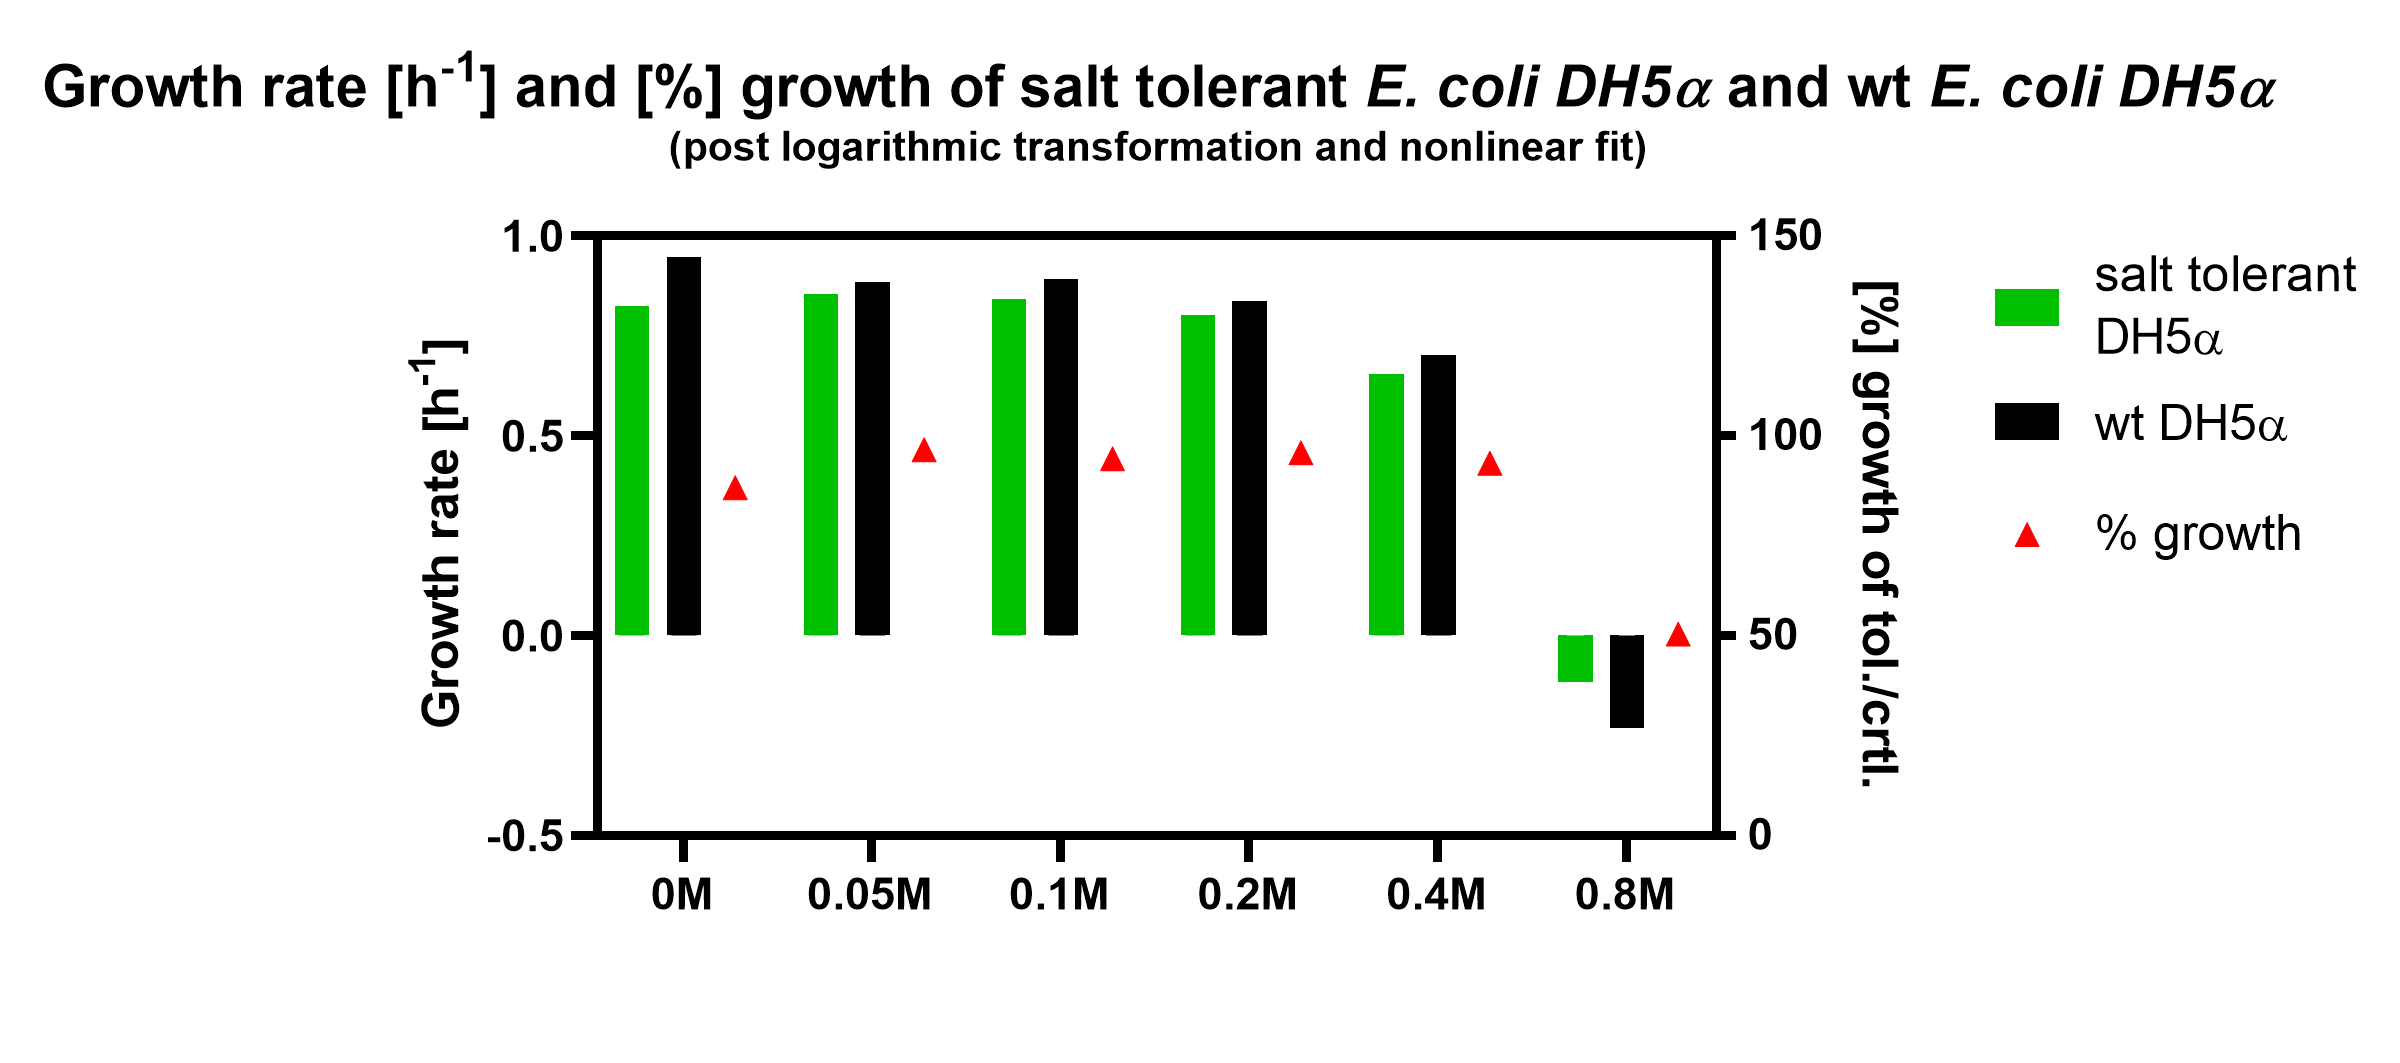 The graph shows the growth rate [h-1] and [%]-growth of salt tolerant E. coli DH5alpha and wild type (wt) DH5alpha. The growth rate was calculated by using the proposed doubling time of the fit. [%]-growth was calculated by the normalisation of the growth rate of the salt tolerant DH5alpha against the wild type DH5alpha. The results came from triplicates for each concentration of potassium chloride.
The graph shows that wild type DH5alpha has approx. 20% higher growth rates in all compared concentrations, except 0.8M KCl, where the reduction of DH5alpha wild type is stronger.
Additionally, we expressed growth rates in [%]-growth by a normalisation of the growth rates of DH5alpha with salt tolerance against the wild type growth rates. When looking at [%]-growth, one may observe a slight increase in [%]-growth of the salt tolerant DH5alpha upon addition of KCl. This may indicate that the salt tolerant bacteria are less inhibited in their growth, however these findings were not significant. To summarize, this suggests that the salt tolerance cluster does not confer to significant KCl tolerance in DH5alpha cells.
References
- S. Tanaka,K. Ikeda, H. Miyasaka, Enhanced Tolerance Against Salt-Stress and Freezing-Stress of Escherichia coli Cells Expressing Algal bbc1 Gene. Current Microbiology, 42:173-177 (2001)
- Y. Suda,T. Yoshikawa,Y. Okuda,M. Tsunemoto,S. Tanaka,K. Ikeda,H. Miyasaka,M. Watanabe,K. Sasaki,K. Harada,T. Bamba,K. Hirata, Isolation and characterization of a novel antistress gene from Chlamydomonas sp. W80. Journal of Bioscience and Bioengineering, 107(4) 352-354 (2009)
- Y. Hase, S. Yokoyama, A. Muto, et al. , Removal of a ribosome small subunit-dependent GTPase confers salt resistance on Escherichia coli cells. RNA Society, 15:1766-1774 (2009)
Sequence and Features
- 10COMPATIBLE WITH RFC[10]
- 12COMPATIBLE WITH RFC[12]
- 21COMPATIBLE WITH RFC[21]
- 23COMPATIBLE WITH RFC[23]
- 25COMPATIBLE WITH RFC[25]
- 1000INCOMPATIBLE WITH RFC[1000]Illegal SapI.rc site found at 312