Difference between revisions of "Part:BBa K2170002"
Christoph 90 (Talk | contribs) (→High resolution confocal fluorescence microscopy) |
|||
| Line 23: | Line 23: | ||
=High resolution confocal fluorescence microscopy= | =High resolution confocal fluorescence microscopy= | ||
[[File:MUC16 confocal 001.png|thumb|830px|right]] | [[File:MUC16 confocal 001.png|thumb|830px|right]] | ||
| − | In order to obtain high resolution confocal fluorescence images from our receptor constructs we transfected the Neuro-2a (N2a) mouse neuroblastoma cells line with the respective plasmids. Shortly before the end of the project Christoph came up with the idea to include a trafficking signal to the C-terminus of the receptor proteins that is described to increase the surface presentation of receptors by sorting them intracellularly towards the cell membrane. The sequence of this | + | In order to obtain high resolution confocal fluorescence images from our receptor constructs we transfected the Neuro-2a (N2a) mouse neuroblastoma cells line with the respective plasmids. Shortly before the end of the project Christoph came up with the idea to include a trafficking signal to the C-terminus of the receptor proteins that is described to increase the surface presentation of receptors by sorting them intracellularly towards the cell membrane. The sequence of this signal for localization improvement is: KSRITSEGEYIPLDQIDINV GG FCYENEV* (Trafficking signale, 2 aa Linker, ER export signale, Stopp codon. This corresponds to the DNA sequence: aagagcaggatcaccagcgagggcgagtacatccccctggaccagatcgacatcaacgtg GGCGGCttctgctacgagaacgaggtgtaa)<ref>Gradinaru, Viviana, et al. "Molecular and cellular approaches for diversifying and extending optogenetics." Cell 141.1 (2010): 154-165.</ref> and we have inserted it into the assembled BioBrick device using PCR cloning. After the transfection of the receptor plasmids cells were stained with the following reagents: Hoechst dye for the nuclear staining at 405 nm; Alexa488-bioting to stain biotin binding proteins; mRuby3 which is a part of the receptor and is expected to show a membrane localization and Dy634-antiA3C5-F<sub>ab</sub>. The staining was followed by three washing steps with PBS. Following this staining procedure the cells were mounted on a confocal fluorescence microscope (Leica). The results for each fluorescence channel are given in the following figure (see Fig. 2). |
<br><br><br><br> | <br><br><br><br> | ||
| Line 30: | Line 30: | ||
<br><br><br><br> | <br><br><br><br> | ||
<br><br><br><br> | <br><br><br><br> | ||
| − | |||
=Quantification of functionalized membrane proteins using flow cytometry= | =Quantification of functionalized membrane proteins using flow cytometry= | ||
Latest revision as of 09:18, 22 October 2016
Secretory eukaryotic biotin binding receptor with single chain avidin
This BioBrick contains an eucaryotic receptor construct with single chain avidin, which, after expression in an eucaryotic cell, imparts the binding of biotin on the cell surface. This constucts makes it possible to link cells over a biotinylated protein linker and by this makes the printing of tissue without scaffold even possible. It's expression is regulated by a CMV promotor and its secretion guided by a BM40 signal peptide. For better characterization a mRuby3 was added to the intracellular part of the fusion protein. Also an A3C5-Tag (intracellular), an antibody binding site, as well as a Strep TagII, a binding sequence for streptavidin, was added to have different possibilities for later characterization of the transfected construct. The intr- and extracellular parts are connected by an EGFR TMD with stop transfer signal, which makes sure that the TMD stays inside the membrane.
CMV_BM40_scAvidin_A3C5_EGFR TMD_mRuby_StrepTag_polyA
Subcellular protein localization using fluorescence microscopy
For better traceabilty we supplied all of our receptor constructs with reporter genes like mRuby and/or Nanoluciferase.
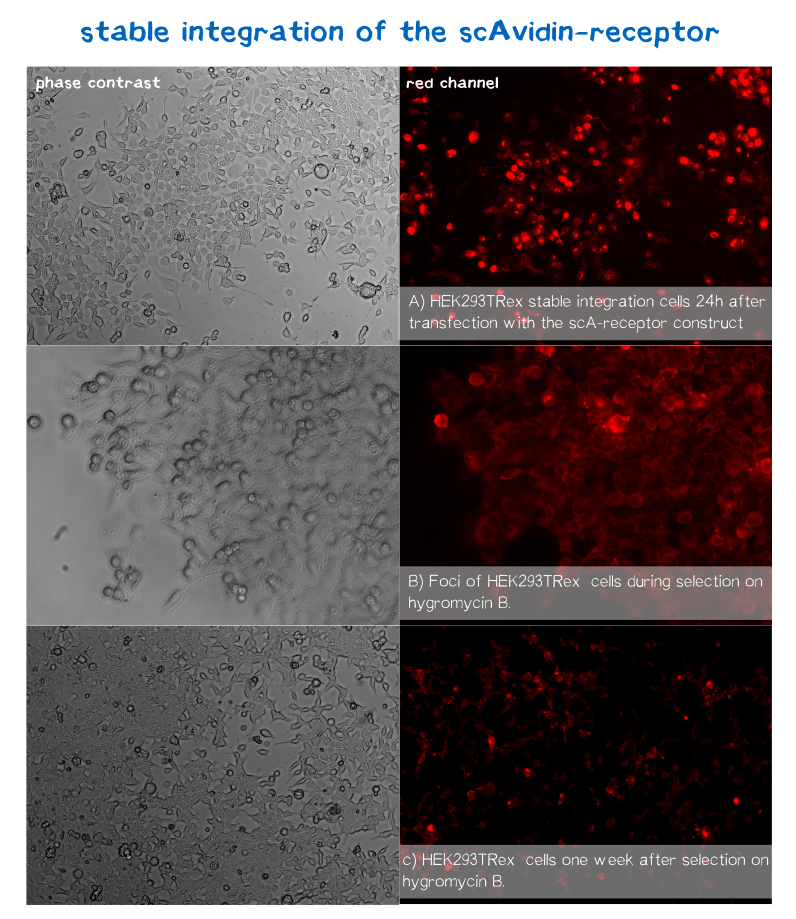
mRuby is located on the C-terminus respectively the cytosolic end of our transmembrane receptors right before the Strep-tag. Cells that express and fold the protein properly should give a signal of 605 nm (red) when exited at around 558 nm (rfp channel).[1] We tested our contructs three diffrent cell types: HEK293T adherent cells that were stably transfected, HEK293E suspension cells that were semi-stably transfected and N2a cells, a mouse neuroblastoma cell line, that we transiently transfected.
As you can see on the images the signal developed over time. In the beginning, before selection, the protein was visible in little dots and therefor seemed to be localized more in subcellular oragnelles than in the membrane.
During selection on hygromycin B resistency most of the cells died, leaving some resistant cells behind, which over time grew to bigger foci consisting of stably transfected cells only (See Fig. B). For the BAP-receptor there was hardly to no fluorescence detectable neither in semi-stable nor in the stable transfection approach. But in latter case the cells still grew on hygromycin B and formed foci, which leads us to the conclusion that chromosomal intergration was susccesful (as already shown via PCR) hence there must be some problem in later steps of transcription, translation or protein maturation.
After 2 weeks of selection on hygromycin B the foci were harvested and expanded. The cells seemed to recover fast and moreover the red dots nearly disappeared leaving only the membrane of the scA-receptor cells illuminated by mRuby.
High resolution confocal fluorescence microscopy
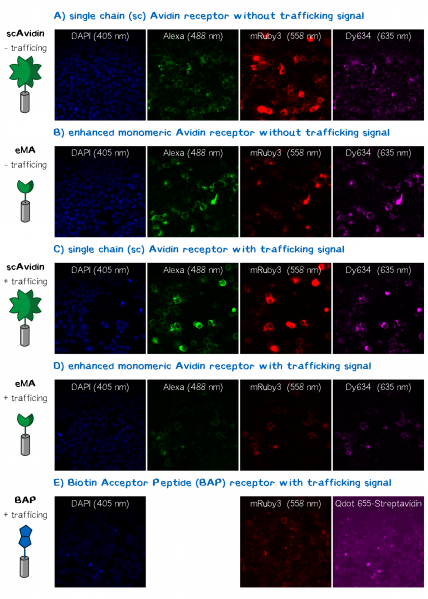
In order to obtain high resolution confocal fluorescence images from our receptor constructs we transfected the Neuro-2a (N2a) mouse neuroblastoma cells line with the respective plasmids. Shortly before the end of the project Christoph came up with the idea to include a trafficking signal to the C-terminus of the receptor proteins that is described to increase the surface presentation of receptors by sorting them intracellularly towards the cell membrane. The sequence of this signal for localization improvement is: KSRITSEGEYIPLDQIDINV GG FCYENEV* (Trafficking signale, 2 aa Linker, ER export signale, Stopp codon. This corresponds to the DNA sequence: aagagcaggatcaccagcgagggcgagtacatccccctggaccagatcgacatcaacgtg GGCGGCttctgctacgagaacgaggtgtaa)[2] and we have inserted it into the assembled BioBrick device using PCR cloning. After the transfection of the receptor plasmids cells were stained with the following reagents: Hoechst dye for the nuclear staining at 405 nm; Alexa488-bioting to stain biotin binding proteins; mRuby3 which is a part of the receptor and is expected to show a membrane localization and Dy634-antiA3C5-Fab. The staining was followed by three washing steps with PBS. Following this staining procedure the cells were mounted on a confocal fluorescence microscope (Leica). The results for each fluorescence channel are given in the following figure (see Fig. 2).
Quantification of functionalized membrane proteins using flow cytometry
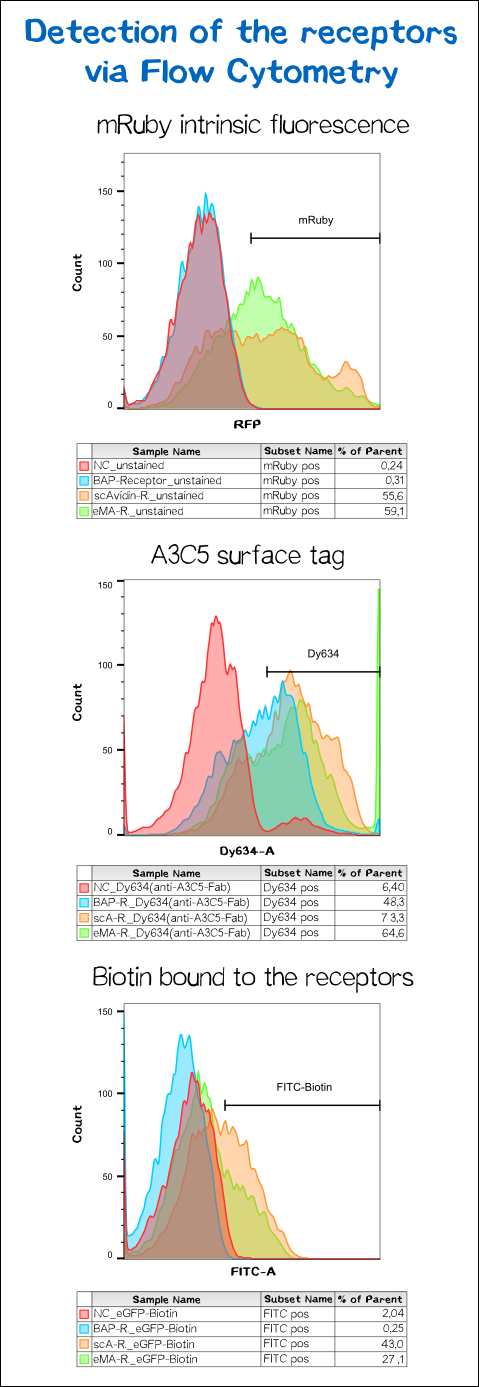
To make sure the receptor is properly presented on the surface of the cells and to quantify the yield of stably transfected cells we used flow cytometry analysis.
The results presented in Fig. 11 show a positive signal in the rfp channel for the scAvidin and the eMA receptor bearing cells. As already observed in microscopy mRuby-fluorescence could not be detected for the BAP-receptor cells. But surprisingly about 40% where positive for Dy634, meaning that the A3C5 tag, against which the fluorophor labeled Fab is dierectet, must be present on the cell surface. This results suggest that there might be a problem about the folding of the mRuby beta-barrel leading to a loss of fluorescent activity.
For scA and eMA cells Dy634 signal has been positive albeit not as high as expected.
Another stain was the eGFP coupled with biotin giving a positive signal for scA and eMA to which the biotin binds. For BAP cells there was no signal since this receptor, is biotinylated by the BirA and doesn't cooperatively bind the Biotin. Moreover the biotin snd the dye are coupled via the C-terminal tail of the biotin leaving no contact point for the BirA to ligate the eGFP-biotin to the receptor's acceptor peptide.
Immunochemical detecton of functionalized membrane protein using Western Blot
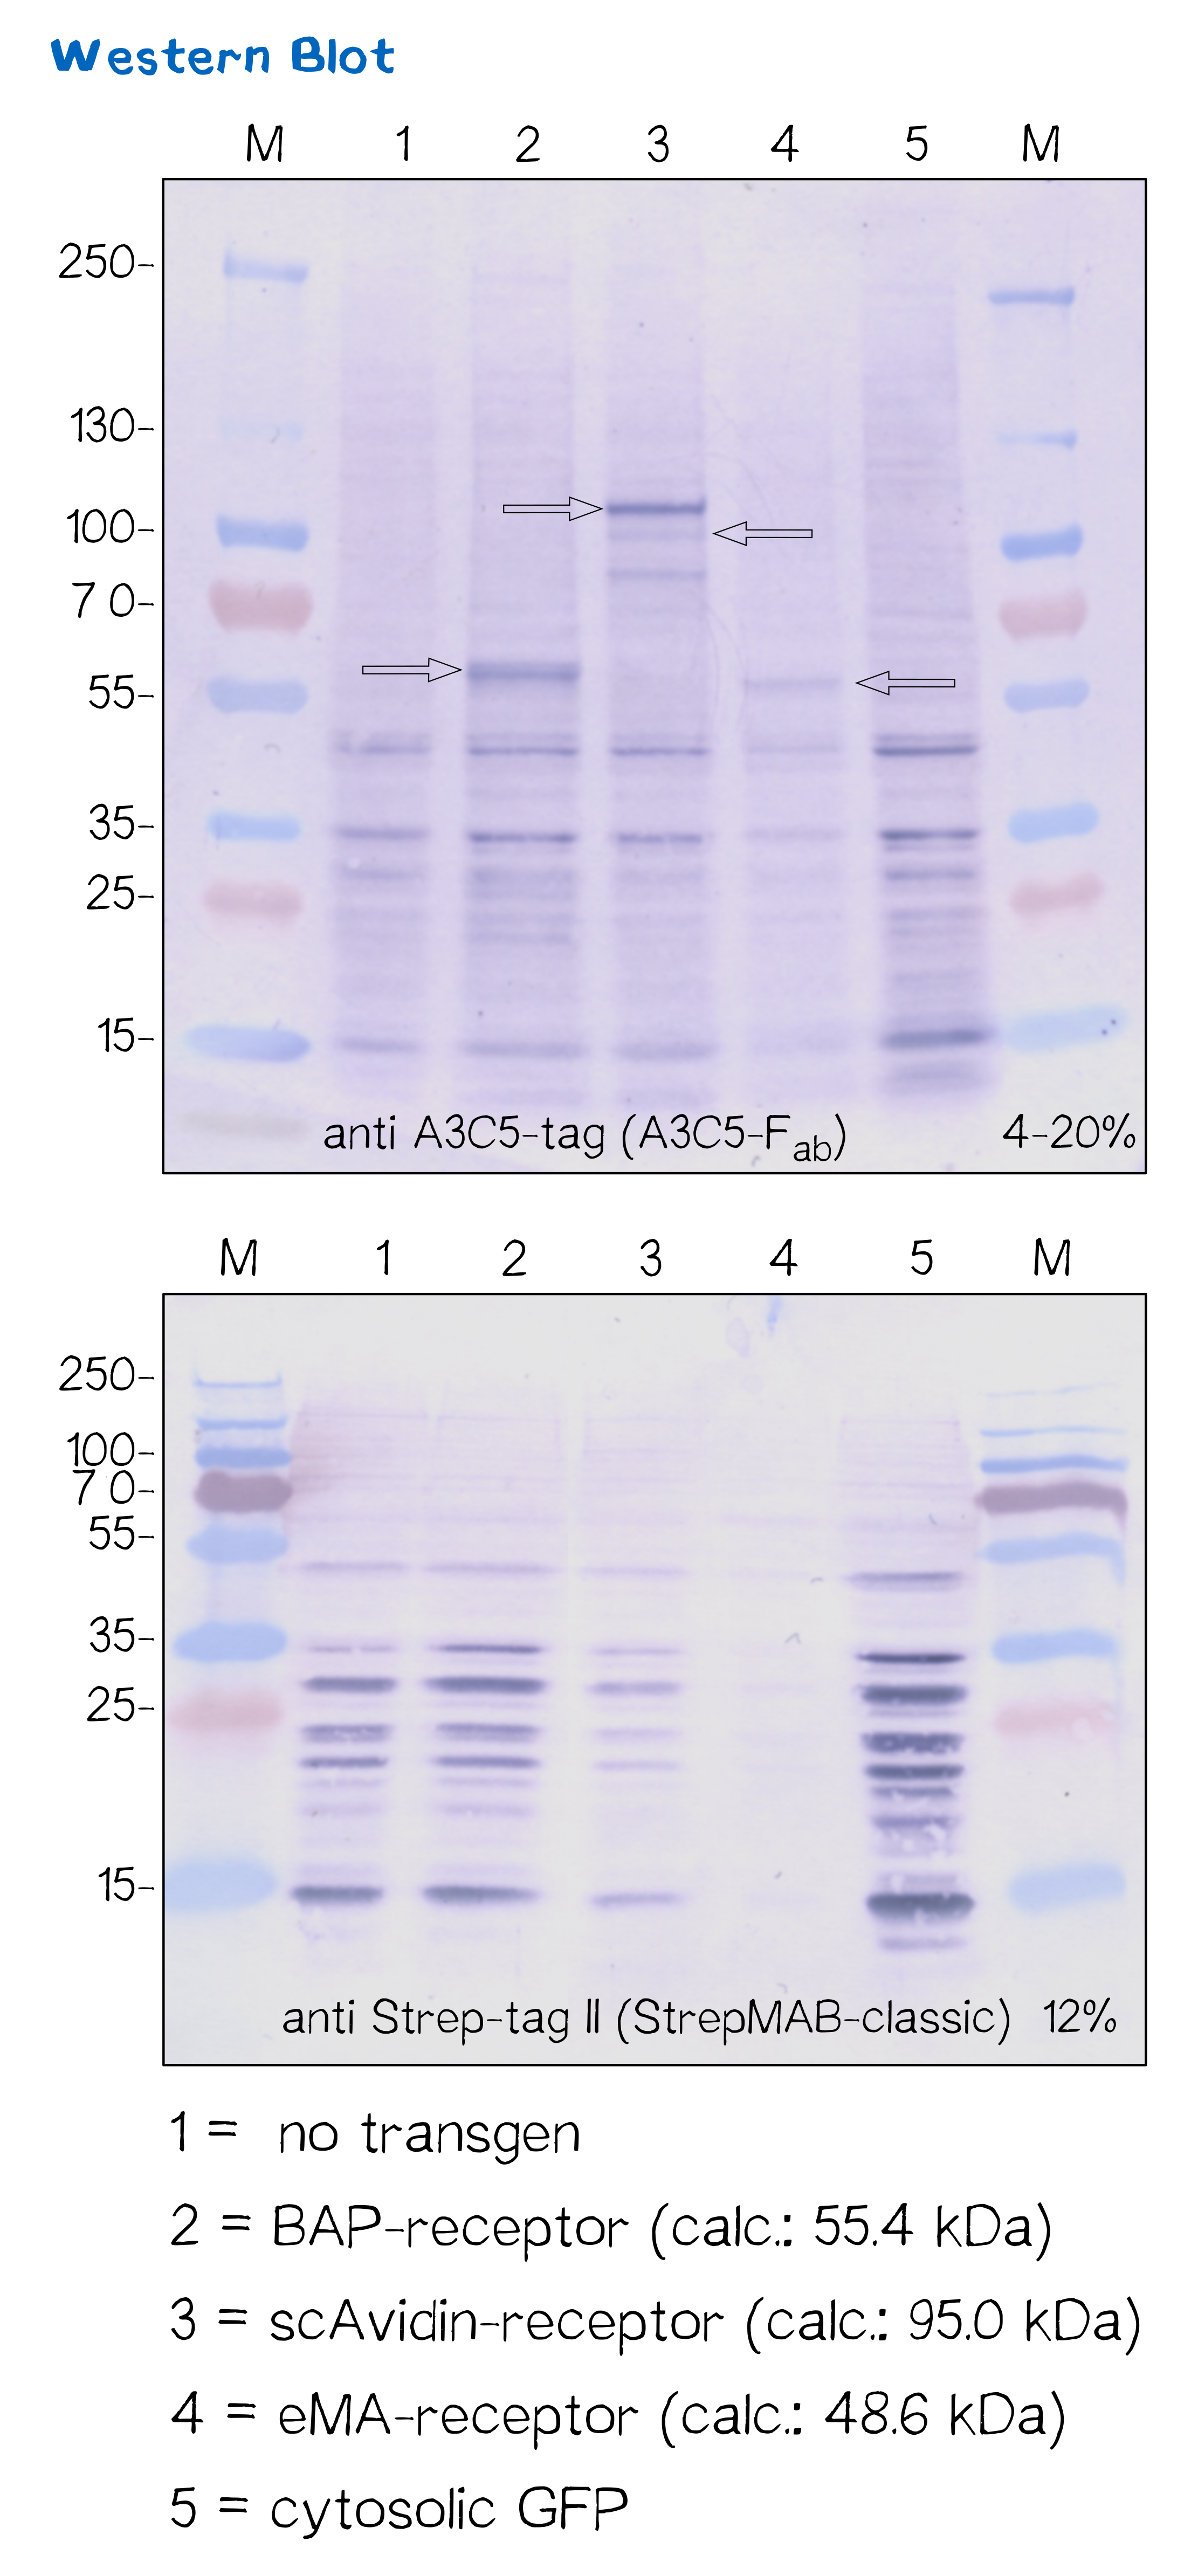
Another way to verify the succesful transfection and protein expression is given by the two tags (A3C5 and Strep-tag II) that are included in the receptor design, which allow detection via Western Blot analysis.
After transfecting mammalian cells with the receptor constructs and selecting them for 2 weeks on hygromycin, we lysed the cells and checked for the presence of Strep- and A3C5-tag via western blot using primary antibodies (or a Fab for A3C5) against the respective tags und secondary alkaline phosphatase coupled antibodies (see methods). As the figure shows, the Strep-tag wasn't detectable via WB - however, the A3C5-tag-WB shows significant singular bands at the size of our proteins in the respective samples.
This data corresponds with the flow cytometry results again showing that the BAP receptor is also present in the non-fluorescent cells.
| Receptor | BioBrick | Amino acids | Moelcular mass [Da] |
| BAP-Receptor | BBa_K2170000 | 507 | 55 440 |
| eMA-Receptor | BBa_K2170001 | 448 | 48 618 |
| scAvidin-Receptor | BBa_K2170002 | 877 | 95 028 |
Quantification of mRNA expression levels by RT-q-PCR
The characterization of our transfected mammalian cells showed that the two receptors containing an avidin variant were expressed and translocated to the outer cell membrane. The biotin-presenting receptor containing the biotin-acceptor peptide, though, showed a very low fluorescence signal. Therefore, the success of the stable integration was tested by PCR of the genomic integration, which lead to the conclusion that the construct was transfected and integrated sucessfully, hinting at a problem downstream of the integration. In order to understand where the source of this problem was, we took a closer look at the expression levels of the different receptors by analyzing mRNA levels in comparison to each other and to the housekeeping gene (HKG) GAPDH.
For a better comparibility, we used the same amount of cells for each receptor and not only reviewed cells with stably integrated but also cells with the episomal stable receptor constucts. After extraction of the total mRNA from the cells the quality and integrity was measured by Bioanalyzer. All samples showed a RNA integrity number (RIN) above 9 which means that the total mRNA is pure and does not have any contamination. During the first step of RT-qPCR the total mRNA in converted to cDNA by a reverse transcriptase, which is then used in the actual quantitative PCR to quantify the amount of a specific mRNA was produced by the cells. For this reason two primer pairs were designed. One of them was designed to bind the exact same region in all of the different receptor mRNAs and amplify the same part of the receptor. Contrary to that the second pair was supposed to bind only in the biotin presenting receptor and amplify a part that is unique to this receptor. By this method we wanted to observe if only one part of the mRNA is unstable or if the general mRNA level of this receptor is decreased.
For the evaluation of the raw data we used the [http://2016.igem.org/Team:LMU-TUM_Munich/Methods#.CE.94.CE.94CP_method ΔΔCP method][3] in which the crossing points (CP values) of a gene of interest and of a reference gene are compared and normalized with a constantly expressed HKG, to get an idea of the relative amounts of the mRNA of interest.
In the following you can see the results of our experiments. We compared the expression levels of T-REx cells which were transfected with our different receptor constructs and with non-transfected (NT) T-REx cells.
As can be seen the ΔΔCP values of the mRNA of the eMA and scAvidin constructs are with a 1,2 x 10⁶ fold increase for scAvidin and 1.5 x 10³ fold increase for eMA, significantly higher than those of the BAP construct. The analysis of the different primer pairs in the two regions of the BAP construct also showed similar values and thus confirms the reliability of the measurement. A difference in CP value is tantamount to relative mRNA differences between cells.
Together with the result that the integration of the constuct into the genome was successful we can conclude that our first assumption, that the missing RFP signal in cells, which were transfected with the BAP construct, is caused by a reduced mRNA stability, is correct.
High resolution imaging using scanning electron microscopy (SEM)
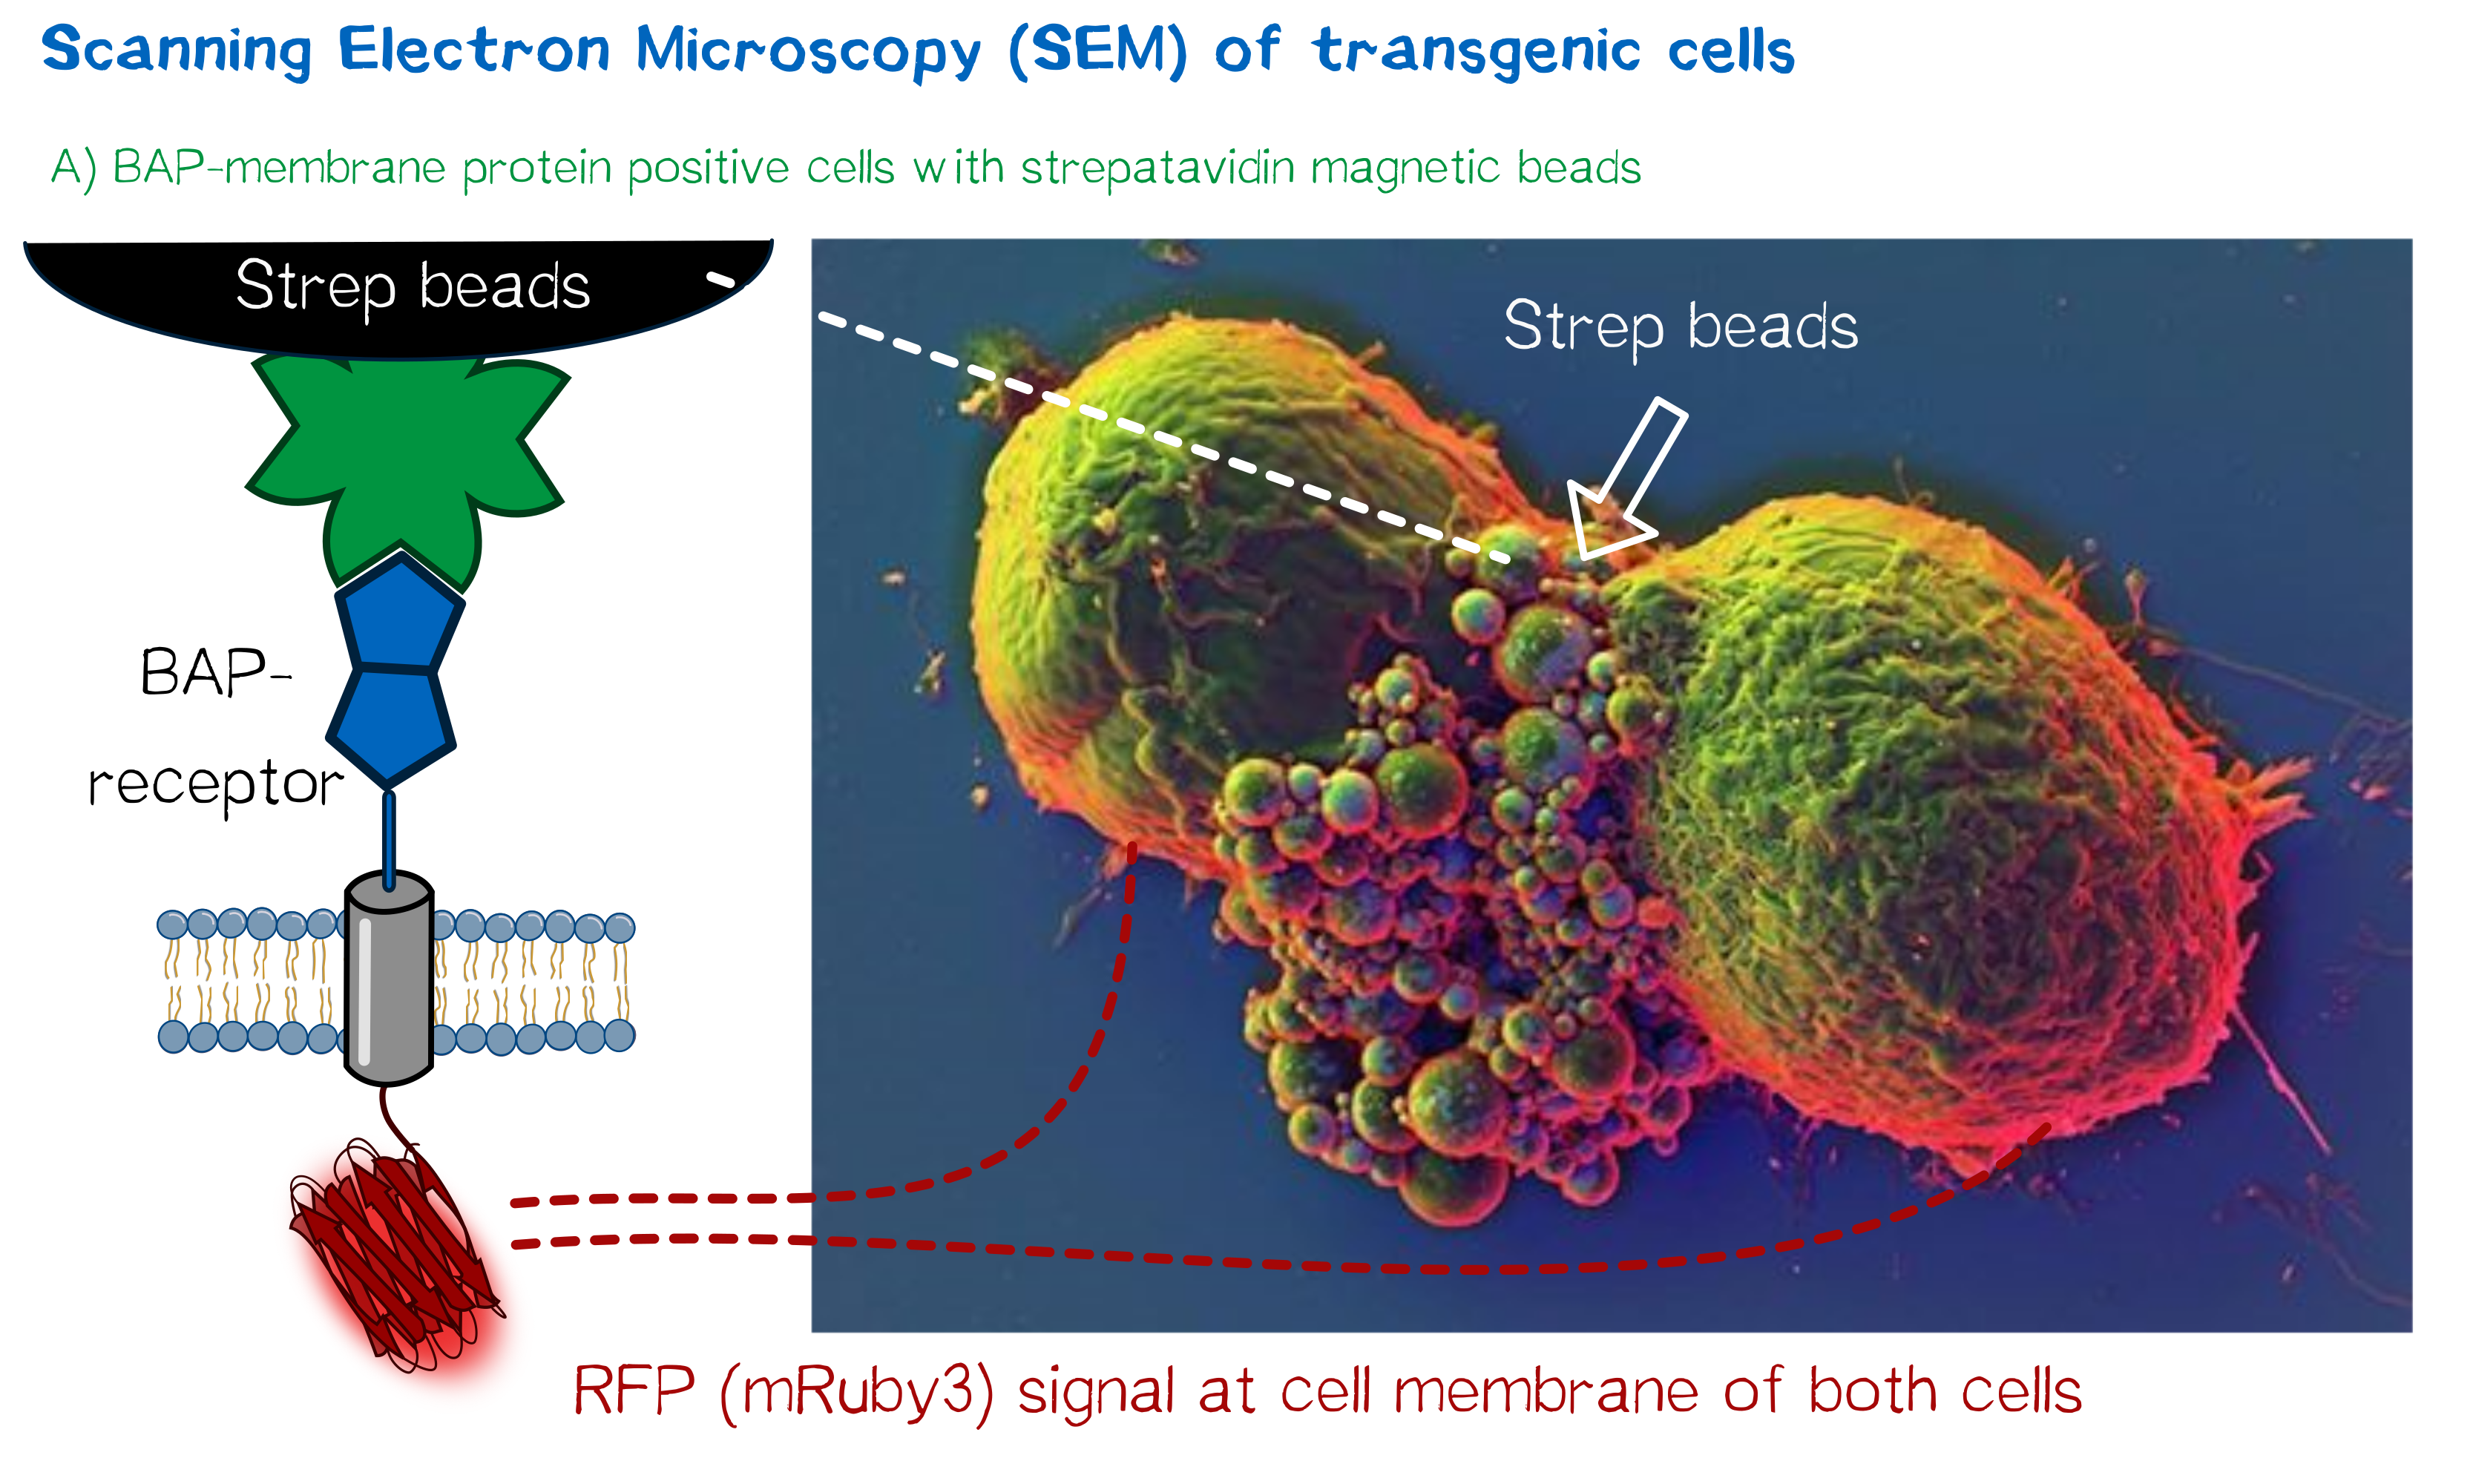
As we wanted to obtain high resolution images from the transgenic cells transfected with our modular membrane proteins we contacted one of the experts on electron microscopy in Munich and luckily Prof. em. Dr. Wanner (LMU Munich) agreed to support our project by contributing scanning electron microscopic (SEM) imaging. Even better suitable for our purpose Prof. Wanner has developed a method in which he can correlate the fluorescence signal of a sample with the high resolution images obtained in SEM. As this kind of sample preparation, sample processing and imaging takes a while, we had to start 2 weeks before wiki freeze and at that point we did not have enough stably integrated T-REx 2cells, yet. Thus we used transient transfected, semi-stable MEXi HEK 293T cells that were pulled down with magnetic beads in order to increase the number of transgenic cells in the preparation and to show the specific binding of the beads to the cells. For this immunoprecipitation we incubated scAvidin-receptor and eMA-receptor cells with biotinylated magnetic beads and on the other side cells transfected with the BAP-receptor together with streptavidin-coupled magnetic beads. After the immunoprecipitation the cells were washed twice with PBS and it was visible that the portion of transgenic (red fluorescent) cells was largely increased after this procedure. The depicted SEM image shows two BAP-receptor transfected MEXi cells which have a cluster of magnetic streptavidin-conjugated magnetic beads at their cellular interface. At the border of the cells the superimposed fluorescence image of these cells shows red fluorescence located at the periphery of the cells indicating the presence of mRuby3 fluorescent protein at the cellular membrane. The green fluorescence is caused by biotinylated eGFP that was used for other preparations on the same microscopic slide and came into contact with these cells when the suspension cells were sedimented on the microscopic slide by centrifugation. Although for a reliable conclusion one would have to evaluate several such images this figure already gives a valuable evidence that the BAP-receptor is present on the cells (although perhaps at lower levels) and can bind to strepavidin that was conjugated to the beads.
Sequence and Features
- 10COMPATIBLE WITH RFC[10]
- 12COMPATIBLE WITH RFC[12]
- 21INCOMPATIBLE WITH RFC[21]Illegal BglII site found at 576
- 23COMPATIBLE WITH RFC[23]
- 25COMPATIBLE WITH RFC[25]
- 1000INCOMPATIBLE WITH RFC[1000]Illegal BsaI site found at 3719
- ↑ Kredel, S., Oswald, F., Nienhaus, K., Deuschle, K., Röcker, C., Wolff, M., ... & Wiedenmann, J. (2009). mRuby, a bright monomeric red fluorescent protein for labeling of subcellular structures. PloS one, 4(2), e4391.
- ↑ Gradinaru, Viviana, et al. "Molecular and cellular approaches for diversifying and extending optogenetics." Cell 141.1 (2010): 154-165.
- ↑ Livak, Kenneth J., and Thomas D. Schmittgen. "Analysis of relative gene expression data using real-time quantitative PCR and the 2− ΔΔCT method." methods 25.4 (2001): 402-408.

