Difference between revisions of "Part:BBa K1907002"
| Line 18: | Line 18: | ||
<br> | <br> | ||
<p><b>Expression</b></p> | <p><b>Expression</b></p> | ||
| − | To express the enzyme, a 5 mL overnight-grown LB-kanamycin culture of <i>E. coli</i> BL21(DE3) was expanded to 50 mL. After the bacteria reached the mid-log phase (OD600 between 0.6-0.8), protein production was induced with 1 mM IPTG. During induction, bacteria were grown at +22 °C for 20 hours. Figure 1 presents results from analyzing different cellular fractions over the course of expression and lysis. After cell lysis, the enzyme is observed to localize in both the soluble and insoluble fractions | + | To express the enzyme, a 5 mL overnight-grown LB-kanamycin culture of <i>E. coli</i> BL21(DE3) was expanded to 50 mL. After the bacteria reached the mid-log phase (OD600 between 0.6-0.8), protein production was induced with 1 mM IPTG. During induction, bacteria were grown at +22 °C for 20 hours. Figure 1 presents results from analyzing different cellular fractions over the course of expression and lysis. After cell lysis, the enzyme is observed to localize in both the soluble and insoluble fractions. |
| − | [[File:Ecoli_first_wb.png| | + | [[File:Ecoli_first_wb.png|300px|thumb|center|Figure 1. Results of MlrA localization]] |
<br> | <br> | ||
| − | Expression of the protein was also done in Magic Media | + | Expression of the protein was also done in Magic Media auto-induction medium, in a total volume of 0.5 L in a 2 L flask covered with an air-permeable membrane. This expression was conducted in +30 °C. |
<br> | <br> | ||
| Line 31: | Line 31: | ||
We used FPLC to purify the enzyme we had grown on the Magic Media auto-induction medium (0.5 L culture volume). Half of the supernatant obtained after cell lysis was used for purification. Figure 2 presents the chromatogram from the FPLC and selected fractions were analysed by SDS-PAGE and western blotting (Figure 3). | We used FPLC to purify the enzyme we had grown on the Magic Media auto-induction medium (0.5 L culture volume). Half of the supernatant obtained after cell lysis was used for purification. Figure 2 presents the chromatogram from the FPLC and selected fractions were analysed by SDS-PAGE and western blotting (Figure 3). | ||
| − | [[File:Fplc_graph.png|Figure 2 | + | [[File:Fplc_graph.png||500px|thumb|center|Figure 2. The chromatogram from FPLC. A 30 mL of sample was purified using two stacked HisTrap FF Crude 5 ml columns. Left: The blue line corresponds to UV (280nm) reading, and the green line to the concentration elution buffer. Right: A small hill was observed within the eluted fractions, with the peak in fraction A.3-C.3.]] |
<br> | <br> | ||
| − | [[File:Fplc_sds-wb.png|Figure 3 | + | [[File:Fplc_sds-wb.png|500px|thumb|center|Figure 3. Western blot (left) and SDS-PAGE (right) of FPLC purification fractions. D2 - B4 fractions from FPLC - check Figure 2, MW - molecular weight standard. There are proteins in the elution fractions that have been detected by the anti-His antibody, and there seems to be a right sized protein also (about 28 kDa), most of it being in the C3 fraction.]] |
<br> | <br> | ||
| Line 51: | Line 51: | ||
The results we acquired from this construct show that the amount of microcystin-LR decreases, which means that the enzyme is active (Figure 4). We used 970 ul of FPLC purified elution fraction in the MlrA-MC reaction, but as we don’t have exact information on the quantity of the enzyme, we were not able to quantify the activity activity any further. | The results we acquired from this construct show that the amount of microcystin-LR decreases, which means that the enzyme is active (Figure 4). We used 970 ul of FPLC purified elution fraction in the MlrA-MC reaction, but as we don’t have exact information on the quantity of the enzyme, we were not able to quantify the activity activity any further. | ||
| − | [[File:Mc-lr_activity_ecoli.png|300px|thumb|center|Degradation of MC-LR by FPLC purified MlrAE. The measurement points have been connected to visualize the degradation of the enzyme; they are not trend lines and further conclusions based on them should not be made.]] | + | [[File:Mc-lr_activity_ecoli.png|300px|thumb|center|Figure 4. Degradation of MC-LR by FPLC purified MlrAE. The measurement points have been connected to visualize the degradation of the enzyme; they are not trend lines and further conclusions based on them should not be made.]] |
| − | + | ||
| − | + | ||
<br> | <br> | ||
| − | In addition to improving the previous MlrA BioBrick, we also managed to prove that our construct degrades microcystin-RR ( | + | In addition to improving the previous MlrA BioBrick, we also managed to prove that our construct degrades microcystin-RR (Figure 5). Based on our results, it seems that MlrA has higher degradation activity against MC-LR than MC-RR. |
| − | + | ||
| − | + | ||
| − | + | ||
| − | + | ||
| + | [[File:Mc-rr_activity_ecoli.png|300px|thumb|center|Figure 5. Degradation of MC-RR by FPLC purified MlrAE. The measurement points have been connected to visualize the degradation of the enzyme; they are not trend lines and further conclusions based on them should not be made.]] | ||
Revision as of 23:20, 19 October 2016
Microcystinase (MlrA) for E. coli
Introduction
This part can be used to introduce microcystinase (MlrA) from Sphingomonas sp. ACM-3962 to Escherichia coli BL21(DE3). MlrA is an enzyme degrades some cyanobacterial toxins, most notably microcystin-LR (MC-LR). To facilitate expression detection and purification of the enzyme, a 6X Histidine tag is fused on the C-terminus of MlrA, with a short linker in between. The full protein-coding sequence has been codon-optimized for expression in E. coli by GeneArt.</p><p>Background
See BioBrick entry for MlrA in yeast (BBa_K1907001)
Sequence and Features
- 10COMPATIBLE WITH RFC[10]
- 12COMPATIBLE WITH RFC[12]
- 21INCOMPATIBLE WITH RFC[21]Illegal BamHI site found at 105
- 23COMPATIBLE WITH RFC[23]
- 25INCOMPATIBLE WITH RFC[25]Illegal AgeI site found at 244
Illegal AgeI site found at 373 - 1000COMPATIBLE WITH RFC[1000]
Expression
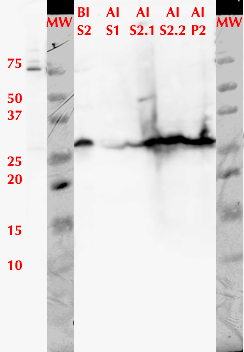
To express the enzyme, a 5 mL overnight-grown LB-kanamycin culture of E. coli BL21(DE3) was expanded to 50 mL. After the bacteria reached the mid-log phase (OD600 between 0.6-0.8), protein production was induced with 1 mM IPTG. During induction, bacteria were grown at +22 °C for 20 hours. Figure 1 presents results from analyzing different cellular fractions over the course of expression and lysis. After cell lysis, the enzyme is observed to localize in both the soluble and insoluble fractions.
Expression of the protein was also done in Magic Media auto-induction medium, in a total volume of 0.5 L in a 2 L flask covered with an air-permeable membrane. This expression was conducted in +30 °C.
FPLC purification
We used FPLC to purify the enzyme we had grown on the Magic Media auto-induction medium (0.5 L culture volume). Half of the supernatant obtained after cell lysis was used for purification. Figure 2 presents the chromatogram from the FPLC and selected fractions were analysed by SDS-PAGE and western blotting (Figure 3).
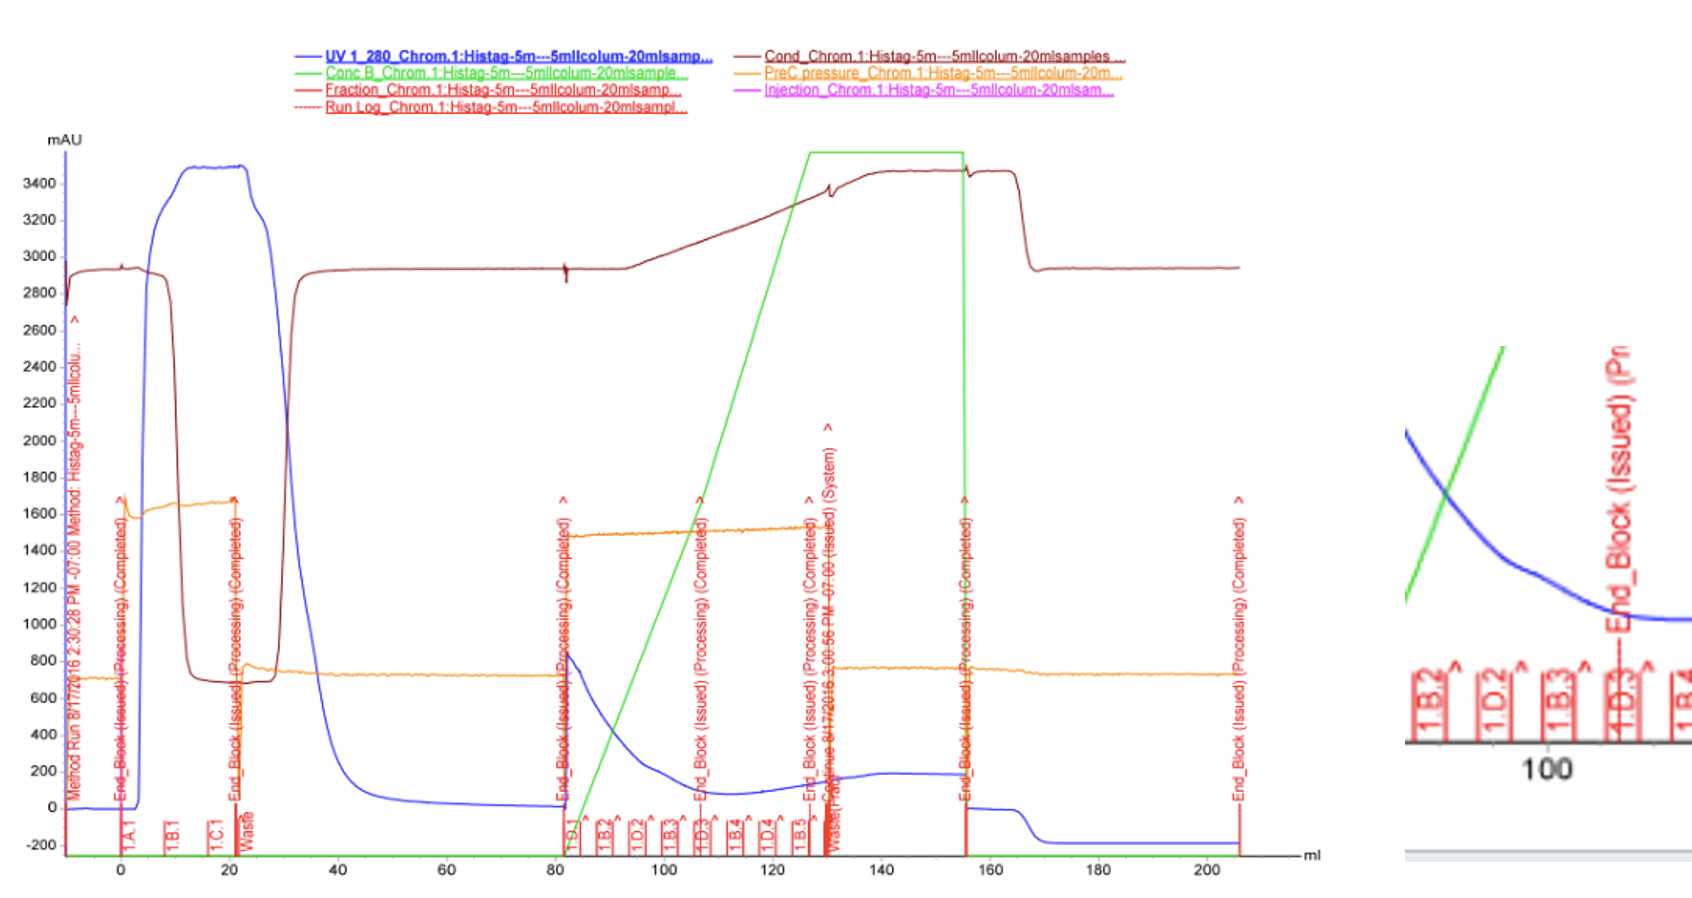
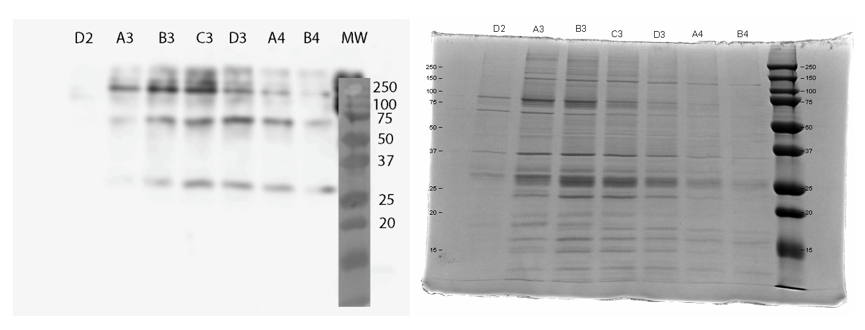
Based on these results, it seems that affinity chromatography purification of MlrA is possible, although optimization of the purification conditions would be necessary to obtain better purity and higher yields of purified protein. We didn’t have time to try these improvements ourselves, but possibilities include a very slow initial elution buffer gradient to wash out unspecific binding. In addition, optimizing the pH of the sample could improve binding; a higher pH might allow for better binding to the nickel in the column, as the number of histidines with a complementary charge would increase. Diluting the sample in phosphate buffer and desalting the sample could improve its binding to the column. Additionally, binding could be facilitated by extending the 6X His tag to a 10X His tag.
Activity measurements
The activity of MlrA was measured by incubating the enzyme with microcystin extract. The final concentration of microcystin was estimated to be 1 μg/L. Samples were taken at different time points and they were analysed with liquid chromatography/mass spectrometry (LC-MS). This gives data of the relative abundance of microcystin-LR and -RR in each sample. The results were then plotted against time, together with a negative control which consisted of microcystin extract and PBS.
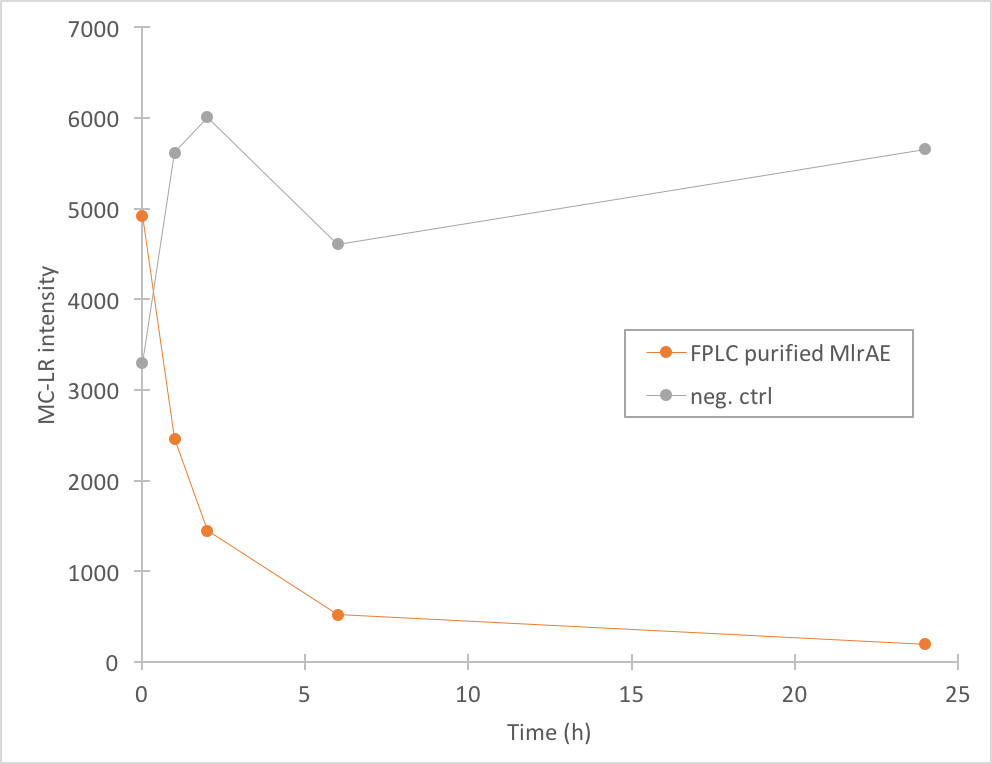
The results we acquired from this construct show that the amount of microcystin-LR decreases, which means that the enzyme is active (Figure 4). We used 970 ul of FPLC purified elution fraction in the MlrA-MC reaction, but as we don’t have exact information on the quantity of the enzyme, we were not able to quantify the activity activity any further.
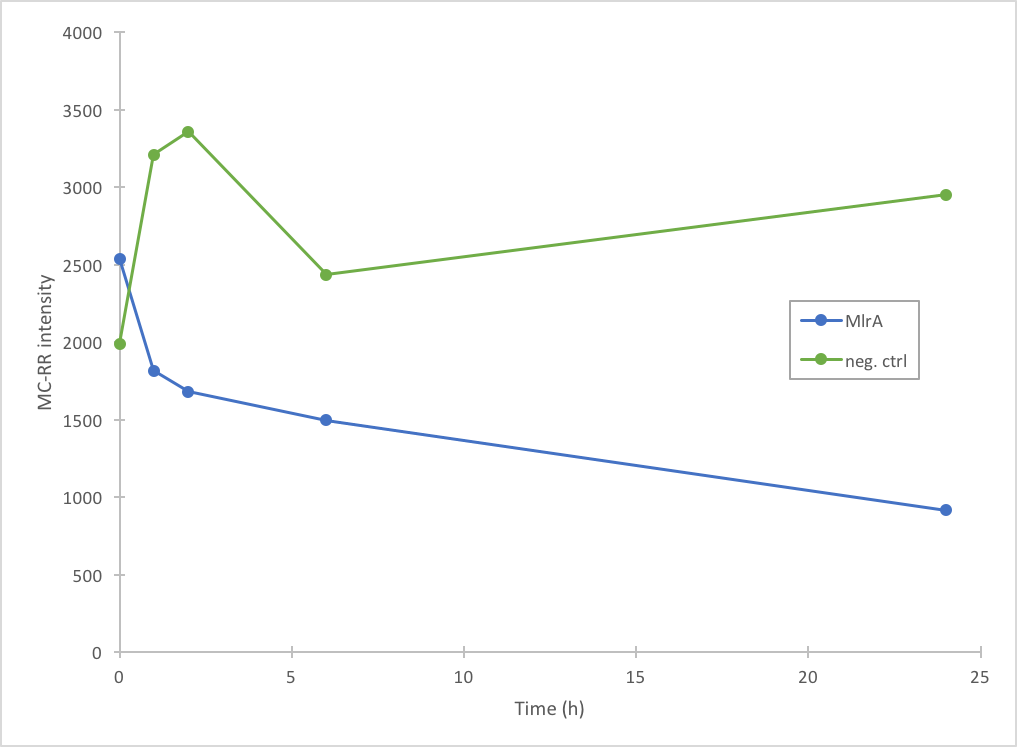
In addition to improving the previous MlrA BioBrick, we also managed to prove that our construct degrades microcystin-RR (Figure 5). Based on our results, it seems that MlrA has higher degradation activity against MC-LR than MC-RR.

