Difference between revisions of "Part:BBa K1033906"
Saishreyas g (Talk | contribs) |
Saishreyas g (Talk | contribs) |
||
| Line 33: | Line 33: | ||
<!-- --> | <!-- --> | ||
| − | <span class='h3bb'>3D Structure</span> | + | <span class='h3bb'><strong>3D Structure</strong></span> |
[[Image:ts2.gif]] | [[Image:ts2.gif]] | ||
| Line 41: | Line 41: | ||
<!-- --> | <!-- --> | ||
| − | <span class='h3bb'>Cartoon representation of tsPurple.</span> | + | <span class='h3bb'><strong>Cartoon representation of tsPurple.</strong></span> |
[[Image:ts purple swiss.png]] | [[Image:ts purple swiss.png]] | ||
| Line 57: | Line 57: | ||
<!-- --> | <!-- --> | ||
| − | <span class='h3bb'>The best match during structure prediction.</span> | + | <span class='h3bb'><strong>The best match during structure prediction.</strong></span> |
<table border="1"> | <table border="1"> | ||
<tr> | <tr> | ||
| Line 88: | Line 88: | ||
<!-- --> | <!-- --> | ||
| − | <span class='h3bb'>What about Ligands?</span> | + | <span class='h3bb'><strong>What about Ligands?</strong></span> |
<table border="1"> | <table border="1"> | ||
<tr> | <tr> | ||
| Line 115: | Line 115: | ||
| − | <span class='h3bb'>Plot 1</span> | + | <span class='h3bb'><strong>Plot 1</strong></span> |
<!-- --> | <!-- --> | ||
[[Image:tsp2.png]] | [[Image:tsp2.png]] | ||
| Line 121: | Line 121: | ||
| − | <span class='h3bb'>Plot 2</span> | + | <span class='h3bb'><strong>Plot 2</strong></span> |
<!-- --> | <!-- --> | ||
[[Image:tsp.png]] | [[Image:tsp.png]] | ||
| Line 128: | Line 128: | ||
| − | <span class='h3bb'>Plot 3</span> | + | <span class='h3bb'><strong>Plot 3</strong></span> |
<!-- --> | <!-- --> | ||
[[Image:tsp3.png]] | [[Image:tsp3.png]] | ||
| Line 141: | Line 141: | ||
| − | <br> Plot 1 | + | <br><strong>Plot 1</strong> |
<p>The area built by the circles colored in different shades of grey in the plot on the left hand side represent the QMEAN scores of the reference structures from the PDB. The model's QMEAN score is compared to the scores obtain for experimental structures of similar size (model size +/- 10%) and a Z-score is calculated. A Z-score (or standard score) is a score which is normalised to mean 0 and standard deviation 1. Thus the QMEAN Z-score directly indicates how many standard deviations the model's QMEAN score differs from expected values for experimental structures. In analogy, Z-scores are calculated for all four statistical potential terms as well as the agreement terms being part of the QMEAN score.</p> | <p>The area built by the circles colored in different shades of grey in the plot on the left hand side represent the QMEAN scores of the reference structures from the PDB. The model's QMEAN score is compared to the scores obtain for experimental structures of similar size (model size +/- 10%) and a Z-score is calculated. A Z-score (or standard score) is a score which is normalised to mean 0 and standard deviation 1. Thus the QMEAN Z-score directly indicates how many standard deviations the model's QMEAN score differs from expected values for experimental structures. In analogy, Z-scores are calculated for all four statistical potential terms as well as the agreement terms being part of the QMEAN score.</p> | ||
| − | <br>Plot 2 | + | <br><strong>Plot 2</strong> |
<p>The plot in the middle shows the density plot (based on the QMEAN score) of all reference models used in the Z-score calculation. The location of the query model with respect to the background distribution is marked in red. This plot basically is a "projection" of the first plot for the given protein size. The number of reference models used in the calculation is shown at the bottom of the plot.</p> | <p>The plot in the middle shows the density plot (based on the QMEAN score) of all reference models used in the Z-score calculation. The location of the query model with respect to the background distribution is marked in red. This plot basically is a "projection" of the first plot for the given protein size. The number of reference models used in the calculation is shown at the bottom of the plot.</p> | ||
| − | <br>Plot 3 | + | <br><strong>Plot 3</strong> |
<p>The analysis of these Z-scores of the individual terms can help identifying the geometrical features responsible for an observed large negative QMEAN Z-score. Models of low quality are expected to have strongly negative Z-scores for QMEAN but also for most of the contributing terms. Large negative values correspond to red regions in the color gradient. "Good structures" are expected to have all sliders in the light red to blue region.”</p> | <p>The analysis of these Z-scores of the individual terms can help identifying the geometrical features responsible for an observed large negative QMEAN Z-score. Models of low quality are expected to have strongly negative Z-scores for QMEAN but also for most of the contributing terms. Large negative values correspond to red regions in the color gradient. "Good structures" are expected to have all sliders in the light red to blue region.”</p> | ||
| Line 158: | Line 158: | ||
| + | [[Image:Ramaplot_tspurple.pdf]] | ||
| − | + | ||
| + | ===ProtParam Results=== | ||
| + | (The following information has been contributed by SVCE_Chennai) | ||
| + | |||
| + | <!-- --> | ||
| + | <br>Number of amino acids: 228 | ||
| + | <br>Molecular weight: 25546.26 | ||
| + | <br>Theoretical pI: 6.65 | ||
| + | <br>Total number of negatively charged residues (Asp + Glu): 27 | ||
| + | <br>Total number of positively charged residues (Arg + Lys): 26 | ||
| + | |||
| + | |||
| + | <!-- --> | ||
| + | <strong>Atomic composition:</strong> | ||
| + | |||
| + | <br>Carbon (C) - 1134 | ||
| + | <br>Hydrogen (H) - 1747 | ||
| + | <br>Nitrogen (N) - 303 | ||
| + | <br>Oxygen (O) - 334 | ||
| + | <br>Sulfur (S) - 18 | ||
| + | |||
| + | |||
| + | <!-- --> | ||
| + | <br>Formula: C<sub>1134</sub>H<sub>1747</sub>N<sub>303</sub>O<sub>334</sub>S<sub>18</sub> | ||
| + | <br>Total number of atoms: 3536 | ||
| + | |||
| + | |||
| + | <!-- --> | ||
| + | <br><strong>Extinction coefficients:</strong> | ||
| + | |||
| + | <br>Extinction coefficients are in units of M<sup>-1</sup> cm<sup>-1</sup>, at 280 nm measured in water. | ||
| + | |||
| + | <br>Ext. coefficient : 24910 | ||
| + | <br>Abs 0.1% (=1 g/l): 0.975, assuming all pairs of Cys residues form cystines | ||
| + | |||
| + | <br>Ext. coefficient : 24410 | ||
| + | <br>Abs 0.1% (=1 g/l): 0.956, assuming all Cys residues are reduced | ||
| + | |||
| + | |||
| + | <!-- --> | ||
| + | <strong>Estimated half-life:</strong> | ||
| + | |||
| + | <br>The N-terminal of the sequence considered is M (Met). | ||
| + | |||
| + | <br>The estimated half-life is: 30 hours (mammalian reticulocytes, in vitro). | ||
| + | <br> >20 hours (yeast, in vivo). | ||
| + | <br> >10 hours (Escherichia coli, in vivo). | ||
| + | |||
| + | |||
| + | |||
| + | <!-- --> | ||
| + | <strong>Instability index:<strong> | ||
| + | |||
| + | <br>The instability index (II) is computed to be 31.19 | ||
| + | <br>This classifies the protein as stable. | ||
| + | |||
| + | |||
| + | |||
| + | <br>Aliphatic index: 61.97 | ||
| + | |||
| + | <br>Grand average of hydropathicity (GRAVY): -0.395 | ||
Revision as of 09:54, 3 October 2016
tsPurple, purple chromoprotein
This chromoprotein (also known as TinselPurple) naturally exhibits strong purple color when expressed.
Usage and Biology
This part is useful as a reporter.
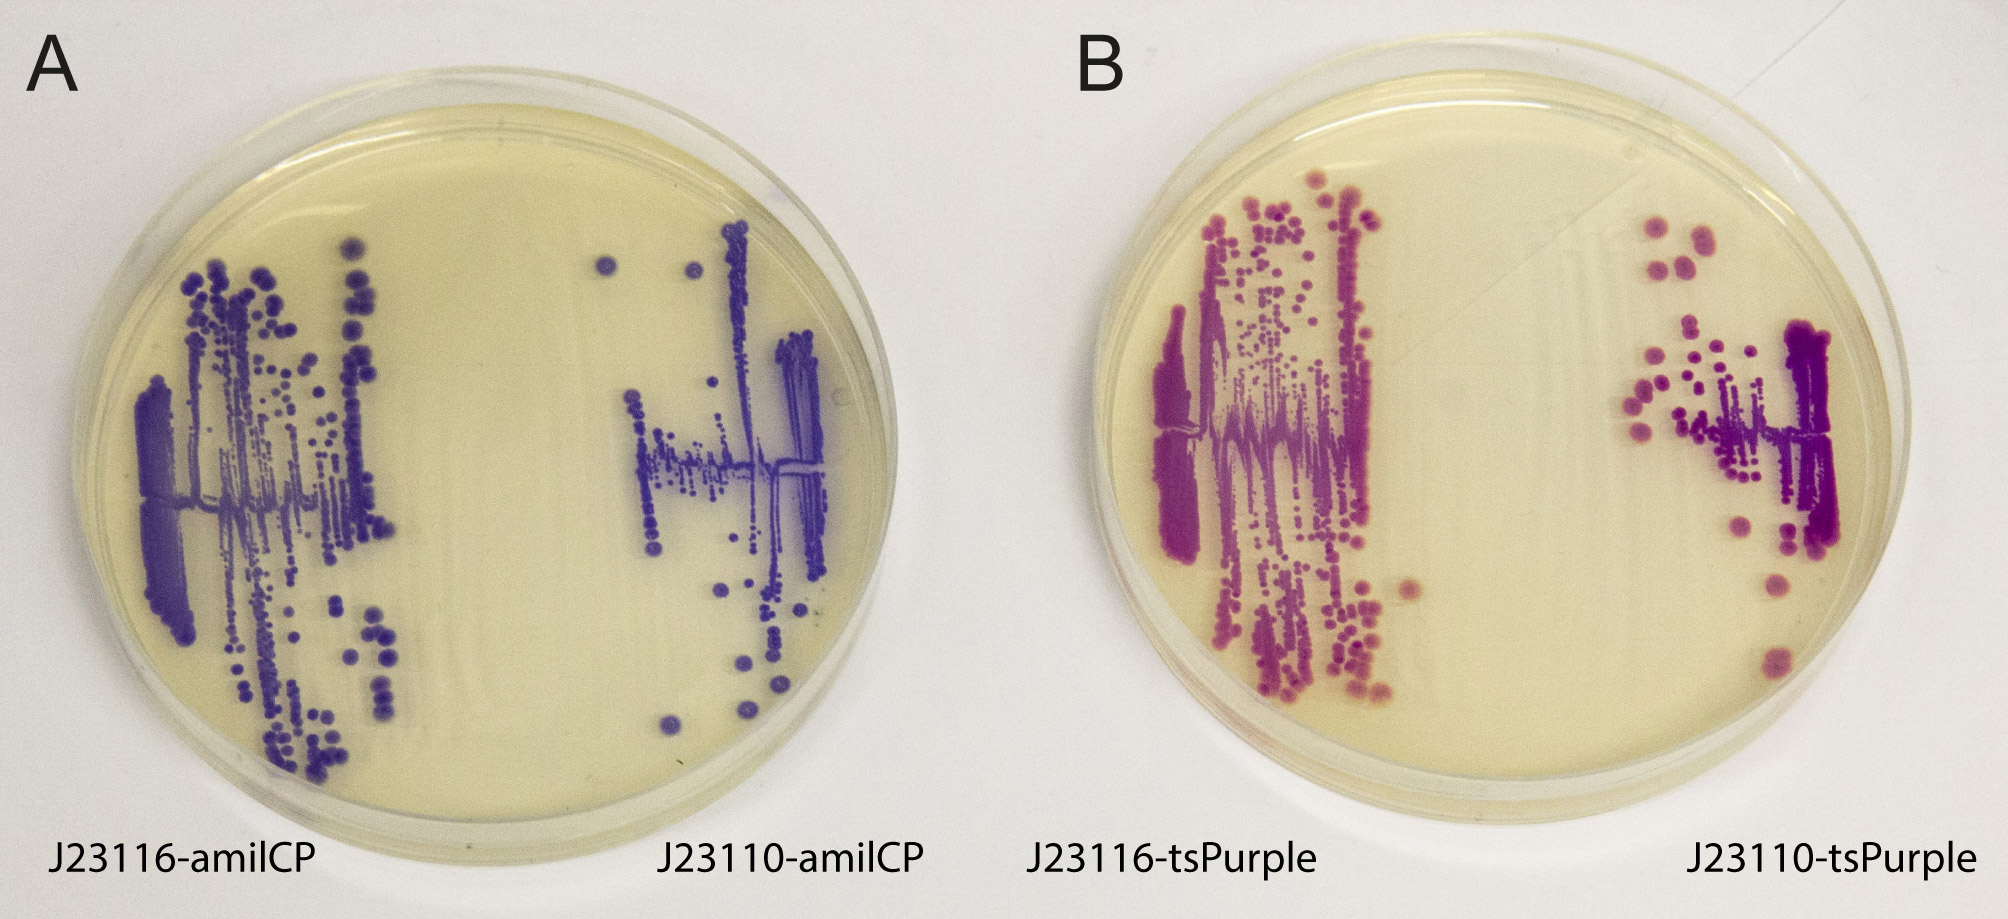
iGEM2013 Uppsala: The images above show E coli constitutively expressing the chromoproteins amilCP BBa_K592009 and tsPurple BBa_K1033906 from the high copy plasmid pSB1C3 from the promoters J23116 and J23110.
Sequence and Features
- 10COMPATIBLE WITH RFC[10]
- 12COMPATIBLE WITH RFC[12]
- 21COMPATIBLE WITH RFC[21]
- 23COMPATIBLE WITH RFC[23]
- 25COMPATIBLE WITH RFC[25]
- 1000COMPATIBLE WITH RFC[1000]
Structure and SWISS MODEL Homology Modelling Report
(The following information has been contributed by SVCE_Chennai)
The following sections give a detailed information on this chromoprotein done by its in silico analysis.
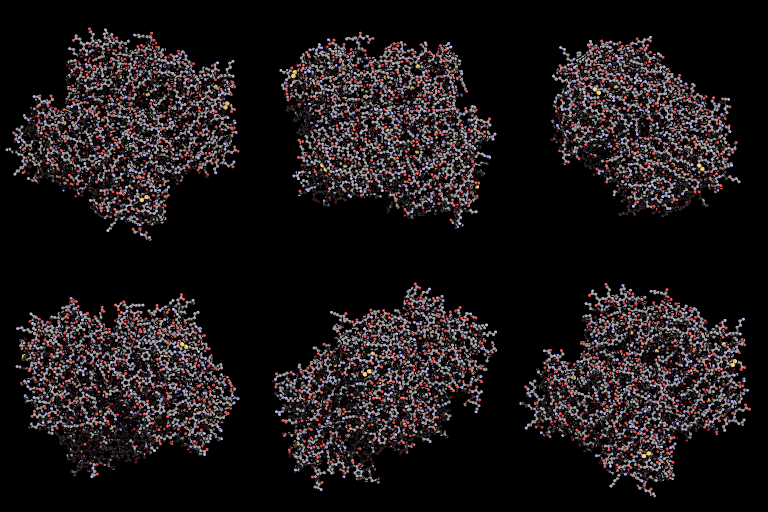
3D Structure
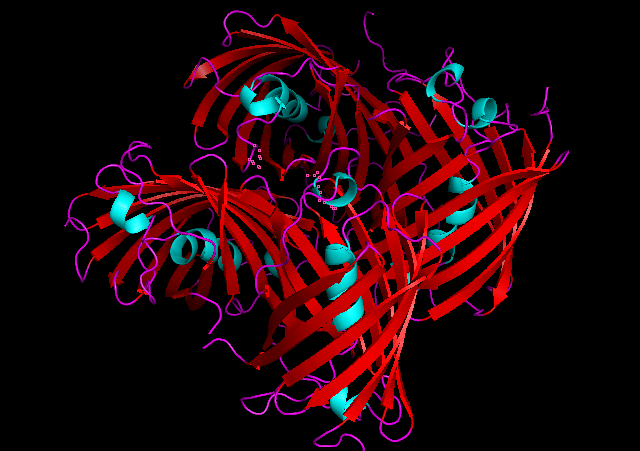
Cartoon representation of tsPurple.
QMEANnorm = 0.02
Cβ = -0.91
All Atom = 0.52
Solvation = -1.19
Torsion = 0.32
The best match during structure prediction.
| Template | Seq. Identity | Oligo-state | Found by | Method | Resolution | Seq Similarity | Range | Coverage | Description |
|---|---|---|---|---|---|---|---|---|---|
| 4ohs.1.A | 86.61 | homotetramer | HHblits | X-Ray | 2.19Å | 0.58 | 2 - 222 | 0.98 | FAR-RED FLUORESCENT PROTEIN AQ143 |
What about Ligands?
| Ligand | Added to Model | Description |
|---|---|---|
| CL | ✕ - Not biologically relevant. | CHLORIDE ION |
| CL | ✕ - Not biologically relevant. | CHLORIDE ION |
| CL | ✕ - Not biologically relevant. | CHLORIDE ION |
Plot 1
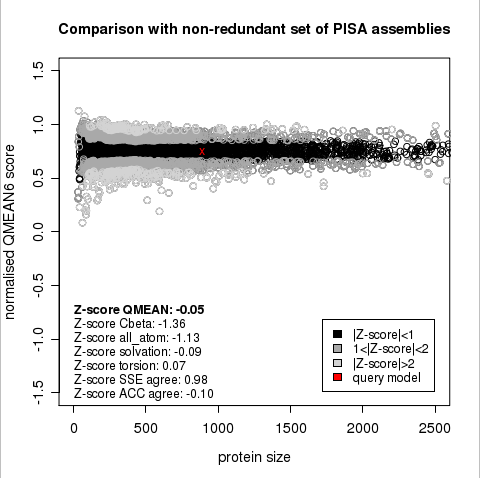
The area built by the circles colored in different shades of grey in the plot on the left hand side represent the QMEAN scores of the reference structures from the PDB. The model's QMEAN score is compared to the scores obtain for experimental structures of similar size (model size +/- 10%) and a Z-score is calculated. A Z-score (or standard score) is a score which is normalised to mean 0 and standard deviation 1. Thus the QMEAN Z-score directly indicates how many standard deviations the model's QMEAN score differs from expected values for experimental structures. In analogy, Z-scores are calculated for all four statistical potential terms as well as the agreement terms being part of the QMEAN score.
Plot 2
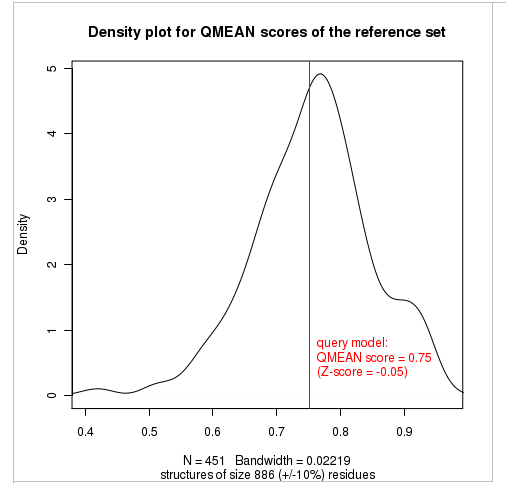
The plot in the middle shows the density plot (based on the QMEAN score) of all reference models used in the Z-score calculation. The location of the query model with respect to the background distribution is marked in red. This plot basically is a "projection" of the first plot for the given protein size. The number of reference models used in the calculation is shown at the bottom of the plot.
Plot 3
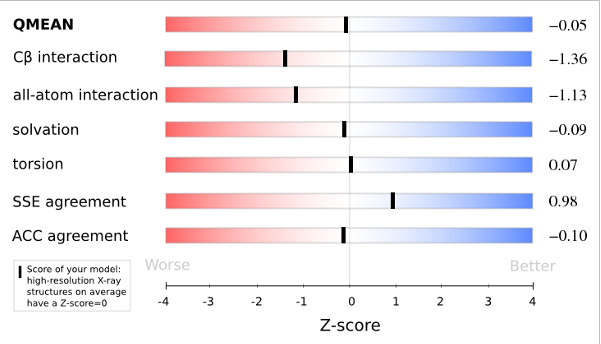
The analysis of these Z-scores of the individual terms can help identifying the geometrical features responsible for an observed large negative QMEAN Z-score. Models of low quality are expected to have strongly negative Z-scores for QMEAN but also for most of the contributing terms. Large negative values correspond to red regions in the color gradient. "Good structures" are expected to have all sliders in the light red to blue region.”
Ramachandran Plot- SWISS MODEL Workspace
(The following information has been contributed by SVCE_Chennai)
ProtParam Results
(The following information has been contributed by SVCE_Chennai)
Number of amino acids: 228
Molecular weight: 25546.26
Theoretical pI: 6.65
Total number of negatively charged residues (Asp + Glu): 27
Total number of positively charged residues (Arg + Lys): 26
Atomic composition:
Carbon (C) - 1134
Hydrogen (H) - 1747
Nitrogen (N) - 303
Oxygen (O) - 334
Sulfur (S) - 18
Formula: C1134H1747N303O334S18
Total number of atoms: 3536
Extinction coefficients:
Extinction coefficients are in units of M-1 cm-1, at 280 nm measured in water.
Ext. coefficient : 24910
Abs 0.1% (=1 g/l): 0.975, assuming all pairs of Cys residues form cystines
Ext. coefficient : 24410
Abs 0.1% (=1 g/l): 0.956, assuming all Cys residues are reduced
Estimated half-life:
The N-terminal of the sequence considered is M (Met).
The estimated half-life is: 30 hours (mammalian reticulocytes, in vitro).
>20 hours (yeast, in vivo).
>10 hours (Escherichia coli, in vivo).
Instability index:
The instability index (II) is computed to be 31.19
This classifies the protein as stable.
Aliphatic index: 61.97
Grand average of hydropathicity (GRAVY): -0.395

