
Difference between revisions of "Part:BBa K1583112"
| (14 intermediate revisions by 2 users not shown) | |||
| Line 2: | Line 2: | ||
<partinfo>BBa_K1583112 short</partinfo> | <partinfo>BBa_K1583112 short</partinfo> | ||
| − | + | <html> | |
| − | + | ||
| − | + | ||
| − | < | + | This part is meant to express the <i>csgA</i> and <i>GFPmut3</i> gene under control of L-rhamnose-inducible promoter. |
| − | + | ||
| − | < | + | <p>CsgA is a protein monomer which can aggregate to form amyloid fibers in natural biofilms of <i>E.coli</i>. This protein is transported as an unfolded protein out of the cell. Outside the cell CsgA proteins self-assemble into nanowires after nucleation on the membrane protein CsgB. CsgC prevents CsgA proteins from self-assembling inside the cell and its transport is ensured by the proteins Csg-E-F-G.</p> |
| − | < | + | |
| − | + | ||
| − | <p> | + | <p>This part was designed to measure intracellular expression rates of CsgA coupled to fluorescence (GFP) by cloning the biobrick <a href="https://parts.igem.org/Part:BBa_I13504"target=_blank">BBa_I13504</a> into the same operon in up-stream of a Rhamnose promoter.</p> |
| − | + | ||
| − | + | </html> | |
| − | + | <span class='h3bb'><h3>Sequence and Features</h3></span> | |
| − | < | + | <partinfo>BBa_K1583112 SequenceAndFeatures</partinfo> |
| − | + | ||
| − | + | ||
| − | + | ||
| Line 28: | Line 19: | ||
<partinfo>BBa_K1583112 parameters</partinfo> | <partinfo>BBa_K1583112 parameters</partinfo> | ||
<!-- --> | <!-- --> | ||
| + | <html> | ||
| + | |||
| + | <p><h3>Characterization</h3></p> | ||
| + | <p>This part was characterized in two different experiments: | ||
| + | <ul><li> Fluorescence assay </li> | ||
| + | <li> Transmission electron microscopy </li></ul></p> | ||
| + | |||
| + | <h4> Fluorescence assay </h4> | ||
| + | <p>To be able to ensure that CsgA is expressed, we used this biobrick to check that the rhamnose inducible promoter works. In this experiment, the fluorescence signal of our CsgA construct and CsgA-GFP construct was recorded in time after induction with no, 0.2% (w/v) or 0.5% (w/v) rhamnose. Besides the fluorescence, the OD600 was measured in order to normalize the fluorescence signal per cell. All conditions were carried out in triplicates to be able to do a statistical analysis on the data. The different experiments were induced in a 96 well plate. The OD600 and fluorescence signal was recorded in a plate reader during a 18 hour period of induction at 30°C. </p> | ||
| + | |||
| + | <p>In figure 1, the fluorescent signal was normalized by the number of cells and plotted as a function of time. The red bars denote the error within each ID. </p> | ||
| + | |||
| + | <figure> | ||
| + | <img src="https://static.igem.org/mediawiki/2015/d/d3/Modelling_pic_9_.png" width="100%" height="100%"> | ||
| + | <figcaption> | ||
| + | <b>Figure 1</b>: Fluorescence signal normalized by the number of cells for 0% (w/v), 0.2% (w/v) and 0.5% (w/v) rhamnose with the csgA and csgA-GFPmut3 construct. The error bars are included for all experiments. | ||
| + | </figcaption> | ||
| + | </figure> | ||
| + | |||
| + | <p>As can be seen from figure 1, only the experiments with 0.2% (w/v) and 0.5% (w/v) rhamnose induction with this biobrick gave a clear increase in fluorescence signal in time. All other experiments, gave similar levels of fluorescence, slightly increasing in time. Furthermore, it can be seen that a higher induction level of rhamnose leads to an increase in GFPmut3 and thus fluorescence. Finally, as the fluorescence signal is normalized by the cell density, one can make statements about the activity of the rhamnose promoter. The promoter seems to not be active right after induction, but more after 3 or 4 hours. This is in accordance with data from literature (Wegerer et. al), in which a low amount of fluorescence with a rhamnose promoter was observed after 2 hours of induction.</p> | ||
| + | |||
| + | <p>With this kinetic experiment, we have proven that the rhamnose promoter does indeed induce the expression of the <i>csgA</i> gene and the I13504 gene.</p> | ||
| + | |||
| + | <h4>Transmission electron microscopy</h4> | ||
| + | |||
| + | <p>Using TEM the formation of curli of the biobrick <a href="https://parts.igem.org/Part:BBa_K1583100">BBa_K1583100</a> was visualized (Figure 2). Although this is a different biobrick (no GFP gene behind the same promoter), curli formation can be presumed to be similar for this biobrick.</p> | ||
| + | |||
| + | <figure> | ||
| + | <img src="https://static.igem.org/mediawiki/parts/d/d3/TEM_7300x_no_induction.png" width="40%" height="100%"> | ||
| + | <img src="https://static.igem.org/mediawiki/parts/a/ac/TEM_7300x%2Binduction.png" width="40%" height="100%"> | ||
| + | <figcaption> | ||
| + | <b>Figure 2</b>: TEM images (magnification 7300 x). The left picture shows uninduced cells (0% Rhamnose).The picture on the right shows cells incubated with 1% (w/v) rhamnose. | ||
| + | </figcaption> | ||
| + | </figure> | ||
| + | |||
| + | <p> | ||
| + | We did not observe formation of curli nanowires in the uninduced cultures of our strain. However, cells from induced cells clearly produced them, as supported by the TEM images. | ||
| + | </p> | ||
| + | |||
| + | <p><h3>References</h3></p> | ||
| + | <p>Wegerer, A., Sun, T., and Altenbuchner, J. (2008). Optimization of an E. coli L-rhamnose-inducible expression vector: test of various genetic module combinations”, BMC Biotechnology, 8:2 </p> | ||
| + | </html> | ||
Latest revision as of 15:30, 13 November 2015
pRha + CsgA & GFP in same operon
This part is meant to express the csgA and GFPmut3 gene under control of L-rhamnose-inducible promoter.
CsgA is a protein monomer which can aggregate to form amyloid fibers in natural biofilms of E.coli. This protein is transported as an unfolded protein out of the cell. Outside the cell CsgA proteins self-assemble into nanowires after nucleation on the membrane protein CsgB. CsgC prevents CsgA proteins from self-assembling inside the cell and its transport is ensured by the proteins Csg-E-F-G.
This part was designed to measure intracellular expression rates of CsgA coupled to fluorescence (GFP) by cloning the biobrick BBa_I13504 into the same operon in up-stream of a Rhamnose promoter.
Sequence and Features
- 10COMPATIBLE WITH RFC[10]
- 12COMPATIBLE WITH RFC[12]
- 21COMPATIBLE WITH RFC[21]
- 23COMPATIBLE WITH RFC[23]
- 25COMPATIBLE WITH RFC[25]
- 1000INCOMPATIBLE WITH RFC[1000]Illegal BsaI.rc site found at 1308
Characterization
This part was characterized in two different experiments:
- Fluorescence assay
- Transmission electron microscopy
Fluorescence assay
To be able to ensure that CsgA is expressed, we used this biobrick to check that the rhamnose inducible promoter works. In this experiment, the fluorescence signal of our CsgA construct and CsgA-GFP construct was recorded in time after induction with no, 0.2% (w/v) or 0.5% (w/v) rhamnose. Besides the fluorescence, the OD600 was measured in order to normalize the fluorescence signal per cell. All conditions were carried out in triplicates to be able to do a statistical analysis on the data. The different experiments were induced in a 96 well plate. The OD600 and fluorescence signal was recorded in a plate reader during a 18 hour period of induction at 30°C.
In figure 1, the fluorescent signal was normalized by the number of cells and plotted as a function of time. The red bars denote the error within each ID.
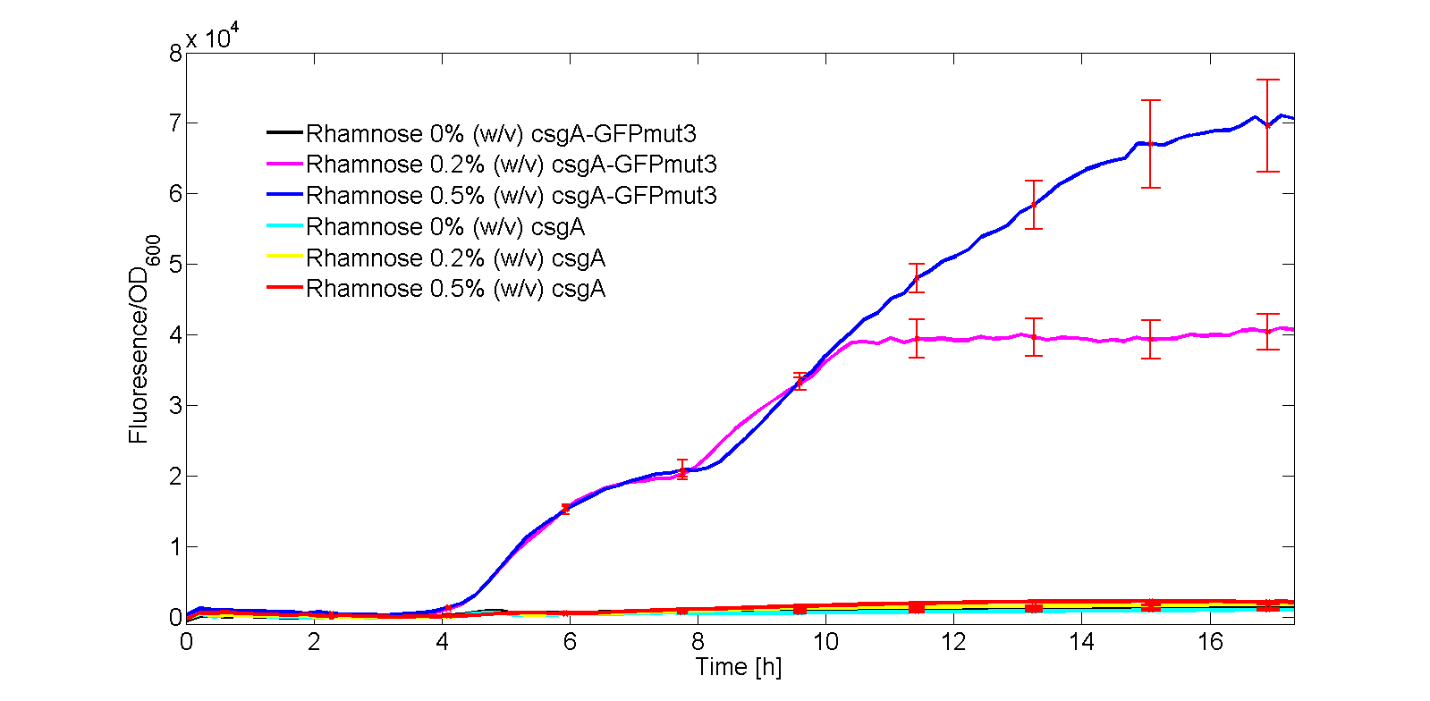
As can be seen from figure 1, only the experiments with 0.2% (w/v) and 0.5% (w/v) rhamnose induction with this biobrick gave a clear increase in fluorescence signal in time. All other experiments, gave similar levels of fluorescence, slightly increasing in time. Furthermore, it can be seen that a higher induction level of rhamnose leads to an increase in GFPmut3 and thus fluorescence. Finally, as the fluorescence signal is normalized by the cell density, one can make statements about the activity of the rhamnose promoter. The promoter seems to not be active right after induction, but more after 3 or 4 hours. This is in accordance with data from literature (Wegerer et. al), in which a low amount of fluorescence with a rhamnose promoter was observed after 2 hours of induction.
With this kinetic experiment, we have proven that the rhamnose promoter does indeed induce the expression of the csgA gene and the I13504 gene.
Transmission electron microscopy
Using TEM the formation of curli of the biobrick BBa_K1583100 was visualized (Figure 2). Although this is a different biobrick (no GFP gene behind the same promoter), curli formation can be presumed to be similar for this biobrick.


We did not observe formation of curli nanowires in the uninduced cultures of our strain. However, cells from induced cells clearly produced them, as supported by the TEM images.
References
Wegerer, A., Sun, T., and Altenbuchner, J. (2008). Optimization of an E. coli L-rhamnose-inducible expression vector: test of various genetic module combinations”, BMC Biotechnology, 8:2