
Difference between revisions of "Part:BBa K1758340"
| Line 1: | Line 1: | ||
__NOTOC__ | __NOTOC__ | ||
<partinfo>BBa_K1758340 short</partinfo> | <partinfo>BBa_K1758340 short</partinfo> | ||
| + | |||
<html> | <html> | ||
| + | </br> | ||
Repressor of the mercurry responsive promoter <i>PmerT</i> under the control of konstitutive Promoter (K608002) | Repressor of the mercurry responsive promoter <i>PmerT</i> under the control of konstitutive Promoter (K608002) | ||
</html> | </html> | ||
| Line 26: | Line 28: | ||
<p>For our mercury sensor we used parts of the mercury sensor constructed by iGEM team Peking 2010. These parts consist of the mercury dependent <i>mer</i> operon from <i>Shigella flexneri</i> R100 plasmid <i>Tn21</i>. The expression of the genes in the <i>mer</i> operon depends on the regulation by MerR its activator and promoter <i>PmerT</i>. For our sensor we used the codon optimized activator (<a href="https://parts.igem.org/Part:BBa_K1758340" target="_blank">BBa_K1758340</a>), under control of a constitutive promoter,(<a href="https://parts.igem.org/Part:BBa_K346001" target="_blank">BBa_K346001</a>). Additionally to this activator we designed and constructed the specific promoter <i>PmerT</i>(<a href="https://parts.igem.org/Part:BBa_K346002" target="_blank">BBa_K346002</a>)(figure 2). For our sensor we added a 5’-UTR downstreamd of this promoter, which increased the fluorscence of the used reporter protein sfGFP.</p> | <p>For our mercury sensor we used parts of the mercury sensor constructed by iGEM team Peking 2010. These parts consist of the mercury dependent <i>mer</i> operon from <i>Shigella flexneri</i> R100 plasmid <i>Tn21</i>. The expression of the genes in the <i>mer</i> operon depends on the regulation by MerR its activator and promoter <i>PmerT</i>. For our sensor we used the codon optimized activator (<a href="https://parts.igem.org/Part:BBa_K1758340" target="_blank">BBa_K1758340</a>), under control of a constitutive promoter,(<a href="https://parts.igem.org/Part:BBa_K346001" target="_blank">BBa_K346001</a>). Additionally to this activator we designed and constructed the specific promoter <i>PmerT</i>(<a href="https://parts.igem.org/Part:BBa_K346002" target="_blank">BBa_K346002</a>)(figure 2). For our sensor we added a 5’-UTR downstreamd of this promoter, which increased the fluorscence of the used reporter protein sfGFP.</p> | ||
| − | <figure | + | <figure> |
| − | <a href="https://static.igem.org/mediawiki/2015/0/0d/Bielefeld-CebiTec_in_vivo_Mercury.jpeg" data-lightbox="heavymetals" data-title=" Figure 2: The concept of our <i>in vivo</i> mercury sensor (<a href="https://parts.igem.org/Part:BBa_K1758343" target="_blank"> BBa_K1758343</a>), which consists of the activator under the control of a constitutive promoter <a href="https://parts.igem.org/Part:BBa_K1758340" target="_blank"> BBa_K1758340</a>)and the operator and promoter sequence of the mercury inducible promoter. An untranslated region in front of the sfGFP, which is used for detection, enhances its expression (<a href="https://parts.igem.org/Part:BBa_K1758342" target="_blank"> BBa_K1758342</a>)."><img src="https://static.igem.org/mediawiki/2015/0/0d/Bielefeld-CebiTec_in_vivo_Mercury.jpeg"></a> | + | <a href="https://static.igem.org/mediawiki/2015/0/0d/Bielefeld-CebiTec_in_vivo_Mercury.jpeg" data-lightbox="heavymetals" data-title=" Figure 2: The concept of our <i>in vivo</i> mercury sensor (<a href="https://parts.igem.org/Part:BBa_K1758343" target="_blank"> BBa_K1758343</a>), which consists of the activator under the control of a constitutive promoter <a href="https://parts.igem.org/Part:BBa_K1758340" target="_blank"> BBa_K1758340</a>)and the operator and promoter sequence of the mercury inducible promoter. An untranslated region in front of the sfGFP, which is used for detection, enhances its expression (<a href="https://parts.igem.org/Part:BBa_K1758342" target="_blank"> BBa_K1758342</a>)."><img src="https://static.igem.org/mediawiki/2015/0/0d/Bielefeld-CebiTec_in_vivo_Mercury.jpeg" style="width:500px"></a> |
<figcaption>Figure 2: The concept of our <i>in vivo</i> mercury sensor (<a href="https://parts.igem.org/Part:BBa_K1758343" target="_blank"> BBa_K1758343</a>), which consists of the activator under the control of a constitutive promoter <a href="https://parts.igem.org/Part:BBa_K1758340" target="_blank"> BBa_K1758340</a>)and the operator and promoter sequence of the mercury inducible promoter. An untranslated region in front of the sfGFP, which is used for detection, enhances its expression (<a href="https://parts.igem.org/Part:BBa_K1758342" target="_blank"> BBa_K1758342</a>).</figcaption> | <figcaption>Figure 2: The concept of our <i>in vivo</i> mercury sensor (<a href="https://parts.igem.org/Part:BBa_K1758343" target="_blank"> BBa_K1758343</a>), which consists of the activator under the control of a constitutive promoter <a href="https://parts.igem.org/Part:BBa_K1758340" target="_blank"> BBa_K1758340</a>)and the operator and promoter sequence of the mercury inducible promoter. An untranslated region in front of the sfGFP, which is used for detection, enhances its expression (<a href="https://parts.igem.org/Part:BBa_K1758342" target="_blank"> BBa_K1758342</a>).</figcaption> | ||
</figure> | </figure> | ||
| Line 33: | Line 35: | ||
<div class="row"> | <div class="row"> | ||
| − | <div class="col-md-6 text-center" style="margin-bottom: 50px"> <figure | + | <div class="col-md-6 text-center" style="margin-bottom: 50px"> <figure> |
| − | <a href="https://static.igem.org/mediawiki/2015/6/67/Bielefeld-CeBiTec_mercury_fluorescence_in_vivo.jpeg" data-lightbox="heavymetals" data-title="Figure 3: During cultivation the sfGFP signal in reaction to different mercury concentrations was measured. The induction with mercury happened after 165 minutes. Error bars represent the standard deviation of three biological replicates. "><img src="https://static.igem.org/mediawiki/2015/6/67/Bielefeld-CeBiTec_mercury_fluorescence_in_vivo.jpeg" alt="Adjusting the detection limit"></a> | + | <a href="https://static.igem.org/mediawiki/2015/6/67/Bielefeld-CeBiTec_mercury_fluorescence_in_vivo.jpeg" data-lightbox="heavymetals" data-title="Figure 3: During cultivation the sfGFP signal in reaction to different mercury concentrations was measured. The induction with mercury happened after 165 minutes. Error bars represent the standard deviation of three biological replicates. "><img src="https://static.igem.org/mediawiki/2015/6/67/Bielefeld-CeBiTec_mercury_fluorescence_in_vivo.jpeg" alt="Adjusting the detection limit" style="width:500px"></a> |
<figcaption>Figure 3: During cultivation the sfGFP signal in reaction to different mercury concentrations was measured. The induction with mercury happened after 165 minutes. Error bars represent the standard deviation of three biological replicates. </figcaption> | <figcaption>Figure 3: During cultivation the sfGFP signal in reaction to different mercury concentrations was measured. The induction with mercury happened after 165 minutes. Error bars represent the standard deviation of three biological replicates. </figcaption> | ||
</figure> | </figure> | ||
</div> | </div> | ||
<div class="col-md-6 text-center" style="margin-bottom: 50px"> | <div class="col-md-6 text-center" style="margin-bottom: 50px"> | ||
| − | <figure | + | <figure> |
| − | <a href="https://static.igem.org/mediawiki/2015/5/52/Bielefeld-CeBiTec_mercury_fluorescence_in_vivo_Balkendiagramm.jpeg" data-lightbox="heavymetals" data-title="Figure 4: Fluorescence levels at two different stages of cultivation. Shown are levels after 120 minutes and 190 minutes. Error bars represent the standard deviation of three biological replicates. "><img src="https://static.igem.org/mediawiki/2015/5/52/Bielefeld-CeBiTec_mercury_fluorescence_in_vivo_Balkendiagramm.jpeg" alt="Adjusting the detection limit"></a> | + | <a href="https://static.igem.org/mediawiki/2015/5/52/Bielefeld-CeBiTec_mercury_fluorescence_in_vivo_Balkendiagramm.jpeg" data-lightbox="heavymetals" data-title="Figure 4: Fluorescence levels at two different stages of cultivation. Shown are levels after 120 minutes and 190 minutes. Error bars represent the standard deviation of three biological replicates. "><img src="https://static.igem.org/mediawiki/2015/5/52/Bielefeld-CeBiTec_mercury_fluorescence_in_vivo_Balkendiagramm.jpeg" alt="Adjusting the detection limit" style="width:500px"></a> |
<figcaption>Figure 4: Fluorescence levels at two different stages of cultivation. Shown are levels after 120 minutes and 190 minutes. Error bars represent the standard deviation of three biological replicates. </figcaption> | <figcaption>Figure 4: Fluorescence levels at two different stages of cultivation. Shown are levels after 120 minutes and 190 minutes. Error bars represent the standard deviation of three biological replicates. </figcaption> | ||
</figure> | </figure> | ||
| Line 53: | Line 55: | ||
<div class="row"> | <div class="row"> | ||
| − | <div class="col-md-6 text-center" style="margin-bottom: 50px"> <figure | + | <div class="col-md-6 text-center" style="margin-bottom: 50px"> <figure> |
| − | <a href=" https://static.igem.org/mediawiki/2015/3/3c/Bielefeld-CeBiTec_in_vitro_merR-part.jpeg" data-lightbox="heavymetals" data-title=" Figure 5: To produce the cell extract for <i>in vitro</i> characterization a construct (BBa_K1758340 ) with chromium repressor under the control of a constitutive promoter and strong RBS. " alt="repressor construct used for in vivo characterization."><img src=" https://static.igem.org/mediawiki/2015/3/3c/Bielefeld-CeBiTec_in_vitro_merR-part.jpeg" alt="repressor construct used for in vitro characterisation"></a> <figcaption>Figure 5: To produce the cell extract for <i>in vitro</i> characterization a construct (<a href="https://parts.igem.org/Part:BBa_K175840" target="_blank">BBa_K175840</a>) with chromium repressor under the control of a constitutive promoter and strong RBS (BBa_K608002) is needed. </figcaption> | + | <a href=" https://static.igem.org/mediawiki/2015/3/3c/Bielefeld-CeBiTec_in_vitro_merR-part.jpeg" data-lightbox="heavymetals" data-title=" Figure 5: To produce the cell extract for <i>in vitro</i> characterization a construct (BBa_K1758340 ) with chromium repressor under the control of a constitutive promoter and strong RBS. " alt="repressor construct used for in vivo characterization."><img src=" https://static.igem.org/mediawiki/2015/3/3c/Bielefeld-CeBiTec_in_vitro_merR-part.jpeg" alt="repressor construct used for in vitro characterisation" style="width:500px"></a> <figcaption>Figure 5: To produce the cell extract for <i>in vitro</i> characterization a construct (<a href="https://parts.igem.org/Part:BBa_K175840" target="_blank">BBa_K175840</a>) with chromium repressor under the control of a constitutive promoter and strong RBS (BBa_K608002) is needed. </figcaption> |
</figure> | </figure> | ||
</div> | </div> | ||
| − | <div class="col-md-6 text-center" style="margin-bottom: 50px"> <figure | + | <div class="col-md-6 text-center" style="margin-bottom: 50px"> <figure> |
| − | <a href=" https://static.igem.org/mediawiki/2015/e/e2/Bielefeld-CebiTec_in_vitro_T7-merT-UTR-sfGFP.jpeg " data-lightbox="heavymetals" data-title="T7-PmerT-UTR-sfGFP used for<i>in vitro</i> characterization." https://static.igem.org/mediawiki/2015/e/e2/Bielefeld-CebiTec_in_vitro_T7-merT-UTR-sfGFP.jpeg " alt="promoter construct used for in vivo characterization."><img src=" https://static.igem.org/mediawiki/2015/e/e2/Bielefeld-CebiTec_in_vitro_T7-merT-UTR-sfGFP.jpeg" alt="promoter construct used for in vivo characterisation "></a> <figcaption>T7-<i>PmerT</i>-UTR-sfGFP <a href="https://parts.igem.org/Part:BBa_K1758344" target="_blank"> BBa_K175844</a> used for<i>in vitro</i> characterization.</figcaption> | + | <a href=" https://static.igem.org/mediawiki/2015/e/e2/Bielefeld-CebiTec_in_vitro_T7-merT-UTR-sfGFP.jpeg " data-lightbox="heavymetals" data-title="T7-PmerT-UTR-sfGFP used for<i>in vitro</i> characterization." https://static.igem.org/mediawiki/2015/e/e2/Bielefeld-CebiTec_in_vitro_T7-merT-UTR-sfGFP.jpeg " alt="promoter construct used for in vivo characterization."><img src=" https://static.igem.org/mediawiki/2015/e/e2/Bielefeld-CebiTec_in_vitro_T7-merT-UTR-sfGFP.jpeg" alt="promoter construct used for in vivo characterisation" style="width:500px"></a> <figcaption>T7-<i>PmerT</i>-UTR-sfGFP <a href="https://parts.igem.org/Part:BBa_K1758344" target="_blank"> BBa_K175844</a> used for<i>in vitro</i> characterization.</figcaption> |
</figure> | </figure> | ||
</div> | </div> | ||
| Line 69: | Line 71: | ||
| − | <figure | + | <figure> |
| − | <a href="https://static.igem.org/mediawiki/2015/b/b9/Bielefeld-CeBiTec_Influence_of_mercury_on_the_cell_extract.jpeg" data-lightbox="heavymetals" data-title="Figure 7: Influence of different mercury concentrations on our crude cell extract. Error bars represent the standard deviation of three biological replicates. "><img src="https://static.igem.org/mediawiki/2015/b/b9/Bielefeld-CeBiTec_Influence_of_mercury_on_the_cell_extract.jpeg" alt="Adjusting the detection limit"></a> | + | <a href="https://static.igem.org/mediawiki/2015/b/b9/Bielefeld-CeBiTec_Influence_of_mercury_on_the_cell_extract.jpeg" data-lightbox="heavymetals" data-title="Figure 7: Influence of different mercury concentrations on our crude cell extract. Error bars represent the standard deviation of three biological replicates. "><img src="https://static.igem.org/mediawiki/2015/b/b9/Bielefeld-CeBiTec_Influence_of_mercury_on_the_cell_extract.jpeg" alt="Adjusting the detection limit" style="width:500px"></a> |
<figcaption>Figure 7: Influence of different mercury concentrations on our crude cell extract. Error bars represent the standard deviation of three biological replicates.</figcaption> | <figcaption>Figure 7: Influence of different mercury concentrations on our crude cell extract. Error bars represent the standard deviation of three biological replicates.</figcaption> | ||
</figure> | </figure> | ||
| − | |||
| − | |||
| − | |||
| − | |||
| − | |||
| Line 84: | Line 81: | ||
<div class="row"> | <div class="row"> | ||
<div class="col-md-6 text-center" style="margin-bottom: 50px"> | <div class="col-md-6 text-center" style="margin-bottom: 50px"> | ||
| − | <figure | + | <figure> |
| − | <a href="https://static.igem.org/mediawiki/2015/7/7f/Bielefeld-CeBiTec_induction_mercury_in_merR_cell-extract.jpeg" data-lightbox="heavymetals" data-title="Figure 8: Mercury specific cell extract made from E. coli cells, which have already expressed the activator before cell extract production. Induction of mercury inducible promoter without T7 in front of the operator site with different mercury concentrations. Error bars represent the standard deviation of three biological replicates. "><img src="https://static.igem.org/mediawiki/2015/7/7f/Bielefeld-CeBiTec_induction_mercury_in_merR_cell-extract.jpeg" alt="Adjusting the detection limit"></a> | + | <a href="https://static.igem.org/mediawiki/2015/7/7f/Bielefeld-CeBiTec_induction_mercury_in_merR_cell-extract.jpeg" data-lightbox="heavymetals" data-title="Figure 8: Mercury specific cell extract made from E. coli cells, which have already expressed the activator before cell extract production. Induction of mercury inducible promoter without T7 in front of the operator site with different mercury concentrations. Error bars represent the standard deviation of three biological replicates. "><img src="https://static.igem.org/mediawiki/2015/7/7f/Bielefeld-CeBiTec_induction_mercury_in_merR_cell-extract.jpeg" alt="Adjusting the detection limit" style="width:500px"></a> |
<figcaption>Figure 8: Mercury specific cell extract made from E. coli cells, which have already expressed the activator before cell extract production. Induction of mercury inducible promoter without T7 in front of the operator site with different mercury concentrations. Error bars represent the standard deviation of three biological replicates. </figcaption> | <figcaption>Figure 8: Mercury specific cell extract made from E. coli cells, which have already expressed the activator before cell extract production. Induction of mercury inducible promoter without T7 in front of the operator site with different mercury concentrations. Error bars represent the standard deviation of three biological replicates. </figcaption> | ||
</figure> | </figure> | ||
</div> | </div> | ||
<div class="col-md-6 text-center" style="margin-bottom: 50px"> | <div class="col-md-6 text-center" style="margin-bottom: 50px"> | ||
| − | <figure | + | <figure> |
| − | <a href="https://static.igem.org/mediawiki/2015/f/f9/Bielefeld-CeBiTec_correction_induction_mercury_in_merR_cell-extract.jpeg" data-lightbox="heavymetals" data-title="TEXT Error bars represent the standard deviation of three biological replicates."><img src="https://static.igem.org/mediawiki/2015/f/f9/Bielefeld-CeBiTec_correction_induction_mercury_in_merR_cell-extract.jpeg" alt="Adjusting the detection limit"></a> | + | <a href="https://static.igem.org/mediawiki/2015/f/f9/Bielefeld-CeBiTec_correction_induction_mercury_in_merR_cell-extract.jpeg" data-lightbox="heavymetals" data-title="TEXT Error bars represent the standard deviation of three biological replicates."><img src="https://static.igem.org/mediawiki/2015/f/f9/Bielefeld-CeBiTec_correction_induction_mercury_in_merR_cell-extract.jpeg" alt="Adjusting the detection limit" style="width:500px"></a> |
<figcaption>Figure 9: Mercury specific cell extract made from <i>E. coli</i> cells, which have already expressed the activator before cell extract production. Induction of mercury inducible promoter without T7 in front of the operator site with different mercury concentrations. Error bars represent the standard deviation of three biological replicates. </figcaption> | <figcaption>Figure 9: Mercury specific cell extract made from <i>E. coli</i> cells, which have already expressed the activator before cell extract production. Induction of mercury inducible promoter without T7 in front of the operator site with different mercury concentrations. Error bars represent the standard deviation of three biological replicates. </figcaption> | ||
</figure> | </figure> | ||
Revision as of 05:51, 19 September 2015
Mercury repressor under control of constitutive promoter and strong RBS
Repressor of the mercurry responsive promoter PmerT under the control of konstitutive Promoter (K608002)
Usage and Biology
This device was used to create cell extract for our in vitro characterization of the mercury biosensor. It is based on BBa_K346001 desinged by team Peking 2010. Together with BBa_K1758342,BBa_K1758343 it represents our mercury sensor.
Sequence and Features
- 10COMPATIBLE WITH RFC[10]
- 12INCOMPATIBLE WITH RFC[12]Illegal NheI site found at 462
Illegal NheI site found at 485 - 21COMPATIBLE WITH RFC[21]
- 23COMPATIBLE WITH RFC[23]
- 25COMPATIBLE WITH RFC[25]
- 1000COMPATIBLE WITH RFC[1000]
Results
One of the already existing sensors we used for our system is the mercury sensor consisting of MerR the activator and the mercury specific promoter pmerT. The promoter is regulated by the MerR, which binds Hg2+-ions. Similar to the former sensors we added a sfGFP for detection via fluorescence.
For our mercury sensor we used parts of the mercury sensor constructed by iGEM team Peking 2010. These parts consist of the mercury dependent mer operon from Shigella flexneri R100 plasmid Tn21. The expression of the genes in the mer operon depends on the regulation by MerR its activator and promoter PmerT. For our sensor we used the codon optimized activator (BBa_K1758340), under control of a constitutive promoter,(BBa_K346001). Additionally to this activator we designed and constructed the specific promoter PmerT(BBa_K346002)(figure 2). For our sensor we added a 5’-UTR downstreamd of this promoter, which increased the fluorscence of the used reporter protein sfGFP.


We tested our mercury sensor with sfGFP as reporter gene, to test the functionality of the system. Moreover we tested different concentrations. The kinetic of our sensors response to different mercury concentrations is shown in figure 3. A strong increase in fluorescence levels is notecible after induction with mercury after 120 min. For better visualization the kinetics of figure 3 are represented as bars in figure 4. A fluorescence level difference for 120 min and 190 min is represented.
in vitro
For the characterization of the mercury sensor with CFPS we used parts differing from that we used in the in vivo characterization. For the in vitro characterization we used a cell extract out of cells, which contained the plasmid ( BBa_K1758340)(figure 5). In addition, we added plasmid DNA to the cell extract. This plasmid consisted of the mercury specific promoter pmerT with 5’-UTR-sfGFP. The entire sequence was placed under the control of of T7-promoter ( BBa_K1758344)(figure 6). The T7-promoter is needed to get a better fluorescence expression.


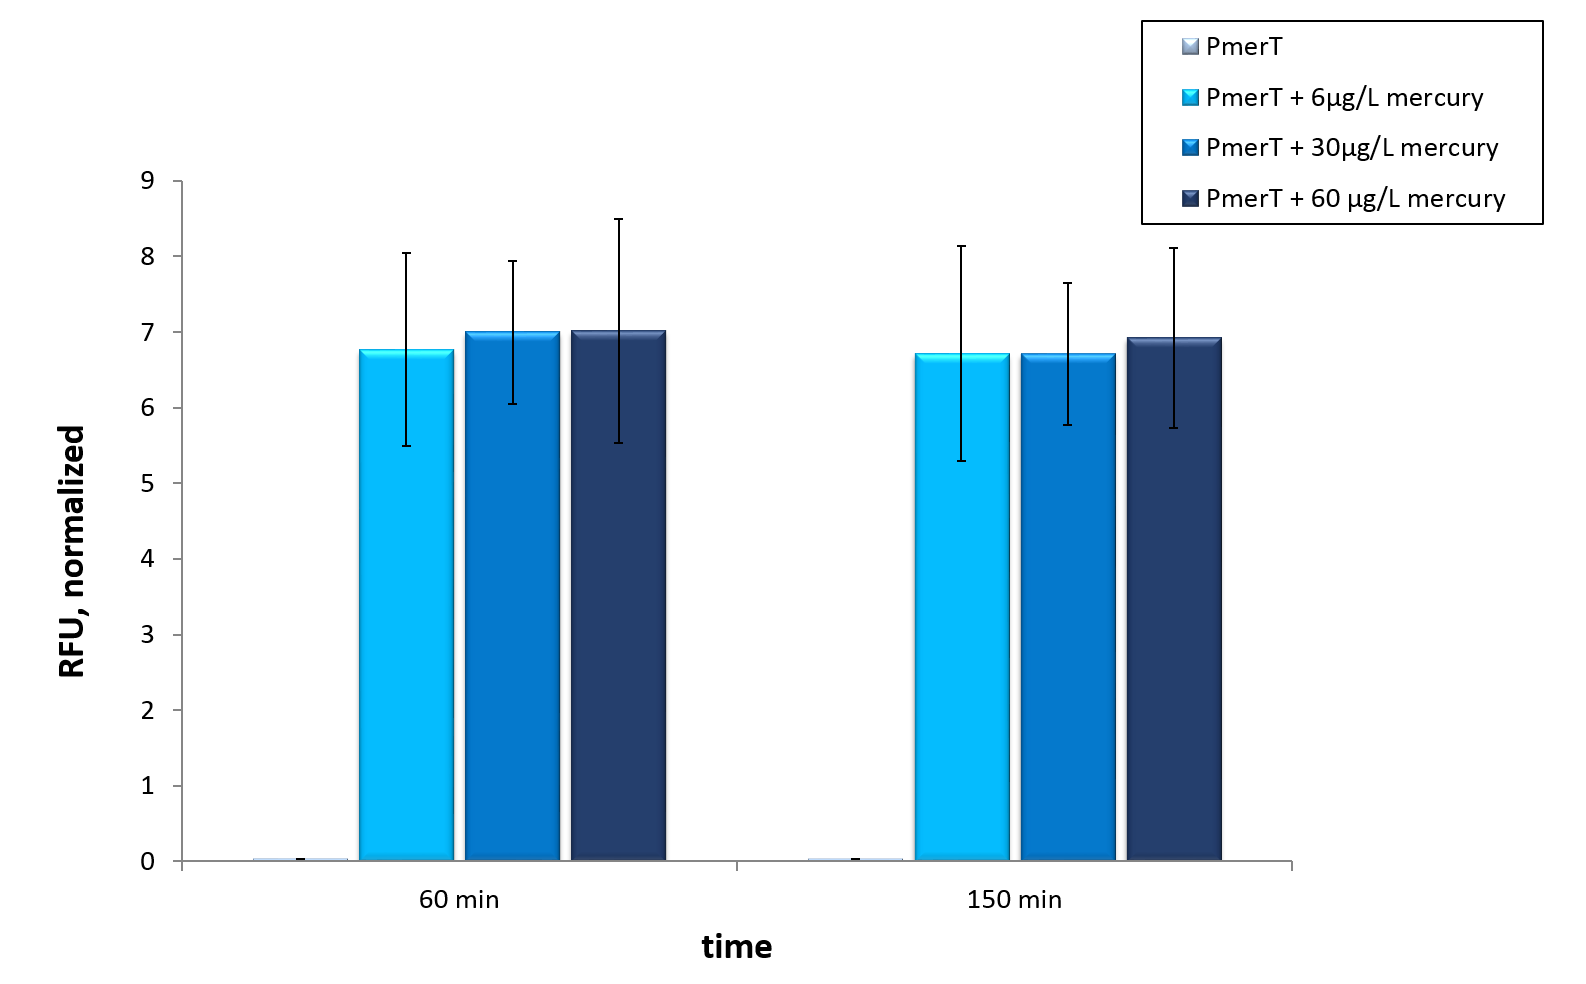
In vitro this sensor showed good results. The fluorescence level was high at low concentrations. Additionally, it showed that the expression level at 6 µg/L (Guideline of WHO for Mercury) reached the maximal signal. This result indicated the potential for measurement of concentrations under 6 µg/L.To confirm this hypothesis, it takes more experiments and tests with lower concentrations. Due to the high expression of sfGFP at low concentrations and the same expression level at different concentrations, it is not possible to quantify mercury with CFPS analyses . , Our model predicted this observation. During the measurement we noticed that the heavy metals have negative influences on the cell extract. Because of this fact, we used a correction factor, which resulted from the heavy metals influence on the CFPS system. This already optimized sensor showed the high potential of optimized sensors in CFPS.