Difference between revisions of "Part:BBa K1701005"
(→Results) |
|||
| Line 74: | Line 74: | ||
[[File:tasa10.png]] | [[File:tasa10.png]] | ||
| − | + | [[File:tasa11.png]] | |
| + | Figure 9. Fluorescence measurement of B. subtilis cells containing the fusion proteins. a) Fluorescence intensity of the fusion proteins Pveg-TasA-EGFP and Ptas-TasA-EGFP. c) A visible photograph of a). | ||
== References == | == References == | ||
Latest revision as of 05:41, 18 September 2015
TasA
In B. subtilis the extracellular matrix is composed of two major components, an EPS and the protein TasA, which polymerizes into amyloid-like fibers.
Sequence and Features
- 10INCOMPATIBLE WITH RFC[10]Illegal EcoRI site found at 150
Illegal PstI site found at 38 - 12INCOMPATIBLE WITH RFC[12]Illegal EcoRI site found at 150
Illegal PstI site found at 38 - 21INCOMPATIBLE WITH RFC[21]Illegal EcoRI site found at 150
- 23INCOMPATIBLE WITH RFC[23]Illegal EcoRI site found at 150
Illegal PstI site found at 38 - 25INCOMPATIBLE WITH RFC[25]Illegal EcoRI site found at 150
Illegal PstI site found at 38 - 1000COMPATIBLE WITH RFC[1000]
Background
Biofilms are assemblages embedded in a matrix composed of exopolysaccrides(EPSs), proteins and sometimes DNA. Matrix production results in the formation of complex architecture of typical of biofilms. In B. subtilis the extracellular matrix is composed of two major components, an EPS and the protein TasA, which polymerizes into amyloid-like fibers. Expression of the epsA-O operon, encoding the enzymes involved in EPS production, and tasA is indirectly under the control of the master transcriptional regulator Spo0A. Spo0A activity depends on its phosphorylation state. Spo0A phosphorylation is controlled by five Histidine kinases (KinA–KinE), which respond to different environmental cues. Phosphorylated Spo0A (Spo0A∼P) accumulation leads to the production of SinI, an antagonist of SinR. SinR is a transcriptional repressor that keeps the matrix genes shut off when conditions are not propitious for biofilm growth. When environmental cues that induce biofilm formation are present, the kinases are activated, and transcription of the matrix genes is induced via this signal transduction pathway.
Figure 1. Branda SS et al. Biofilms: The matrix revisited. Trends Microbiol 2005
Biology
It has been demonstrated that plant polysaccharides can stimulate biofilm formation in B. subtilis. It mainly functions in two ways: (i) by inducing matrix gene expression and (ii) by acting as a substrate that is processed and incorporated into biofilm EPS matrix.
Protein sturcture
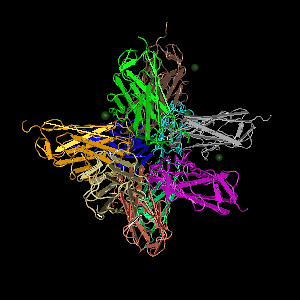
Figure 2. The 3D structure of the protein of TasA. From http://www.ncbi.nlm.nih.gov/Structure/mmdb/mmdbsrv.cgi?uid=112569
Part uses
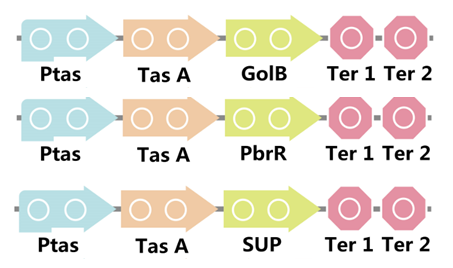
In order to improve the efficiency of heavy metal adsorption that our project aims at, we decided to use the cell surface-display strategy by using TasA, the major protein of the biofilm matrix component in B. subtilis as fusion partner to display the heavy metal binding proteins(GolB, PbrR and SUP).
When nutrition is sufficient, we can use plant polysaccharides to induce the formation of biofilm, on which protein TasA can be simultaneously expressed with heavy metal binding proteins. Therefore, B. subtilis can adsorb heavy metal under benign conditions.
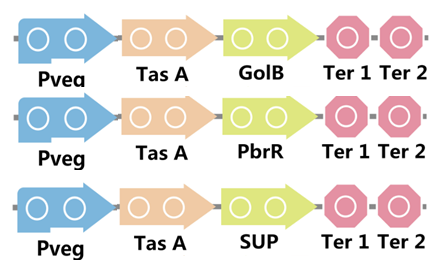
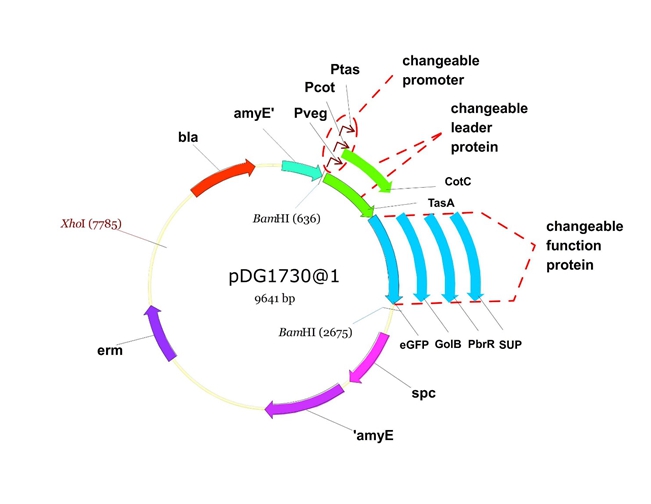
To realize this goal, we have designed three pathways shown in Figure 3, which are used in our project. In order to improve the efficiency of the expression of the three pathways, we utilized a constitutive promoter Pveg, a biobrick part in the biological parts of iGEM used by us to replace the promoter Ptas, which is involved in the three pathways in Figure 4.
Figure 3. Three pathways designed by our group involving TasA part.
Figure 4. Three pathways designed by our group involving TasA part but replacing Ptas with Pveg.
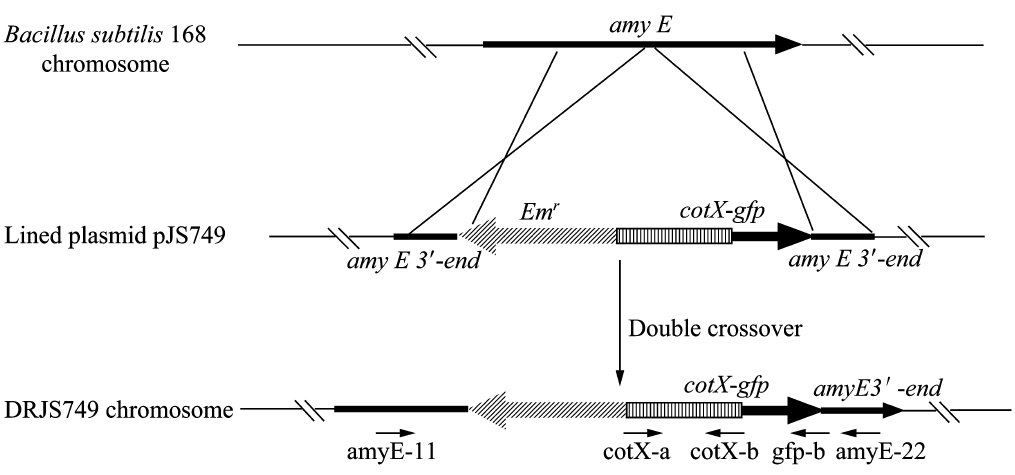
We will construct our plasmid in E.coli first and affirm the feasibility of the pathways, after which we will transform the plasmid into B.subtilis. After linearization of the plasmid, we can integrate the target genes into the chromosomes of B.subtilis utilizing homologous recombination. The process and the shuttle plasmid of our project can be shown as follows.
Figure 5. The process to integrate the target genes into the chromosomes of B.subtilis utilizing homologous recombination.
Figure 6. The shuttle plasmid designed by our project including the preceding pathways.
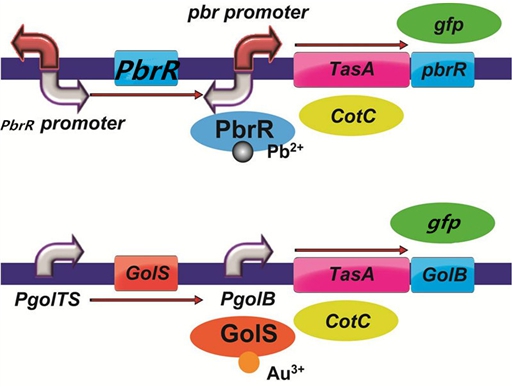
To improve the selectivity of heavy metal(such as lead and gold) adsorption, we had a plan to design two pathways as follows. With the heavy metal specific promoter, the heavy metal-binding biofilm protein including TasA can be expressed only when there is specific heavy metal in the solution. In addition, we had a plan to do a pre-test to demonstrate the feasibility of the pathways by replacing the heavy metal binding protein with the reporter protein GFP.
Figure 7. The designed pathways to improve the selectivity of lead and gold adsorption.
Results
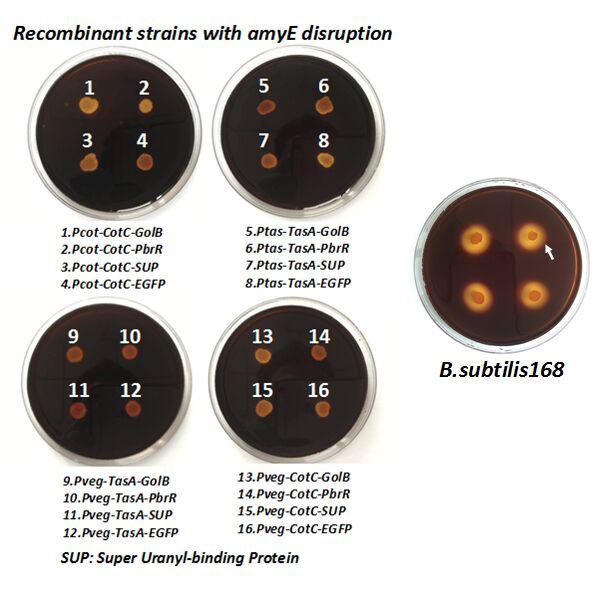
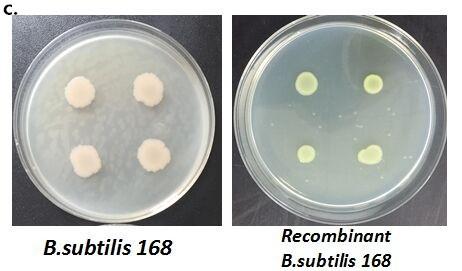
After we constructed the 16 kits in E.coli, we inserted them into the shuttle plasmid pDG1730 which can transfer from E.coli to B. subtilis. We insert our fusion genes between two sequences of the amylase genes on the plasmid. By homologous recombination, our fusion genes will replace the amylase gene on the genome of B. subtilis. In order to test and verify whether homologous recombination is successful, we built the following three steps. Antibiotic selection, bacterial PCR analysis and amylase activity analysis. After a series of test and verification experiments, we have successfully inserted the 16 kits into the genome of B. subtilis. The following figure shows the result of the amylase activity analysis. The picture on the right is the control group while the pictures on the left are the experiment groups. When we applied iodine on the plate with starch, there would be hydrolysis cycles on the plate because the α-amylase gene wasn’t replaced. However, there wouldn’t be hydrolysis cycles on the plate if homologous recombination was successful.
Figure 8. Result of homologous recombination.
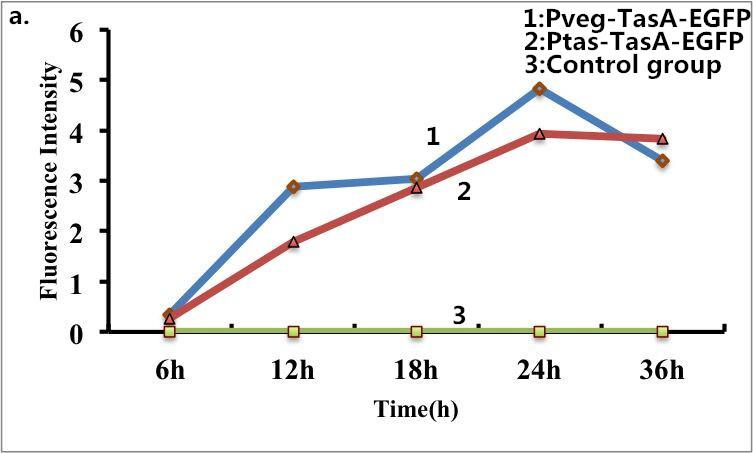
B. subtilis cells carrying fusion proteins (TasA-EGFP ) were fixed for visualization under a fluorescence microscope. The same batch of B. subtilis cells without fusion proteins was used as s control. Strong fluorescence was observed when the B. subtilis cells expressed the fusion proteins (TasA-EGFP), whereas no fluorescence was detected for the control group. Taken together, these results confirmed the fusion proteins can express well on the surface of B. subtilis. The following pictures show the results of fluorescence measurements.
Figure 9. Fluorescence measurement of B. subtilis cells containing the fusion proteins. a) Fluorescence intensity of the fusion proteins Pveg-TasA-EGFP and Ptas-TasA-EGFP. c) A visible photograph of a).
References
[1].Lyon, C.J., R.E. Law and W.A. Hsueh, Minireview: adiposity, inflammation, and atherogenesis. Endocrinology, 2003. 144(6): p. 2195-200.
[2].Branda SS et al. Biofilms: The matrix revisited. Trends Microbiol 2005 13(1):20–26.


