Difference between revisions of "Part:BBa K1330000"
| Line 19: | Line 19: | ||
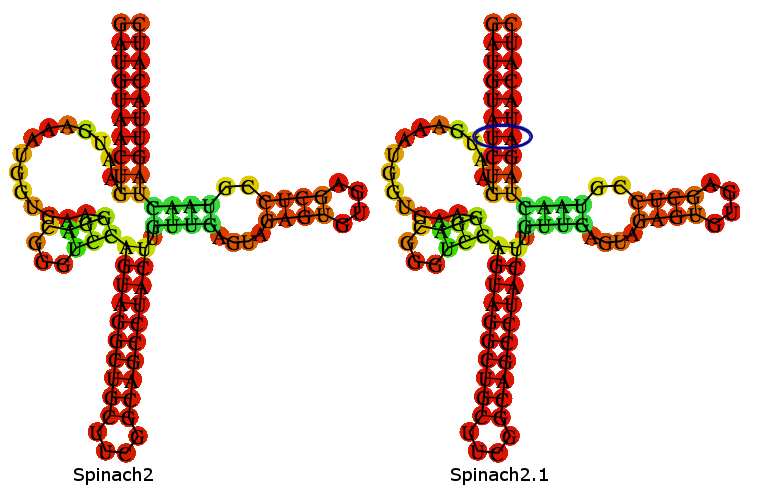
A folding-prediction is shown below, demonstrating that Spinach2.1 is expected adopt the same fold as Spinach2. | A folding-prediction is shown below, demonstrating that Spinach2.1 is expected adopt the same fold as Spinach2. | ||
| + | |||
[[File:DTU-Denmark-RNAFold.png||Spinach2.1 folding]] | [[File:DTU-Denmark-RNAFold.png||Spinach2.1 folding]] | ||
To confirm that Spinach2.1 functions as well as Spinach2, fluorescence measurements were conducted on Spinach2 and Spinach2.1 RNA ''in vitro''. | To confirm that Spinach2.1 functions as well as Spinach2, fluorescence measurements were conducted on Spinach2 and Spinach2.1 RNA ''in vitro''. | ||
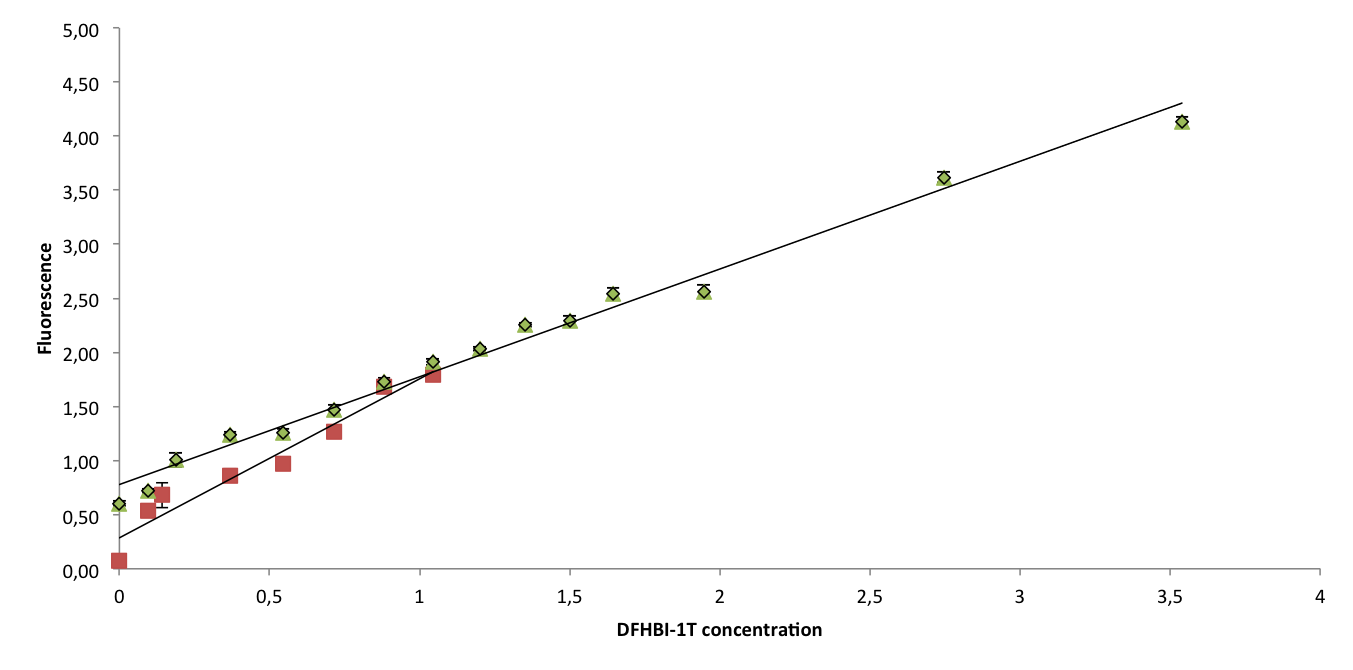
Fluorescence was measured on samples with different concentrations of DFHBI-1T and excess RNA, to compare the brightness of the Spinach-DFHBI complexes. The resulting fluorescence standard curves are shown below: | Fluorescence was measured on samples with different concentrations of DFHBI-1T and excess RNA, to compare the brightness of the Spinach-DFHBI complexes. The resulting fluorescence standard curves are shown below: | ||
| + | |||
[[File:DTU-Denmark-SpinachComparison.png|700px|Spinach2.1 fluorescence standard curve]]. | [[File:DTU-Denmark-SpinachComparison.png|700px|Spinach2.1 fluorescence standard curve]]. | ||
The slopes of the curves represent the brightness of the RNA-DFHBI complex. The slopes are similar, although Spinach2.1 might be moderately less bright. More experiments need to be conducted to establish whether the difference is significant. | The slopes of the curves represent the brightness of the RNA-DFHBI complex. The slopes are similar, although Spinach2.1 might be moderately less bright. More experiments need to be conducted to establish whether the difference is significant. | ||
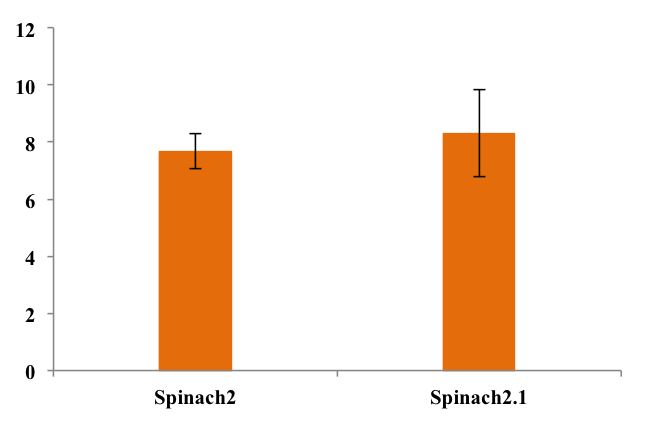
To assess folding efficiency of Spinach2.1 fluorescence was measured on samples with excess DFHBI. Fluorescence normalized to RNA concentration is shown below: | To assess folding efficiency of Spinach2.1 fluorescence was measured on samples with excess DFHBI. Fluorescence normalized to RNA concentration is shown below: | ||
| + | |||
[[File:DTU-Denmark-wt_m2_barchart.png|700px|Spinach bar charts]] | [[File:DTU-Denmark-wt_m2_barchart.png|700px|Spinach bar charts]] | ||
Revision as of 22:47, 30 October 2014
Spinach2.1 flanked by tRNALys3
This BioBrick contains the gene coding for the Spinach2.1 RNA, flanked by a tRNA scaffold sequence.
Usage and Biology
Spinach 2.1 RNA can bind and activate the fluorophore DFHBI, both in vivo and in vitro. RNA molecules can thus be fluorescently tagged, by gene fusion with this BioBrick. The flanking tRNA comes from human tRNALys3 and increases stability and folding efficiency of the RNA, leading to higher fluorescent signal. It is possible to detect signal from Spinach2.1 when expressed from moderate strength promoters, e.g. the Anderson promoter library.
This part does not contain or need a Ribosome Binding Site.
Characterization
Spinach2.1 is derived from the Spinach2 sequence described in [http://www.nature.com/nmeth/journal/v10/n12/full/nmeth.2701.html Strack et al. (2013)]. Spinach2.1 has had 2 nucleotides swapped to remove a SpeI site, present in Spinach2.
A folding-prediction is shown below, demonstrating that Spinach2.1 is expected adopt the same fold as Spinach2.
To confirm that Spinach2.1 functions as well as Spinach2, fluorescence measurements were conducted on Spinach2 and Spinach2.1 RNA in vitro. Fluorescence was measured on samples with different concentrations of DFHBI-1T and excess RNA, to compare the brightness of the Spinach-DFHBI complexes. The resulting fluorescence standard curves are shown below:
 .
The slopes of the curves represent the brightness of the RNA-DFHBI complex. The slopes are similar, although Spinach2.1 might be moderately less bright. More experiments need to be conducted to establish whether the difference is significant.
To assess folding efficiency of Spinach2.1 fluorescence was measured on samples with excess DFHBI. Fluorescence normalized to RNA concentration is shown below:
Sequence and Features
- 10COMPATIBLE WITH RFC[10]
- 12COMPATIBLE WITH RFC[12]
- 21COMPATIBLE WITH RFC[21]
- 23COMPATIBLE WITH RFC[23]
- 25COMPATIBLE WITH RFC[25]
- 1000COMPATIBLE WITH RFC[1000]


