Difference between revisions of "Part:BBa K1399007:Experience"
(→Applications of BBa_K1399007) |
|||
| Line 5: | Line 5: | ||
===Applications of BBa_K1399007=== | ===Applications of BBa_K1399007=== | ||
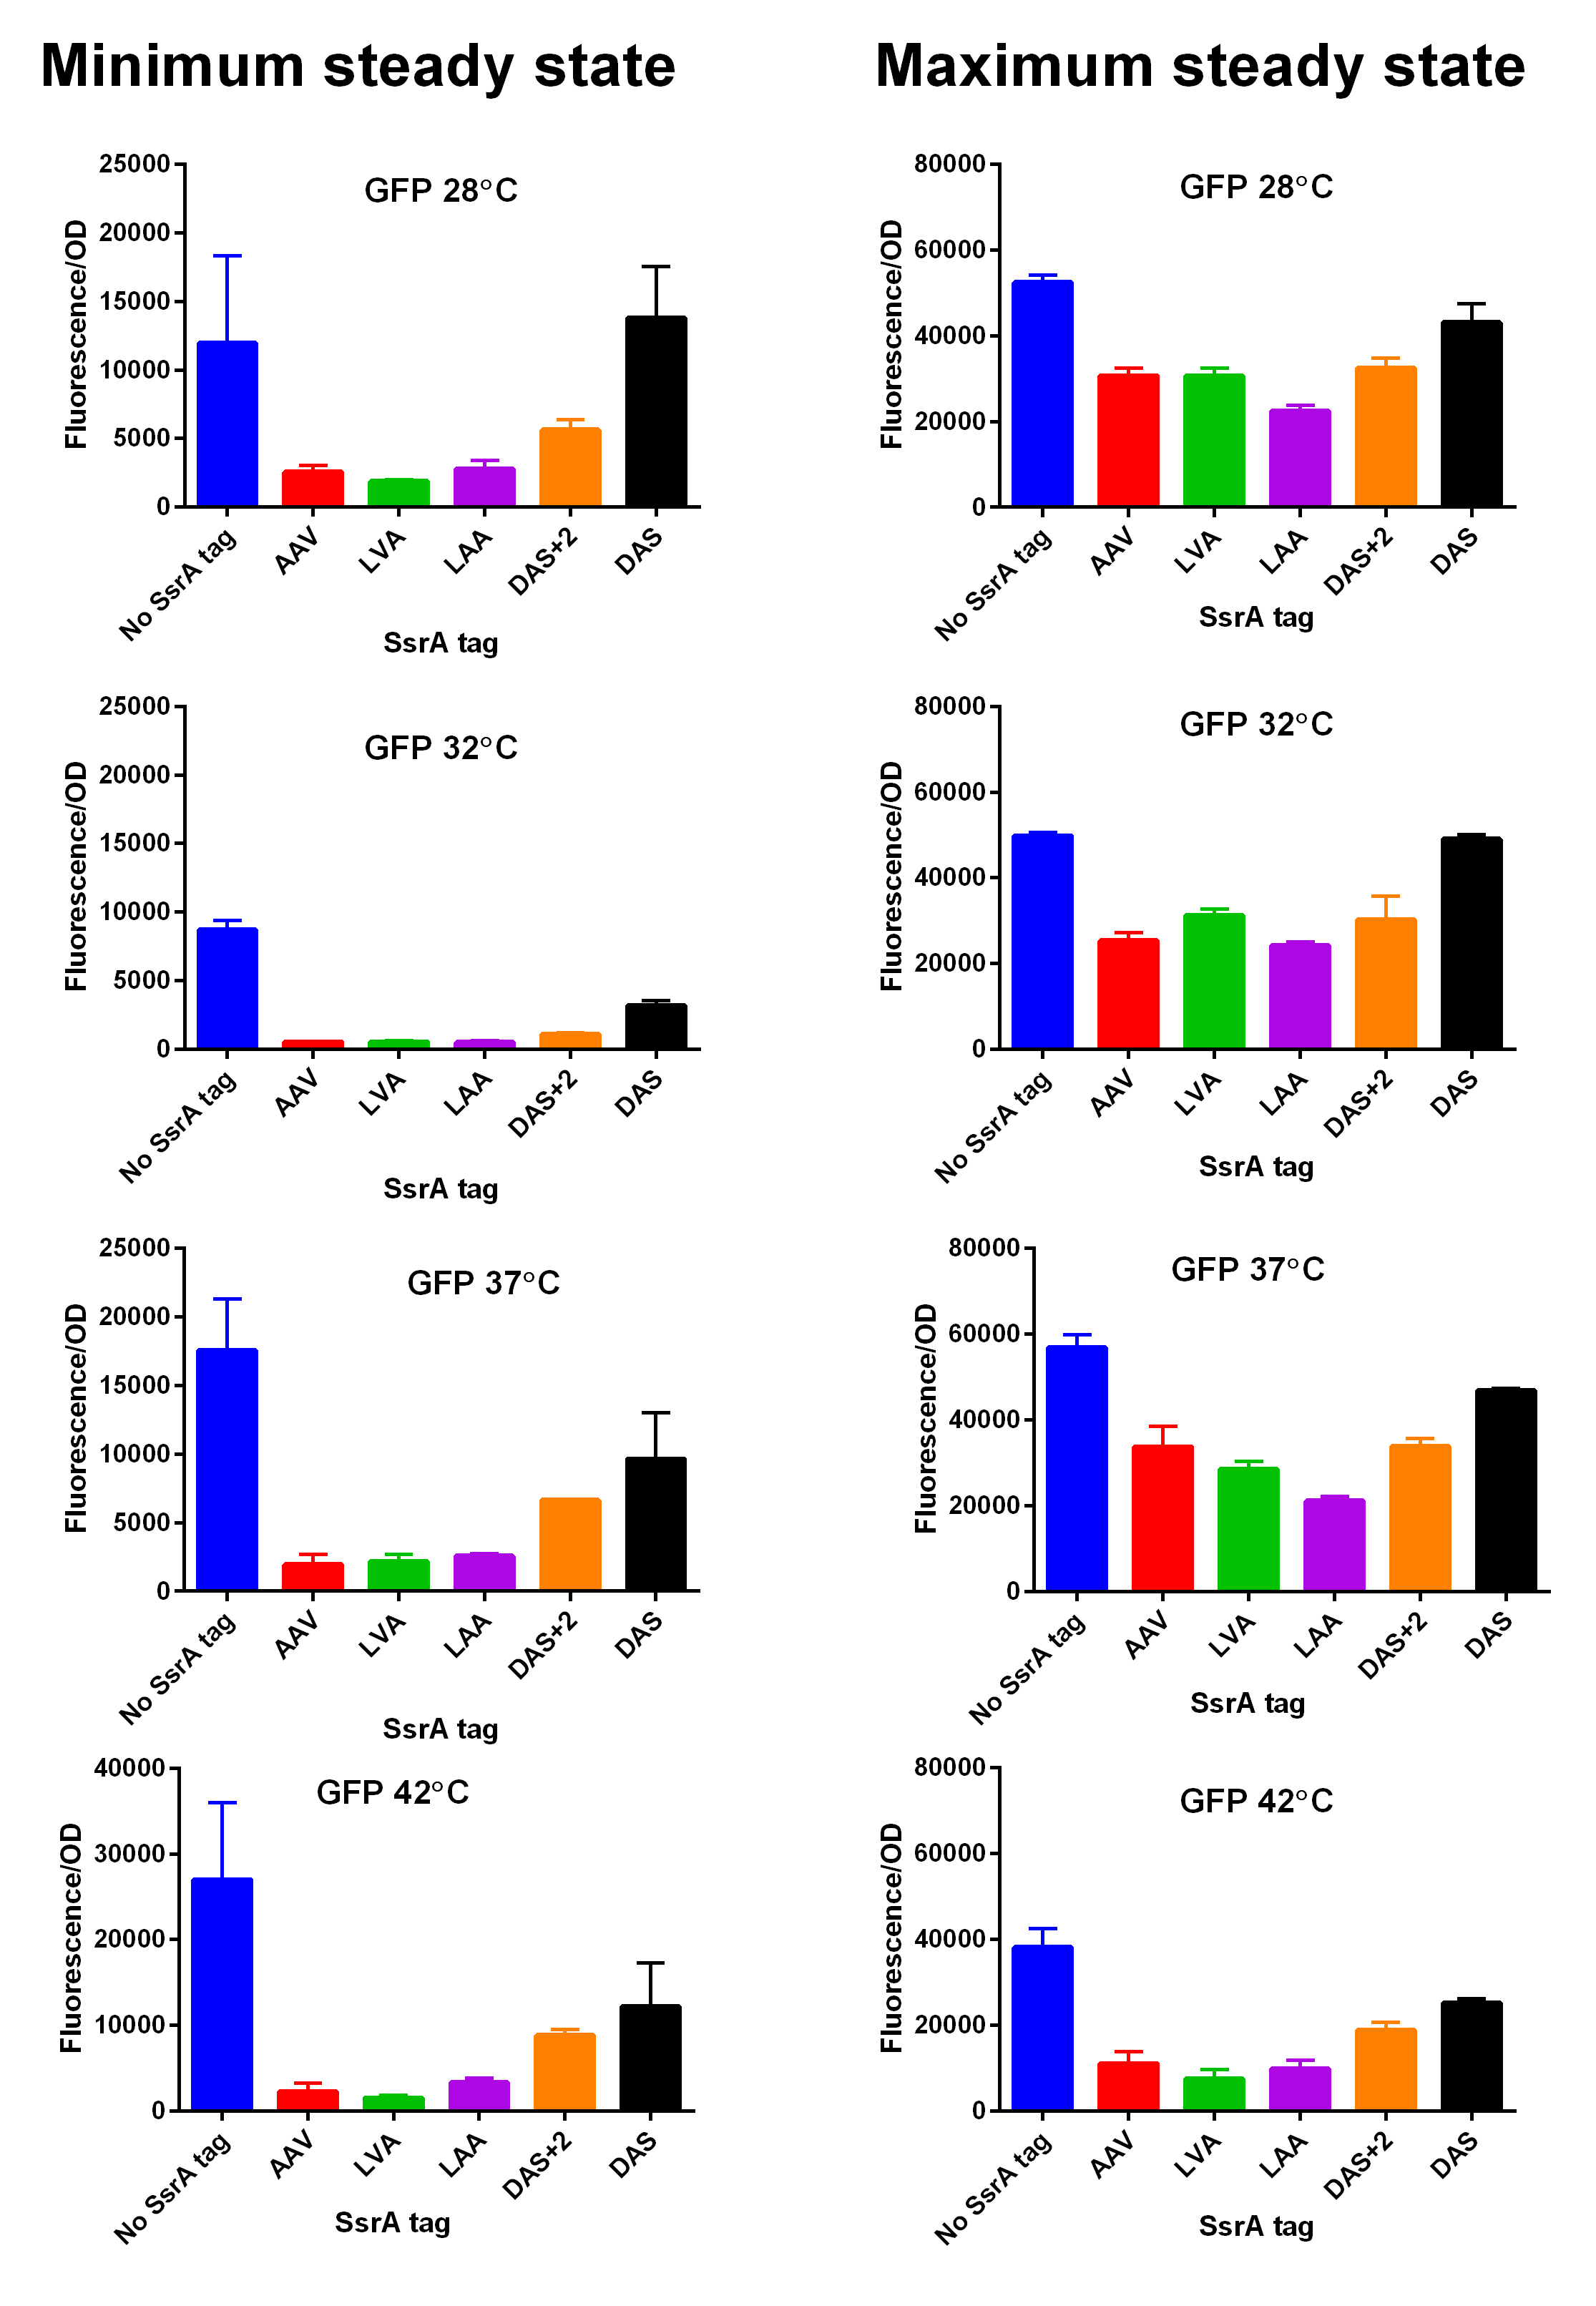
| + | We constructed lactose/IPTG inducible measurement pathway for this part ([[Part:BBa_K1399017]]) to characterize and compare the instability of this SsrA-LVA tagged GFP to others containing different variants of SsrA tags. We determined the steady state fluorescence/OD ratio of E. coli JM109 at uninduced (minimum steady state) and induced (maximum steady state) state. To see how the temperature of environment can affect protein degradation efficiency we repeated experiments in several temperatures (28⁰C, 32⁰C, 37⁰C and 42⁰C). Our data are summarised below. (For more information on SsrA degradation tag system, our experimental assays and results please visit our wiki page [http://2014.igem.org/Team:Edinburgh].) | ||
| + | [[File:EdiGEM14 GFP min and max values at different temperatures.jpg|600px|thumb|center|'''SsrA degron tagged GFP minimum (left) and maximum (right) fluorescence per OD at four different temperatures (28⁰C, 32⁰C, 37⁰C and 42⁰C).''']] [[File:EDiGEM14 GFP legend.png|500px|thumb|center|'''Summary of BioBricks to which our characterization data is applicable.''']] | ||
===User Reviews=== | ===User Reviews=== | ||
Latest revision as of 22:16, 15 October 2014
This experience page is provided so that any user may enter their experience using this part.
Please enter
how you used this part and how it worked out.
Applications of BBa_K1399007
We constructed lactose/IPTG inducible measurement pathway for this part (Part:BBa_K1399017) to characterize and compare the instability of this SsrA-LVA tagged GFP to others containing different variants of SsrA tags. We determined the steady state fluorescence/OD ratio of E. coli JM109 at uninduced (minimum steady state) and induced (maximum steady state) state. To see how the temperature of environment can affect protein degradation efficiency we repeated experiments in several temperatures (28⁰C, 32⁰C, 37⁰C and 42⁰C). Our data are summarised below. (For more information on SsrA degradation tag system, our experimental assays and results please visit our wiki page [http://2014.igem.org/Team:Edinburgh].)
User Reviews
UNIQ36862407ad82fd7e-partinfo-00000000-QINU UNIQ36862407ad82fd7e-partinfo-00000001-QINU


