Difference between revisions of "Part:BBa K1092003:Experience"
| Line 18: | Line 18: | ||
| − | Time series analysis were performed. The concentration of hydroquinone was monitored by UV spectrophotometer at 298 nm. | + | Time series analysis were performed. The concentration of hydroquinone was monitored by UV spectrophotometer at 298 nm. Empty vector-bearing (EV) and dioxygenase-overexpressing cells (T7-Dioxygenase) were induced by 0.3 mM IPTG at OD600 = 0.4, followed by 100 mg/L hydroquinone treatment. Cells were removed and extracellular hydroquinone was determined by OD298 at several intervals. Values represent the average of triplicate samples; error bars denote S.E.M. Paired t-test showed a significant difference in hydroquinone degradation trends between EV and dioxygenase-overexpressing cells (p ≤ 0.05)(Figure 2). |
Revision as of 03:30, 4 October 2013
This experience page is provided so that any user may enter their experience using this part.
Please enter
how you used this part and how it worked out.
Characterization of BBa_K1092003
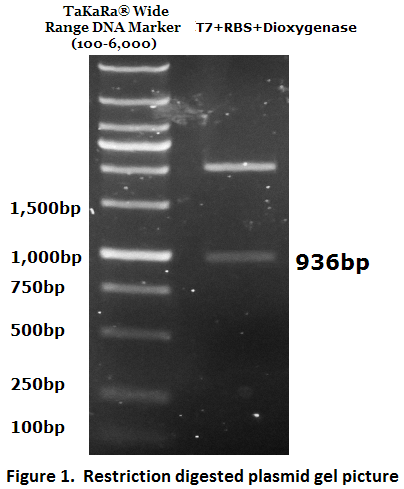
1. Biobrick DNA length verification
The inserted biobrick DNA length (936 bp) was confirmed by restriction digestion and agarose gel electrophoresis (Figure 1).
The DNA sequence was further verified by DNA sequencing.
2. Protein expression verification by time series degradation assay
Catechol 1,2-dioxygenase is resposible for phenol degredation (Naiem et al., 2011). Before it is integrated into our PAHs degrdation system, hydroquinone, also known as benzene-1,4-diol or quinol, which is an aromatic organic compound belonging to the phenol family, was used as a substrate to test Catechol 1,2-dioxygenase expression and activity.
Time series analysis were performed. The concentration of hydroquinone was monitored by UV spectrophotometer at 298 nm. Empty vector-bearing (EV) and dioxygenase-overexpressing cells (T7-Dioxygenase) were induced by 0.3 mM IPTG at OD600 = 0.4, followed by 100 mg/L hydroquinone treatment. Cells were removed and extracellular hydroquinone was determined by OD298 at several intervals. Values represent the average of triplicate samples; error bars denote S.E.M. Paired t-test showed a significant difference in hydroquinone degradation trends between EV and dioxygenase-overexpressing cells (p ≤ 0.05)(Figure 2).
User Reviews
UNIQ6ecdef1494da6fe7-partinfo-00000000-QINU UNIQ6ecdef1494da6fe7-partinfo-00000001-QINU


