Difference between revisions of "Part:BBa K1073022:Experience"
(→User Reviews) |
(→User Reviews) |
||
| Line 33: | Line 33: | ||
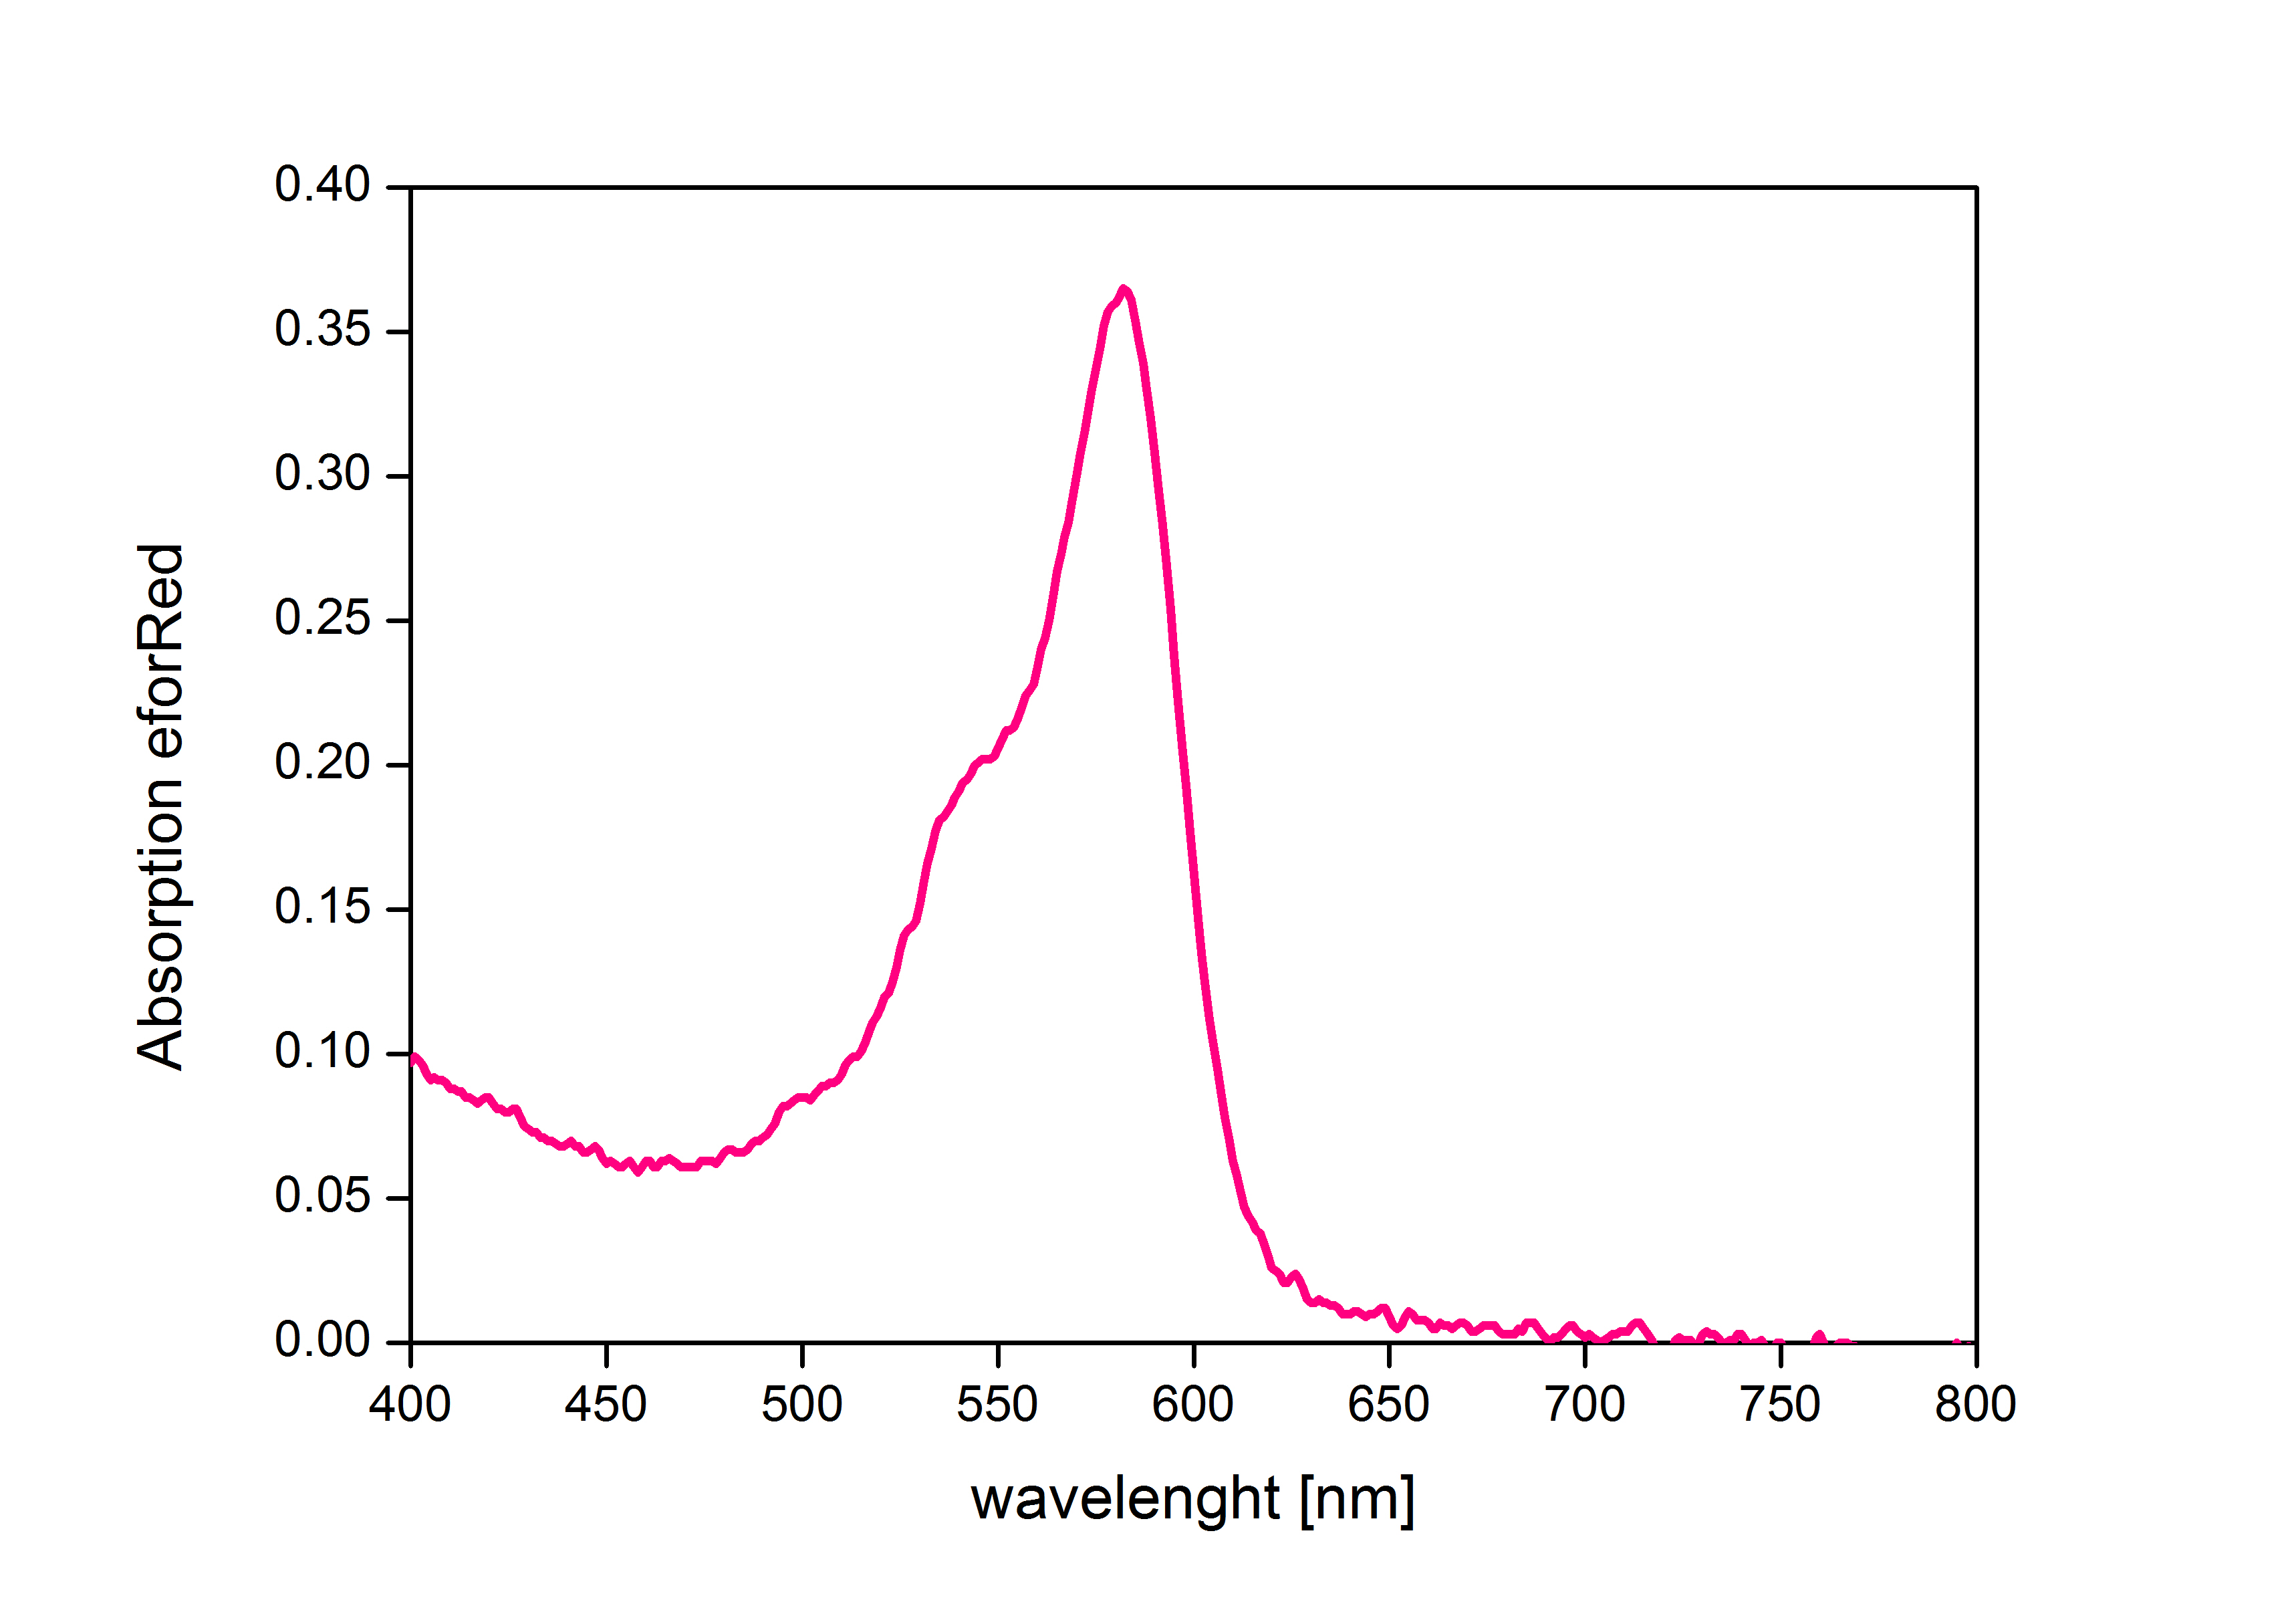
According to these results the optical density for growth curves of cells expressing this protein was measured at 520 nm with respect to the chromoproteins amilGFP (<partinfo>BBa_K1073024</partinfo>) and aeBlue (<partinfo>BBa_K1073020</partinfo>) to avoid absorption by the proteins. Comparing all absorption spectra they all show an absorption minimum at 520 nm. | According to these results the optical density for growth curves of cells expressing this protein was measured at 520 nm with respect to the chromoproteins amilGFP (<partinfo>BBa_K1073024</partinfo>) and aeBlue (<partinfo>BBa_K1073020</partinfo>) to avoid absorption by the proteins. Comparing all absorption spectra they all show an absorption minimum at 520 nm. | ||
| − | [[File:Fluorescence.JPG | | + | [[File:Fluorescence.JPG |200px]] |
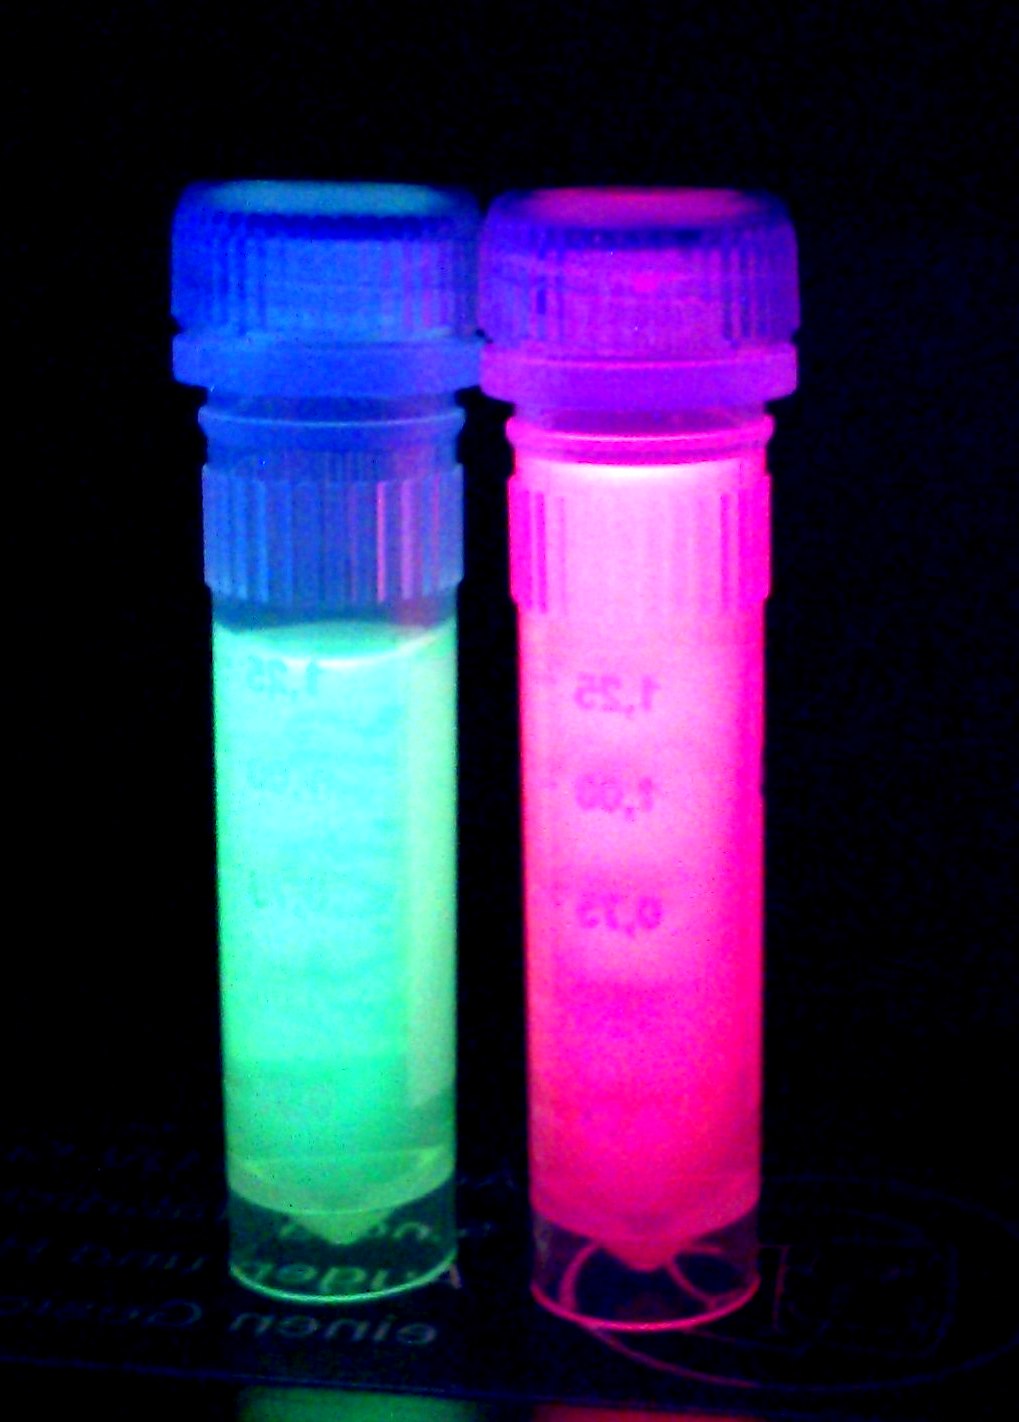
'''iGEM Team Braunschweig 2013:''' Supernatant after cell disruption containing chromoproteins of eforRed and amilGFP (<partinfo>BBa_K1073024</partinfo>). Both chromoproteins fluoresce when excited by UV-light. | '''iGEM Team Braunschweig 2013:''' Supernatant after cell disruption containing chromoproteins of eforRed and amilGFP (<partinfo>BBa_K1073024</partinfo>). Both chromoproteins fluoresce when excited by UV-light. | ||
Revision as of 14:19, 27 September 2013
This experience page is provided so that any user may enter their experience using this part.
Please enter
how you used this part and how it worked out.
Applications of BBa_K1073022
When eforRed is expressed the colonies on agar plates as well as cells liquid culture exhibit a bright pink color. The iGEM Team Braunschweig 2013 used this device to differentiate two different strains when incubated in a mixed culture.
User Reviews
UNIQa35e953190594ed9-partinfo-00000000-QINU
|
•••••
iGEM Team Braunschweig 2013 |
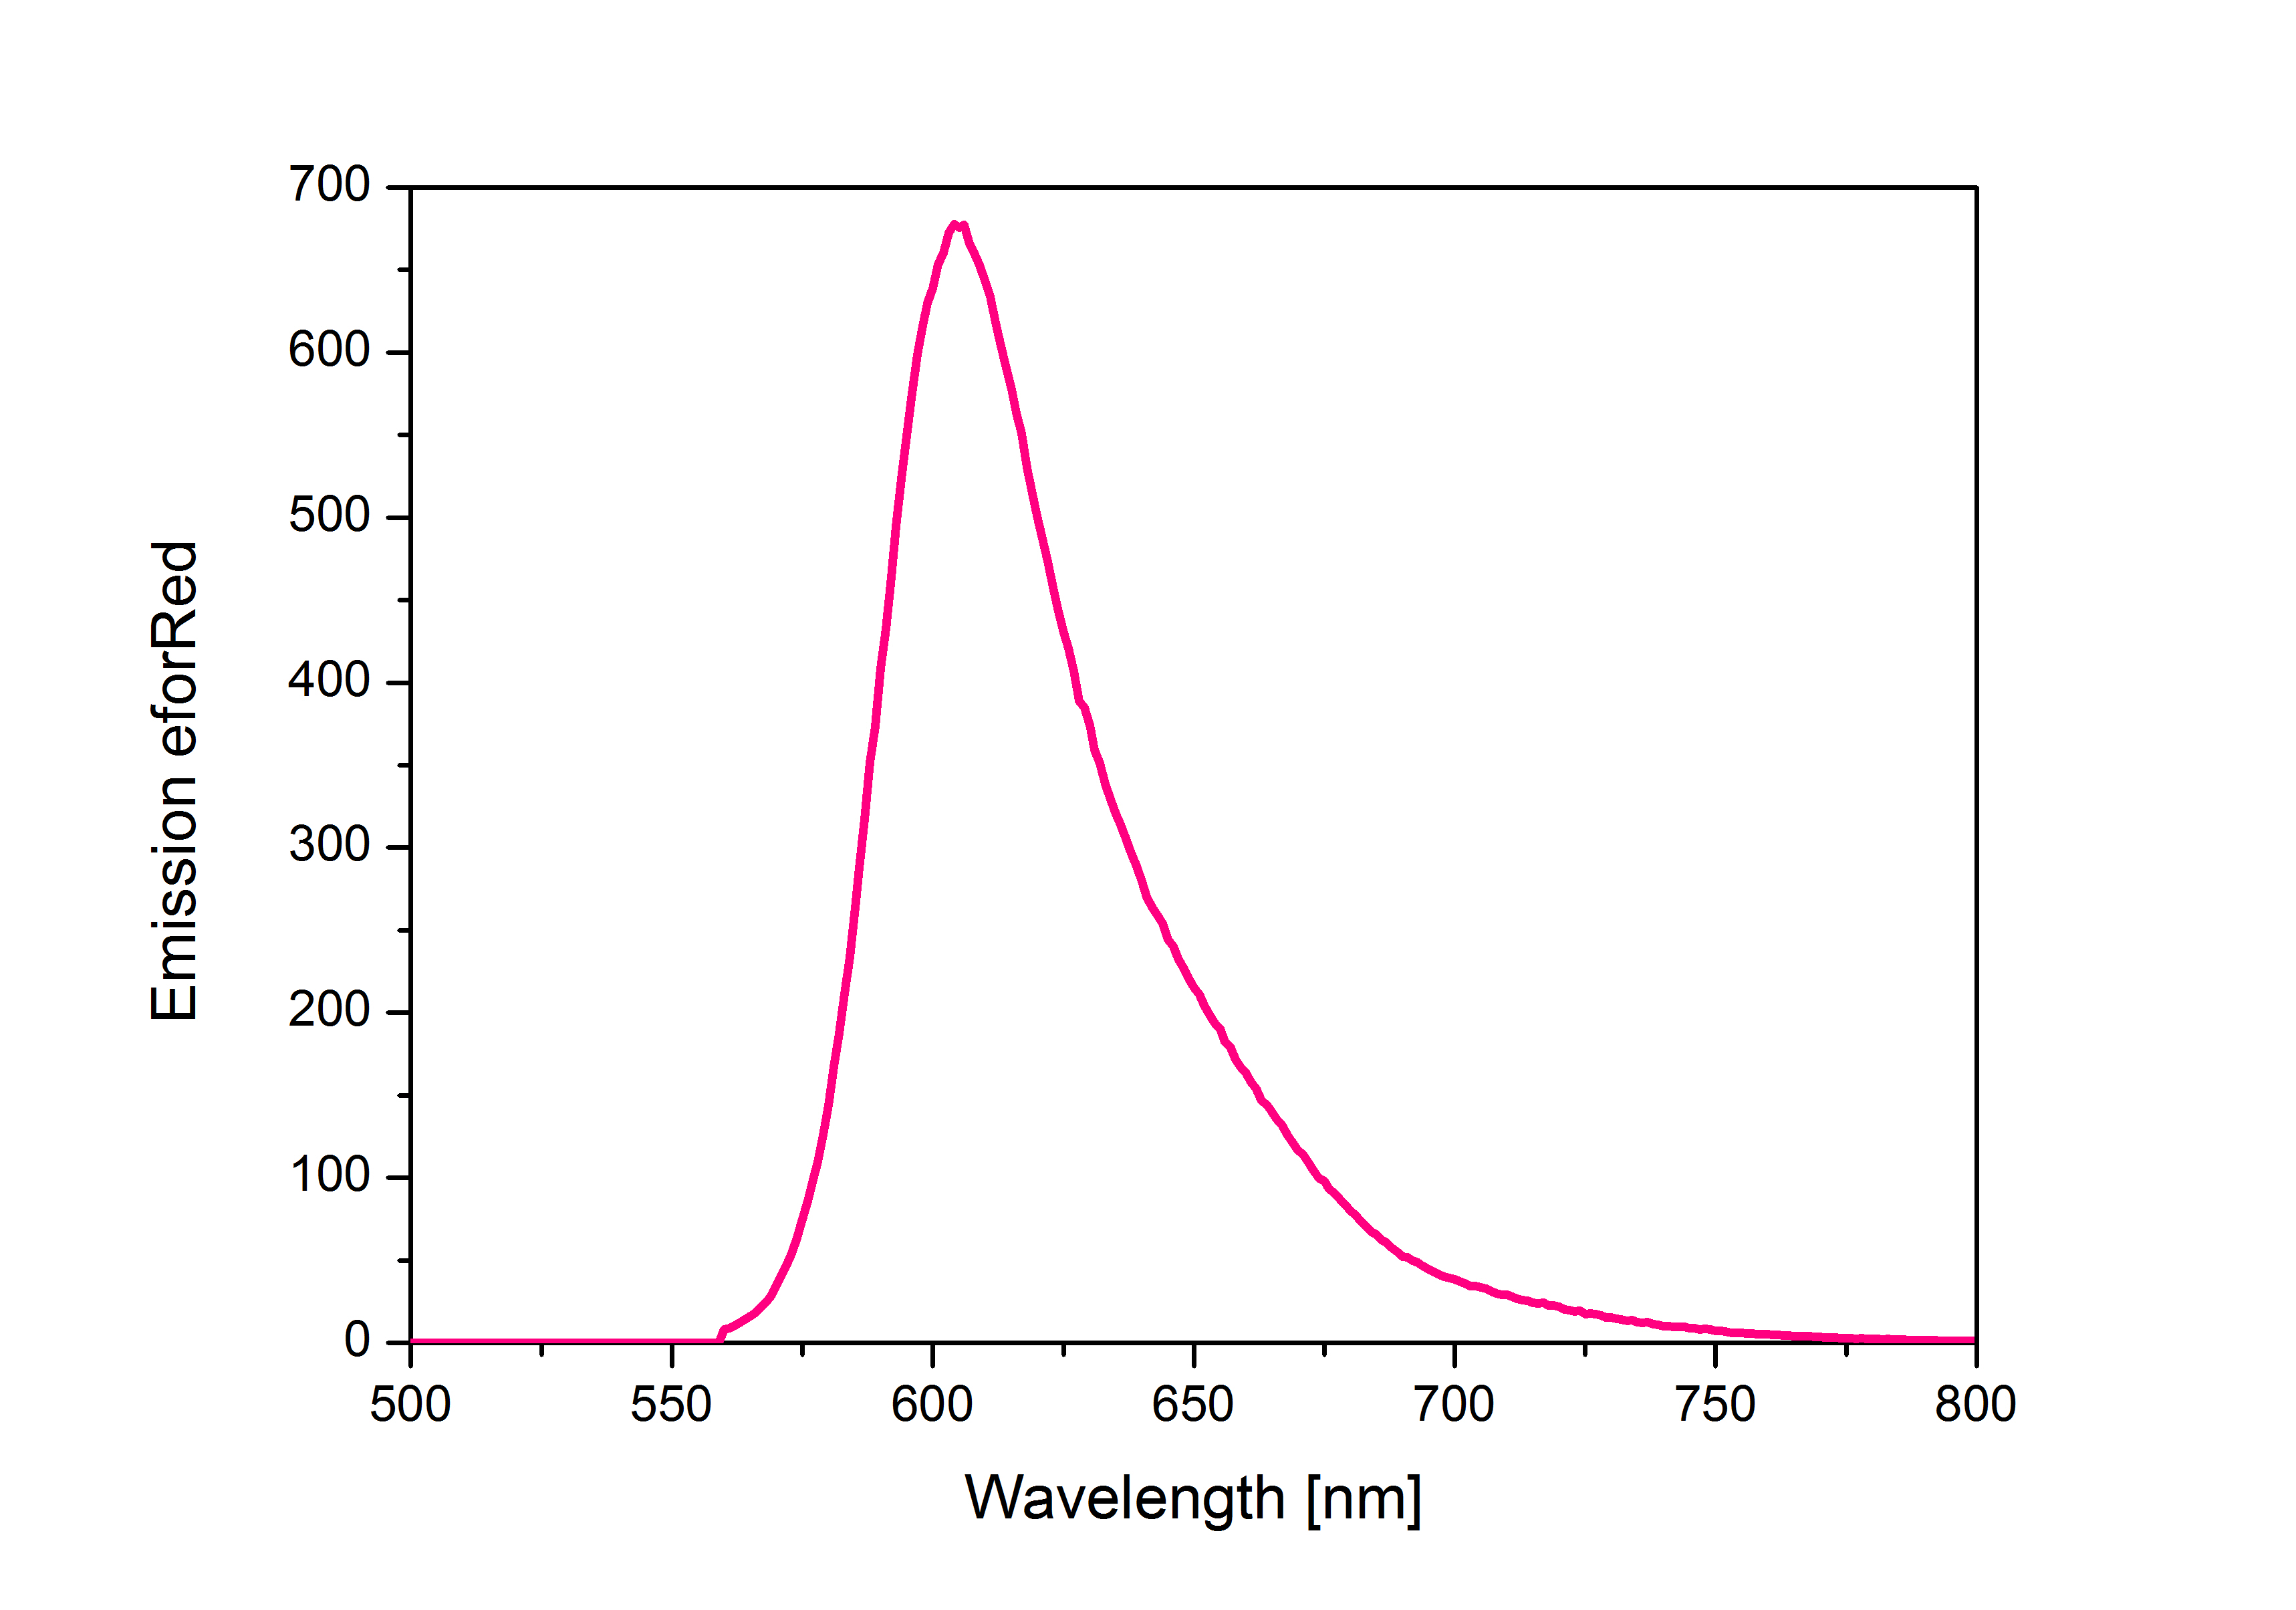
When expressed the chromoprotein eforRed exhibits a distinct pink color. In order to avoid absorption of the chomoproteins during measurement with the photometer the absorption and emission spectra were measured and an optimal wavelength for spectral optical density measurement was determined according to these spectra. iGEM Team Braunschweig 2013: Absorptionspectrum of chromoprotein eforRed in the wavelength range 400-800 nm. Absorption maximum of eforRed: 534 nm iGEM Team Braunschweig 2013: Emission spectrum of chromoprotein eforRed. This chromoprotein does show significant emission and can be detected by its fluorescence as well as by naked eye. Emission maximum of eforRed: 605,4 nm
iGEM Team Braunschweig 2013: Supernatant after cell disruption containing chromoproteins of eforRed and amilGFP (BBa_K1073024). Both chromoproteins fluoresce when excited by UV-light. |
UNIQa35e953190594ed9-partinfo-00000005-QINU


