Difference between revisions of "BBa K731700 and BBa K731710 measurements"
| Line 1: | Line 1: | ||
| − | This page is meant to explain the experiments that were done to determine the best protocol for the characterization of transcriptional terminators with the two platforms [[Part:BBa_K731700|BBa_K731700]] and [[Part:BBa_K731710|BBa_K731710]]. | + | This page is meant to explain the experiments that were done to determine the best protocol for the characterization of transcriptional terminators with the two platforms [[Part:BBa_K731700|BBa_K731700]] and [[Part:BBa_K731710|BBa_K731710]]. Theoretically, the protocol works for any platform that exploits a bicistronic message encoding two fluorescent proteins. |
The definitive protocol we developed was used for the ''in vivo'' characterization of both the platforms using two terminators that, in this way, were characterized too. More specifically, they are the rrnB T1 ([[Part:BBa_K731722|BBa_K731722]]) and T7 bacteriophage wild type terminator ([[Part:BBa_K731721|BBa_K731721]]). | The definitive protocol we developed was used for the ''in vivo'' characterization of both the platforms using two terminators that, in this way, were characterized too. More specifically, they are the rrnB T1 ([[Part:BBa_K731722|BBa_K731722]]) and T7 bacteriophage wild type terminator ([[Part:BBa_K731721|BBa_K731721]]). | ||
Revision as of 07:21, 24 October 2012
This page is meant to explain the experiments that were done to determine the best protocol for the characterization of transcriptional terminators with the two platforms BBa_K731700 and BBa_K731710. Theoretically, the protocol works for any platform that exploits a bicistronic message encoding two fluorescent proteins.
The definitive protocol we developed was used for the in vivo characterization of both the platforms using two terminators that, in this way, were characterized too. More specifically, they are the rrnB T1 (BBa_K731722) and T7 bacteriophage wild type terminator (BBa_K731721).
Difficulties in obtaining reliable data and the use of expansive instruments (FACS) are often encountered when approaching this task. With this easy protocol we obtained reliable results and really low standard deviations.
IN VIVO ANALYSIS
|
BEFORE STARTING:
NOTE1:Antibiotic are at concentration of 0.1mg/ml ampicillin and 0.035mg/ml cloranphenicol NOTE2:Four glycerol stocks for both control and sample will give you a good level of significance
|
PROTOCOL DEVELOPMENT:
Emission and Excitation parameter choise:
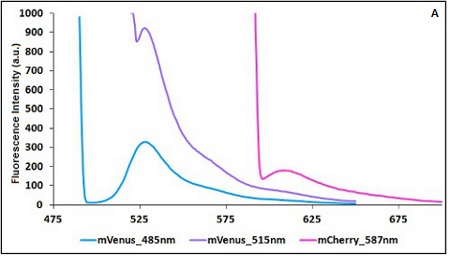
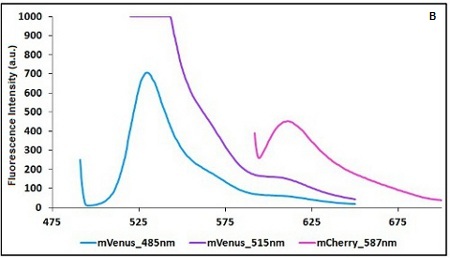
The two proteins in use in BBa_K731700 and BBa_K731710 are mCherry and A206K Venus (mVenus), respectively upstream and downstream of the terminator. After excitation of the two proteins with standard parameters, we noticed a huge difference in fluorescence intensity between the two peaks, as mVenus emission peak was about 10 times stronger than the mCherry peak.
In this case a shift of the brighter protein (mVenus) excitation wavelength toward smaller wavelength can bring two main benefits:
- A decrease in emission peak's fluorescence intensity
- A larger gap between the excitation wavelength and the emission peak's wavelength
Moreover, the less bright protein (mCherry) was measured at a slightly higher wavelength than the peak seen in the emission spectrum.
Here is a summary of the wavelengths used to take the measurements with BBa_K731700 and BBa_K731710:
| Standard Excitation (nm) | Standard Emission (nm) | Modified Excitation (nm) | Modified Emission (nm) | |
| mCherry | 587 | 610 | 587 | 615 |
| mVenus | 515 | 528 | 485 | 528 |
TABLE 1: Standard and modified excitation and emission wavelengths
CHART 1A/B: Emission scan of BBa_K731700 (A) and BBa_K731710 (B) with standard and modified excitation wavelenght. The measurements were taken with a Varian Cary Eclipse spectrofluorimeter, with 5nm slit and a voltage of 570 V (A) and 520 V (B))
Sonication of the samples:
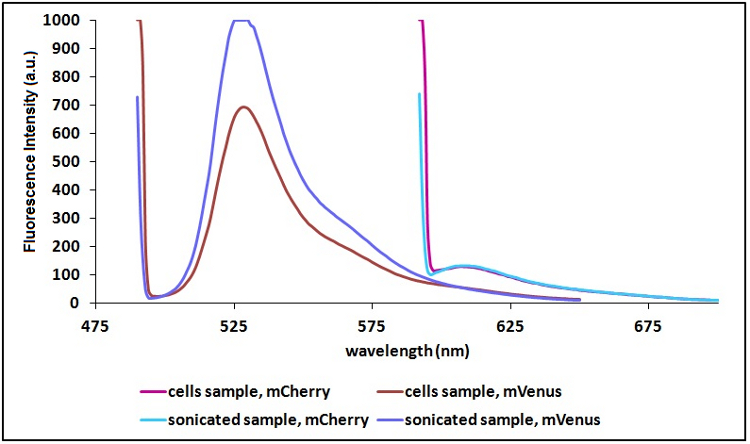
In order to reduce the scattering due to excitation light and thus to have a clearer signal, we decided to sonicate our sample before measure them. Both the improvements are due to the lower O.D. of a sonicated sample compared to a cell suspension sample. A higher O.D. causes a decrease in light intensity emitted by the fluorescent proteins that reach the sensor, a decrease in the exciting light that actually reach the fluorescent proteins and an increase in the excitation light that is reflected to the sensor (increase in scattering).
Test on different colonies:
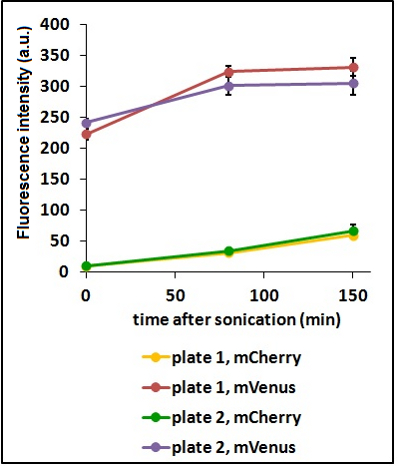
The use of glycerol stock instead of O.N cultures makes the procedure easier and faster. However, glycerol stocks come from the same colony; to verify the consistency of our results we tested some different colonies from two different plates.
CHART 3: Fluorescence emission raw peaks of two cultures from colonies from different plates.
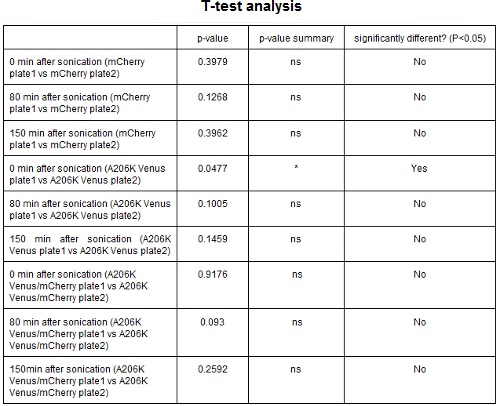
TABLE 2: The table shows the statistic analysis performed on the data in CHART 3. Neither the proteins peaks of the two plates nor their ratio are significantly different (the result of "0 min after sonication (A206K Venus plate 1 vs A206K Venus plate 2)" is considered a false positive since the other two times show no significant difference).
Different concentrations of inducing agent:
The use of different concentration of inducing agent should not influence the ratio between the fluorescence intensity of the two proteins. Nevertheless the inducing agent concentration may have influence on the quantity of proteins synthesized. We tested two different concentration of isopropyl β-D-1-thiogalactopyranoside (IPTG).
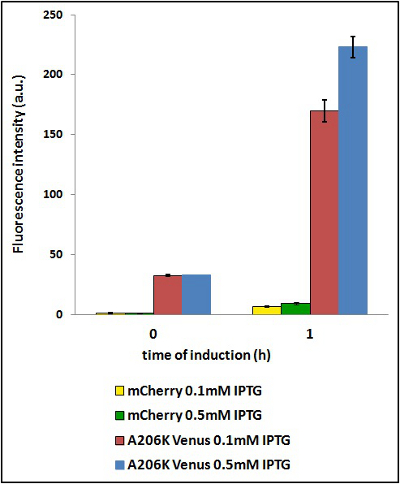
CHART 4: Raw emission peaks of coltures iduced with 0.1 mM or 0.5 mM IPTG. The measurements were taken just after induction (time 0) and after 90 minutes (time 1).
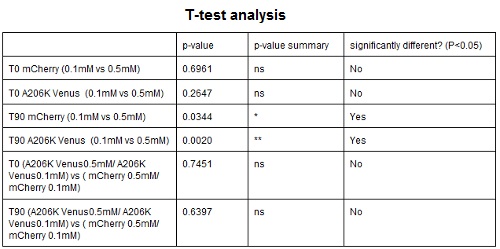
TABLE 3: The table shows the statistic analysis permormed on the data in CHART 4. There is no significant difference between the two samples with different IPTG concentration at time 0; significant differences are instead shown between the samples at induction time 90 min. The t-tests also show that the % increase in protein expression between 0.1mM e 0.5mM is the same in the two proteins.
O.D. equalization:
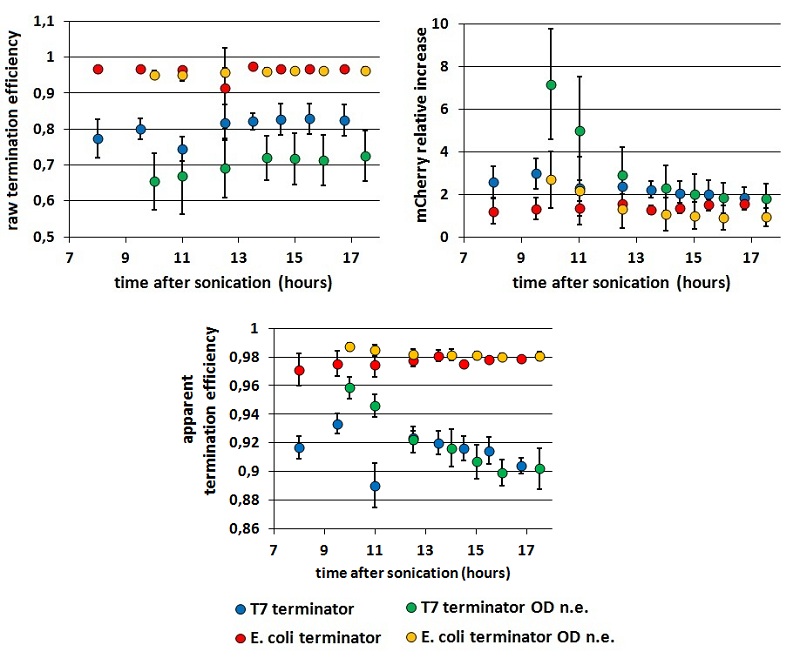
The apparent termination efficiency (Ea), defined in literature [1] as Ea=1-(Vs/Cs×Cc/Vc) , is composed of two components: the first due to the mVenus variation, the second to the mCherry variation. We called the former the ”raw” termination efficiency (Er=1-Vs/Vc), as it considers just the downstream gene contribution; the latter is the relative increase in upstream gene expression (RI= Cs/Cc).To distinguish these two components we had to compare each emission raw peak with the relative peak in the control construct. To make the results reliable and accurate we decided to equalize the optical densities (O.D.) of the cultures to be compared before the induction. Briefly, at a certain point of the cultures growth, we measured the O.D. On the basis of these measurements, we diluted the samples to an O.D. of exactly 0.2. When they reached O.D. 0.6, the protein synthesis was induced with 0.5mM IPTG. The effect on the final results of this additional step in the protocol is shown below (Fig.xxx). We knew from [2] that during the first hours after protein synthesis, fluorescence keeps growing as a consequence of protein foling and chromophore oxidation. mCherry and mVenus kinetics were further investigated, and the variations in Er, RI and Ea were analyzed over a wide time lapse after the initial term of fluorescence stabilization.
FIGURE 2. Raw fluorescence emission peaks in time.
(A) the mCherry raw peaks obtained from the measurements with the T7 promoter platform (BBa_K731700). (B) mVenus raw peaks obtained with the tac promoter platform (BBa_K731710). The samples were left overnight in the refrigerator, allowing fluorescence stabilization (protein folding and chromophore oxidation [###]). Note that the X axis of the chart’s right side expresses the days after sonication and not the hours. The same is for the following charts.
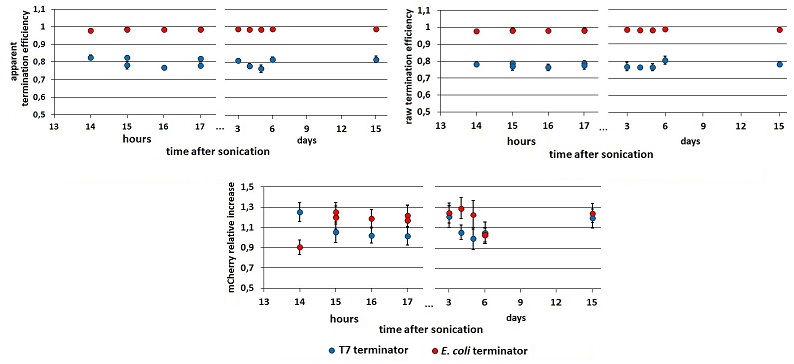
FIGURE 2. Ea, Er and RI in time.
Left and right panels show the apparent and raw termination efficiency, respectively. The bottom chart represents the increase in mCherry expression compared to the control construct without intervening terminator. Data from BBa_K731710 measurements.
While raw peaks are quite variable, especially with the control construct, the termination efficiencies are stable in time. Both the mCherry raw emission and the relative increase in its expression is more variable than mVenus relative quantities. We saw this in all our experiments but we have no explanation to this at all. We tested the consequences of the O.D. equalization additional step measuring cultures which O.D.s were and were not equalized before induction,
FIGURE 2. Comparison between results obtained equalizing of not cultures' O.D.s before induction
: The chart shows Er, RI and Ea kinetics obtained equalizing or not the coltures' O.D.s before induction. These data are calculated from measurements with BBa_K731700 (the T7 promoter platform).
From the data represented above we derived two main conclusions:
- the results seem to stabilize well 13 hours after sonication, while before that time their variability is still considerable.
- as we could expect, the O.D.s equalization step decrease the variability in Er and RI, while has less influence on Ea.
Moreover, it is evident a higher variability in data obtained with the T7 terminator, if compared with those obtained with the E. coli terminator. We report this observation, but can’t explain it.
Conclusion.
According to our results, the minor standard deviation is achieved exciting mVenus at 485nm and measuring mCherry emission at 615nm; sonicating the sample, incubating at 4°C and taking measurements about 13 hours later. After that, the results seem stable for several days .
"You can sonicate the evening before holidays, and measure when you come back" [Giaco the dwarf]
All the measurements were taken in quadruplicate (4 sonicated samples from the same culture), and repeated the next day. We limited our analysis on two fluorescent proteins, two promoters and two terminators; many other combination could be tested.

